Article Text

Abstract
Objective To examine 27 low-value procedures, as defined by international recommendations, in New South Wales public hospitals.
Design Analysis of admitted patient data for financial years 2010–2011 to 2016–2017.
Main outcome measures Number and proportion of episodes identified as low value by two definitions (narrower and broader), associated costs and bed-days, and variation between hospitals in financial year 2016–2017; trends in numbers of low-value episodes from 2010–2011 to 2016–2017.
Results For 27 procedures in 2016–2017, we identified 5079 (narrower definition) to 8855 (broader definition) episodes involving low-value care (11.00%–19.18% of all 46 169 episodes involving these services). These episodes were associated with total inpatient costs of $A49.9 million (narrower) to $A99.3 million (broader), which was 7.4% (narrower) to 14.7% (broader) of the total $A674.6 million costs for all episodes involving these procedures in 2016–2017, and involved 14 348 (narrower) to 29 705 (broader) bed-days. Half the procedures accounted for less than 2% of all low-value episodes identified; three of these had no low-value episodes in 2016–2017. The proportion of low-value care varied widely between hospitals. Of the 14 procedures accounting for most low-value care, seven showed decreasing trends from 2010–2011 to 2016–2017, while three (colonoscopy for constipation, endoscopy for dyspepsia, sentinel lymph node biopsy for melanoma in situ) showed increasing trends.
Conclusions Low-value care in this Australian public hospital setting is not common for most of the measured procedures, but colonoscopy for constipation, endoscopy for dyspepsia and sentinel lymph node biopys for melanoma in situ require further investigation and action to reverse increasing trends. The variation between procedures and hospitals may imply different drivers and potential remedies.
- health services research
- healthcare quality improvement
- health policy
This is an open access article distributed in accordance with the Creative Commons Attribution Non Commercial (CC BY-NC 4.0) license, which permits others to distribute, remix, adapt, build upon this work non-commercially, and license their derivative works on different terms, provided the original work is properly cited, appropriate credit is given, any changes made indicated, and the use is non-commercial. See: http://creativecommons.org/licenses/by-nc/4.0/.
Statistics from Altmetric.com
Introduction
One important component of efforts to increase value in healthcare is identifying and minimising use of ‘low-value care’, defined as
use of an intervention where evidence suggests it confers no or very little benefit on patients, or risk of harm exceeds likely benefit, or, more broadly, the added costs of the intervention do not provide proportional added benefits.1
Reducing low-value care is important for improving both health outcomes for patients and the efficiency of the health system. Such quality improvement depends on knowing how much low-value care occurs, where and why it occurs.
Despite national and international campaigns drawing attention to the concept of low-value care, including the Choosing Wisely and Royal Australasian College of Physicians (RACP) EVOLVE initiatives,2–4 we have limited understanding of the extent of these practices in Australia5 6; measurement work to date has taken place almost exclusively in North America.7 We aimed to use indicators based on hospital administrative data to examine low-value care in New South Wales (NSW) public hospitals. By restricting to this setting, we are estimating low-value care that is the responsibility of a single payer (NSW Health).
Many studies of low-value care are based on indirect measures.1 For example, geographic variation analysis examines rates of services in different areas, with the interpretation that higher than average rates may be partly due to overuse or low-value care. In contrast, our work involves direct measurement—specifically identifying episodes where the care appears to be contrary to published recommendations.
Our study provides estimates of low-value care involving 27 procedures in the NSW public hospital system in 2016–2017 and the associated costs, together with trends over the preceding 7 years.
Methods
Setting and data
NSW is the most populous state of Australia, with 7.6 million residents in 2015 (www.healthstats.nsw.gov.au). There are 225 public hospitals and 203 private hospitals.8 For this study, we focused on public hospitals, which provided almost 2 million episodes of inpatient care in financial year 2016–2017. Care at a public hospital is available free to residents, but patients may choose to be admitted to a public hospital as a private patient, using private health insurance. We included both public and private patients at public hospitals in this study.
We used hospital admitted patient data in the Health Information Exchange (HIE) data warehouse at the NSW Ministry of Health for the seven financial years (1 July to 30 June) 2010–2011 to 2016–2017. Hospital admissions are recorded as ‘stays’, which comprise one or more ‘episodes’. A new episode begins when care type changes (eg, from acute care to rehabilitation). Details of diagnoses and procedures are recorded for each episode.
We extracted the following variables: facility identifier, stay number and episode sequence number (to identify episodes); encrypted patient identifier (to identify admissions by the same patient); Australian Classification of Health Interventions procedure codes (to identify the procedure, and determine if it was low value); International Classification of Diseases, 10th Revision, Australian Modification (ICD-10-AM) diagnosis codes (to identify if the procedure was low value); episode length of stay (for bed-days); and episode start and end dates (to limit to study period).
The NSW hospital admissions data allow recording up to 50 procedure codes and 55 diagnosis codes. These include one principal procedure (which should be the procedure the patient was admitted for) and one principal diagnosis (which should be the diagnosis responsible for most of the hospital stay). For most indicators, we accepted procedure and diagnosis codes in any position, without distinguishing between principal and additional codes. American Society of Anesthesiologists risk scores were obtained from the sixth digit of the anaesthesia procedure codes.9 Family history of disease was recorded if an ICD-10-AM code for family history of the disease (a relevant ‘Z’ chapter code) was present. Personal history was recorded if an ICD-10-AM code for personal history was present (relevant ‘Z’ code), or if a code for the disease itself was present. For some indicators, we examined diagnosis codes for any episodes recorded for the same patient in the previous 12 months when looking for diagnoses that justify the procedure. However, the data set was not fully linked; in general, previous admissions for patients could only be identified if they were to the same hospital as the index admission.
Total costs for episodes involving low-value care were extracted from the NSW Health Activity Based Management casemix database to provide an estimate of expenditure associated with providing these ‘index’ low-value services (ie, only expenditure on the episode involving the low-value intervention, not any follow-up expenditure that may have resulted at a later date due to the index event).
Analysis
We identified low-value episodes for 27 procedures (online supplementary table 1) using an approach based on seminal work in the USA.10 In brief, international and Australian recommendations as to when a test or intervention is low value (such as those produced via Choosing Wisely,3 11–13 RACP EVOLVE4 and the UK National Institute for Health and Care Excellence ‘do not do’ recommendations14) were reviewed to identify those that are measurable in the data. For a recommendation to be measurable, we applied previously reported criteria15:
It had to relate to care that can occur in the NSW inpatient setting.
It had to involve a service that can be recorded in the admissions data (eg, prescribing and pathology requests are not recorded in this data set).
It had to be possible to reasonably identify low-value care using the variables in the data.
The care had to be normally recorded in the data (eg, Australian Coding Rules state that most imaging procedures are ‘not normally coded’).
Supplementary file 1
We translated the 27 measurable recommendations into operational definitions expressed in terms of the variables in the data set (online supplementary table 1). Because terms in the recommendation often do not map directly to data variables, and diagnosis and procedure codes may not precisely identify patients for whom care is low value, there is inherent uncertainty in identifying whether an intervention is low value when using administrative data. To account for this uncertainty, following the method implemented by Schwartz et al,10 we created narrower and broader definitions of low-value care.15 We first developed a narrower definition that aimed to capture only low-value care, at risk of not identifying all low-value care, then broadened the criteria to try to capture all low-value care, at risk of including appropriate care (see online supplementary box 1 for example). We then convened a workshop where 27 clinicians reviewed the overall method, and then in groups reviewed three to five indicators each for face validity and acceptability (see online supplementary box 2 for specialties involved in the review).15 In addition, a health information manager reviewed the indicators to identify inappropriate or omitted diagnosis and procedure codes.
Our analysis was from the health payer perspective, using a ‘service-based measure’, one of three low-value care measurement perspectives detailed in the framework by Chalmers et al. 16 We identified episodes in which each procedure was provided, and calculated the proportion of these that were low value. This measure provides an indication of how much health system activity is low value.
Our main analysis is a snapshot for financial year 2016–2017 that provides a baseline for future monitoring. We present numbers and proportions of low-value care for the 27 procedures, together with the costs and bed-days associated with these episodes for NSW as a whole. We also show the variation between hospitals. For each procedure, smoothed 99% binomial control limits around the mean state rate were calculated for each hospital using the number of procedures provided by the hospital.17 Hospitals with percentages of low-value episodes outside these limits were classified as having high or low rates. To ensure sufficient numbers when examining hospital variation, we excluded hospitals that did not perform the procedure in at least five episodes in 2016–2017 (these hospitals are regarded as not normally performing the procedure), and then excluded procedures that did not occur at more than five hospitals (to preserve hospital anonymity).
For the 14 procedures with highest levels of low-value care in 2016–2017, we estimated average percentage changes in numbers of low-value episodes over financial years 2010–2011 to 2016–2017. Numbers of narrower and broader definition low-value procedures and non-low-value procedures are plotted for each financial year.
Analysis was conducted in R V.3.4.1 (www.r-project.org), after relevant episodes had been extracted using SQL queries in the HIE Sybase IQ server.
Results
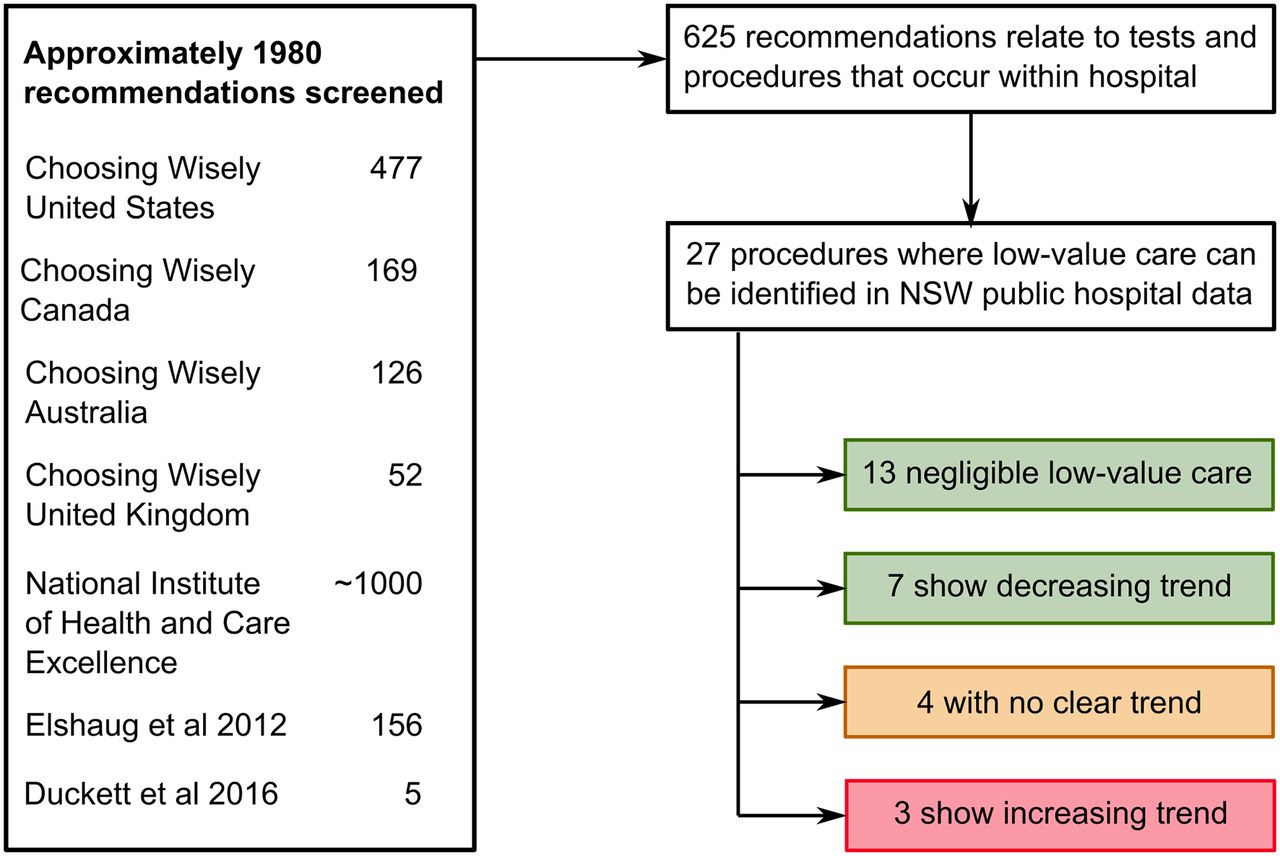
In total for the 27 procedures in 2016–2017, we identified 5079 episodes as low value according to our narrower definitions, or 8855 as low value according to the broader definitions. These accounted for 11.00% (broader, 19.18%) of all 46 169 episodes involving any of these procedures. Figure 1 and table 1 provide an overall summary of the study. Thirteen of the 27 procedures accounted for 1.1% of the low-value episodes. Three of these (postoperative radiotherapy after radical prostatectomy, endometrial biopsy for investigation of infertility and electroconvulsive therapy in children) had no low-value care in NSW public hospitals in 2016–2017.

Overall summary of the study. ‘Negligible’ low-value care defined as below median count of low-value episodes (narrower definitions) for the 27 procedures (see table 1). Trends refer to average annual percentage change (see table 1). Red indicates procedures that are priority for investigation, orange indicates procedures that require active monitoring, and green indicates procedures that require only background surveillance to ensure numbers and trends continue low and decreasing. NSW, New South Wales.
Counts and rates of low-value care for 27 procedures, and average annual percentage change in low-value episodes for 14 procedures with higher volumes of low-value care
The total cost of episodes involving low-value care for these 27 procedures in 2016–2017 was $A49.9 million (narrower) to $A99.3 million (broader) (table 2). This was 7.4% (narrower) to 14.7% (broader) of the total $A674.6 million costs for all episodes involving these procedures in 2016–2017. Abdominal hysterectomy accounted for the greatest total costs for low-value care ($A10.5 million (narrower) to $A17.1 million (broader); median $A9700 per episode), followed by endoscopy ($A10.4 million (narrower) to $A12.8 million (broader); median $A2200 per episode) and colonoscopy ($A9.4 million (narrower) to $A13.4 million (broader); median $A6735 per episode). Episodes involving low-value care for these 27 procedures accounted for 14 348 (narrower) to 29 705 (broader) bed-days in 2016–2017 (table 2).
Costs associated with episodes involving low-value care
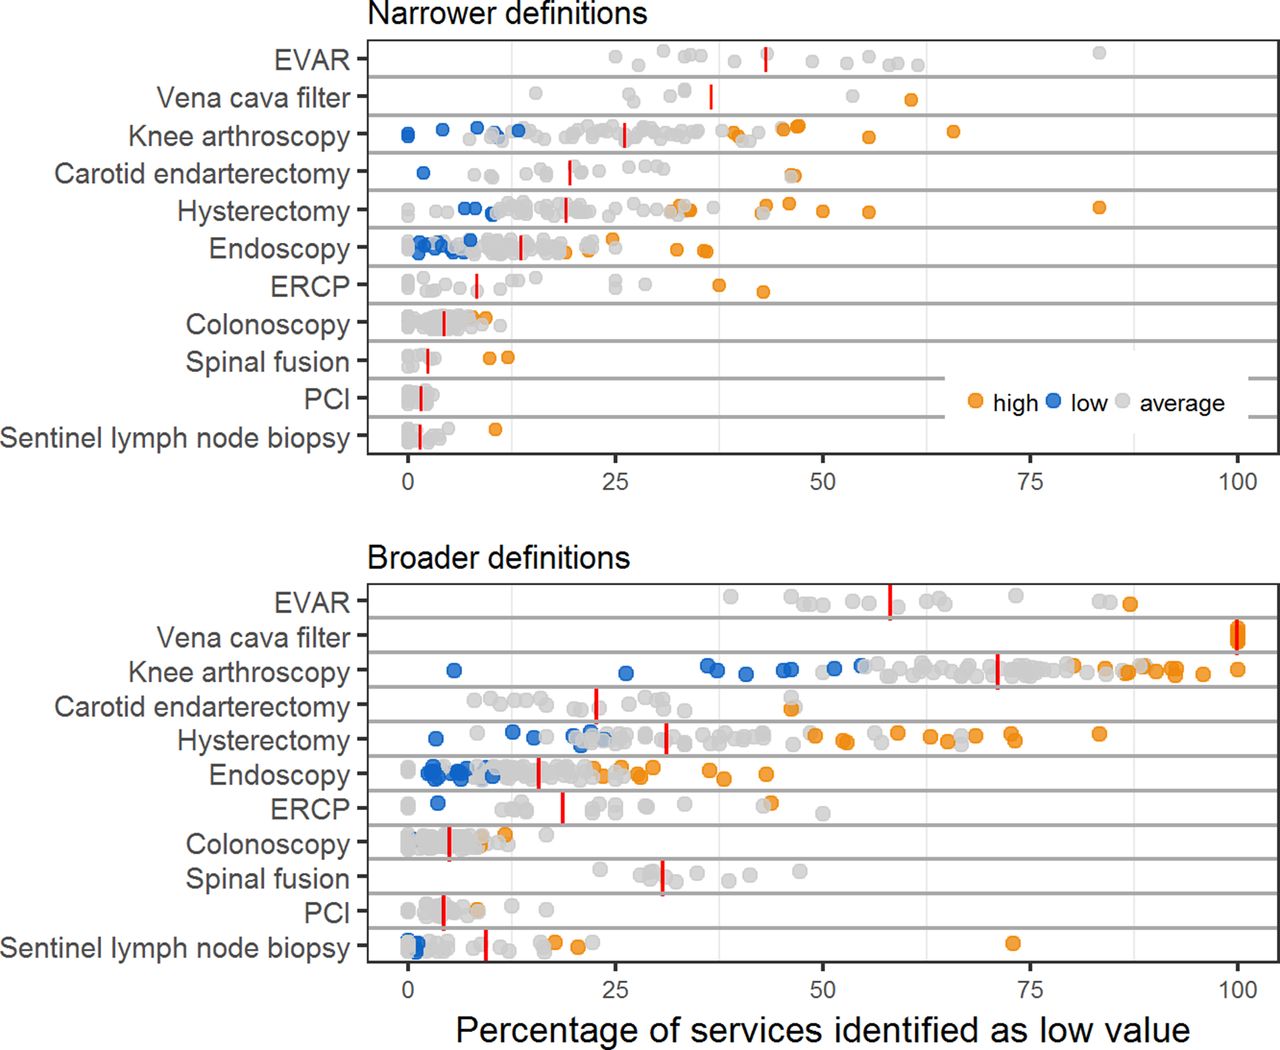
Figure 2 illustrates the variation between hospitals for 12 procedures that had more than five episodes involving the procedure at more than five hospitals in 2016–2017. Almost all of these procedures had hospitals with low-value rates higher than the upper 99% control limit. Many procedures also had hospitals with rates below the lower 99% control limit. Abdominal hysterectomy and knee arthroscopy were associated with the greatest variation in rates between hospitals.

Variation in use of selected low-value procedures in New South Wales (NSW) hospitals. Each point represents one hospital performing the relevant procedure. The red bars indicate the state average proportion, and grey points are consistent with the state average. Orange points are above and blue points below 99% control limits around the state rate. For definitions of low-value care, see online supplementary table 1. ERCP, endoscopic retrograde cholangiopancreatography; EVAR, endovascular repair of abdominal aortic aneurysm; PCI, percutaneous coronary intervention.
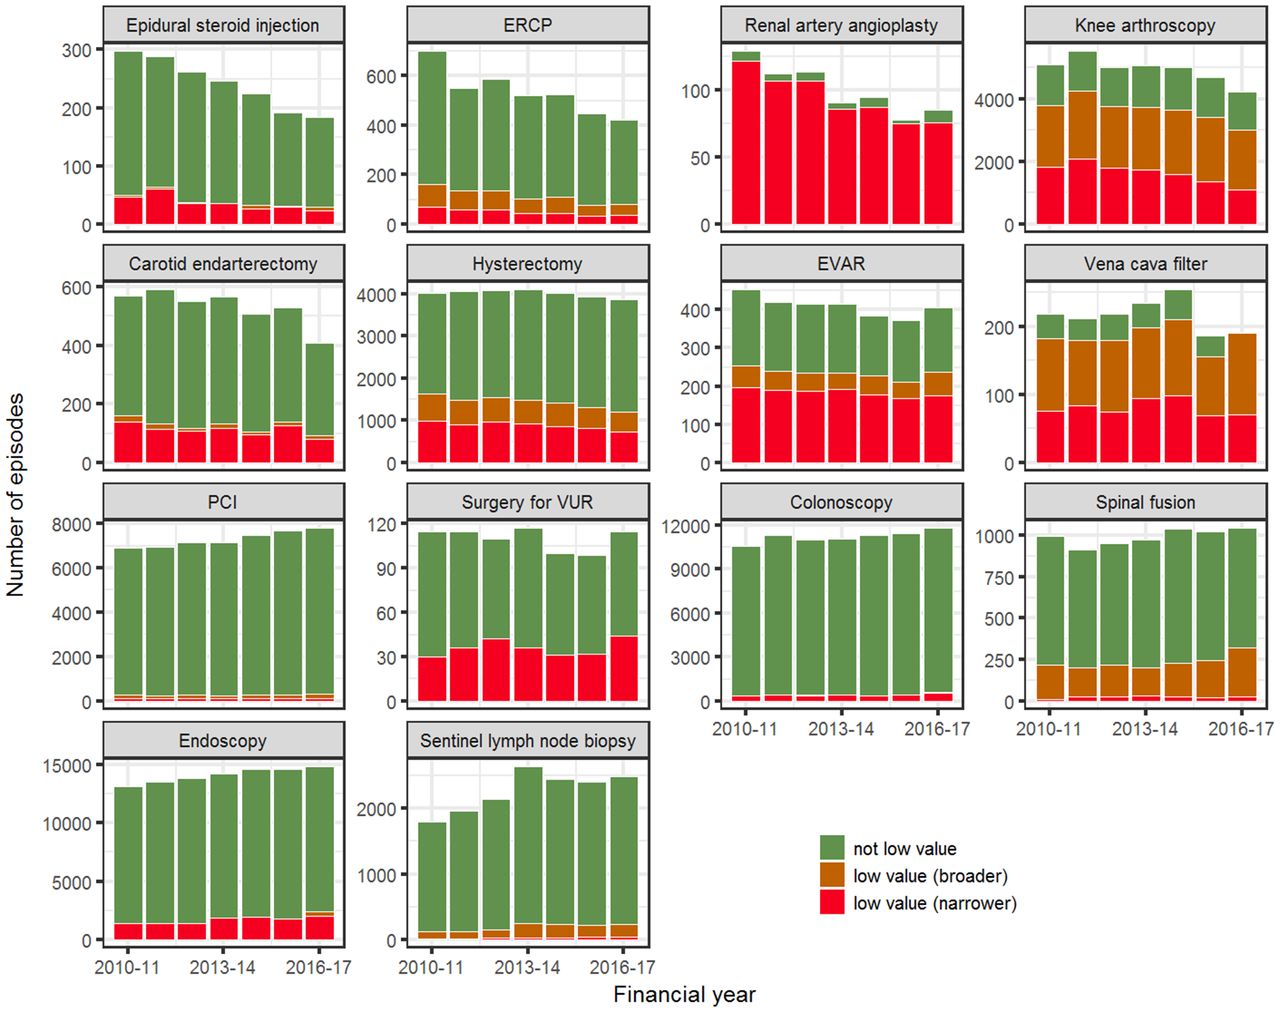
Seven of the 14 procedures accounting for 99% of low-value episodes showed a decreasing trend in numbers of low-value episodes, while three showed an increasing trend (figures 1 and 3). Compared with 2010–2011, there were 40% (narrower) to 21% (broader) fewer low-value knee arthroscopies in 2016–2017 and 17% fewer total knee arthroscopies. Almost all renal artery angioplasties were identified as low value, and use decreased by 34% (44 episodes) over the 7 years. In contrast, low-value endoscopies in people <55 years were 44% (narrower) to 67% (broader) higher in 2016–2017 while total endoscopies in this age group were 13% higher than in 2010–2011.
Estimates of low-value care from financial year 2010–2011 to 2016–2017 for 14 procedures with most episodes involving low-value care (narrower definition) in 2016–2017. For definitions of low-value care, see online supplementary table 1. ERCP, endoscopic retrograde cholangiopancreatography; EVAR, endovascular repair of abdominal aortic aneurysm; PCI, percutaneous coronary intervention; VUR, vesicoureteric reflux.
Discussion
Following the approach Schwartz et al 10 used to measure 26 investigations and procedures in the US Medicare population,10 we developed indicators of low-value care for 27 procedures in NSW public hospitals. Half of these procedures were associated with negligible low-value care in this setting. Of the remaining 14 procedures, seven showed a decreasing trend, and only three an increasing trend, in low-value care. Berwick and Hackbarth18 famously estimated (in a US context) that 30% of healthcare is ‘waste’.18 This included categories such as fraud, administrative waste, pricing failures and low-value care. Our study of only 27 procedures offers a glimpse of the low-value care contribution to the ‘waste’ figure in Australia. It is encouraging that 13 of the public hospital inpatient procedures we could measure show negligible levels of low-value care in NSW. Also, procedures such as knee arthroscopy that are widely recognised as being low value are already decreasing in this setting. Nevertheless, low-value care is clearly prevalent in this setting, consuming considerable resources in dollar terms as well as bed-days.
Several denominators are possible in presenting low-value care measures.16 We used a service denominator, primarily because our interest was in the health system perspective, but also because our data were limited to the public hospital setting. Most similar studies have used patient-population or patient-indication denominators, and cannot be directly compared with our results.16 For example, while we found about 20% of carotid endarterectomies in NSW public hospitals were low value, Schwartz et al reported that 0.1 per 100 US Medicare beneficiaries received a low-value carotid endarterectomy.10 With 1.2 million NSW residents aged 65 years and over, our 80–93 low-value carotid endarterectomies in public hospitals would be much less than 0.1 per 100 populations over 65, but we do not know how many low-value endarterectomies occur in private hospitals.
Based on numbers and trends, the 27 procedures fall into three groups that may require different responses (figure 1). For the 13 procedures with very low numbers of low-value episodes and the seven that are decreasing, background surveillance is appropriate to detect and respond to ‘outbreaks’. On the other hand, the three procedures with high numbers of potentially low-value episodes and increasing trends are a priority for further investigation to understand the drivers and determine what can and should be done to reduce low-value use of these procedures. The remaining four procedures with no clear trend should also be investigated further. The lack of state-wide trend may result from different regional trends, with the potential to learn from regions with decreasing trends to gain rapid turnaround in regions with increasing trends.
Further investigation of these procedures will initially involve more detailed analyses of the hospital admissions data to identify factors associated with high or low counts and rates of low-value care, or factors associated with differing trends between regions or hospitals. The wide variation between hospitals indicates the potential to reduce low-value care. Even if some low-value care is inevitable because of clinical uncertainty, arguably hospitals with high rates should be able to reduce their low-value episodes at least to the state average. We intend to investigate factors explaining the variation in future work. Studies in other countries have identified associations between patient characteristics and low-value care,19 20 and associations with the number of specialists in an area,20 and we will go on to explore these possibilities in our setting. As patients can elect to be treated privately in NSW public hospitals, another interesting question is whether low-value care differs between public and private patients in these hospitals. In the USA, payer type and insurance status do not seem to affect rates of low-value care.21 22
Most procedures in this study have value for many patients. For example, colonoscopy is a high-value investigative and interventional procedure in bowel cancer and other gastrointestinal conditions. However, in younger patients with no indication other than constipation, colonoscopy has a lower diagnostic yield than in general population screening.23 Our indicators aim to specifically identify patients for whom the procedures are low value—a ‘direct’ measure. This is important, as indirect measurements based on overall rates of procedures carry the risk that providers might reduce all use of services—high-value and low-value—rather than just low-value use. To avoid this possibility, we only developed indicators for recommendations where we and clinicians we consulted believed low-value care could be identified with reasonable specificity.15
In defining when a procedure is low value, we relied on recommendations from Choosing Wisely and similar sources. Choosing Wisely lists have been criticised for having too many low-impact items,24 and for unclear processes and variable criteria for incorporating evidence into item development.25 While the low-value status of many Choosing Wisely services is generally supported by sound evidence, including clinical practice guidelines, systematic reviews or randomised controlled trials, this is not universal.26 We did not critique the evidence base for each of the Choosing Wisely recommendations that we measure, but rather have taken them at face value on the basis of having been developed by reputable professional bodies. Recommendations we took from other sources were based on systematic reviews or randomised controlled trials.
Like all direct low-value care measurement studies, our estimates are limited by the data available, which do not include the detailed clinical information often required to make treatment decisions.27 Because of uncertainty in whether individual procedures are truly inappropriate, we have reported estimates based on narrower and broader criteria, following the approach taken in the USA.10 The differences between the narrower and broader results can be seen to reflect any differences between the true low-value care rate and our estimates, and illustrate the implications of such differences for the health system response to low-value care.10
Our indicators are specific to the recommendations they are based on, and do not consider other possible inappropriate use of the procedures. For example, Choosing Wisely Canada also recommends against repair of abdominal aortic aneurysms that are <5.5 cm for men or <5 cm for women. We do not have access to aneurysm size so our indicator for endovascular repair would consider repair of a small aneurysm as not low value unless the patient met our criteria of high risk; thus it is a conservative measure.
Our cost and bed-day estimates simply sum the values for the low-value episodes. For some procedures, appropriate care would still involve hospital admission, so the cost and bed-day values overestimate the potential resources that could be redirected towards better value care.
The data also governed which recommendations we could measure. The 27 procedures are those we could measure, not necessarily the most important for health system efficiency or patient outcomes, and clinicians in Australia may not have recognised these services as requiring action, as most of them were selected from international lists. In addition, we used public hospital inpatient data only, so could not capture low-value care occurring in other settings, such as the emergency department, general practice or private hospitals. We also could not measure low-value prescribing or test ordering, although the large number of recommendations relating to prescribing and test ordering suggests clinical groups find these areas of great concern.28 A full understanding of the societal impact of low-value care requires estimates across the entire health sector, as well as measurement of the downstream consequences of low-value care, such as adverse events, side effects, hospitalisations, procedures and associated costs that might result from the index event. However, as a starting point we contend that effective action is more likely in response to estimates related to a clearly defined setting under the responsibility of a single payer, as provided here.
Any action based on these results needs to be carefully considered, to avoid undermining the clinician goodwill associated with Choosing Wisely.29 The stated aim of Choosing Wisely is to increase conversation among clinicians and patients about what care confers tangible benefit. Feedback of these results to hospitals and clinicians, perhaps in partnership with Choosing Wisely, can add to this conversation, providing information about what low-value services are increasing or decreasing, or why hospitals vary in their levels of low-value care. Provider feedback has been found effective in some, but not all, evaluations.30 Simple interventions with minimal impact on clinician autonomy, such as requiring that a physician request permission for a procedure, can also work to reduce low-value procedures.31
Although we classified half of our procedures as having negligible low-value care, this should not be taken as suggesting low-value care is not a problem in NSW public hospitals. Most procedures we measured are invasive and expensive, with clear surgical risks to patients. In the USA, low-cost high-volume services make the greatest contribution to low-value care.32 In NSW, we should acknowledge these results and look elsewhere to new data sources for examining less invasive, potentially low-value care, but with much higher rates of utilisation, such as unnecessary diagnostic testing or imaging.
Reducing low-value care has the potential to improve outcomes for patients while reducing costs. Our results provide a baseline for understanding the extent of the phenomenon, and for monitoring the effects of programmes aimed at highlighting and reducing low-value care, such as Choosing Wisely Australia3 or the EVOLVE initiative of the RACP.4 As is occurring internationally, indicators such as those developed here will continue to be refined with input from clinical and research communities, and new indicators will be added as campaigns such as Choosing Wisely further articulate what constitutes low-value care in specific instances. Measurement is a crucial precondition to support clinical and policy communities to explore the drivers and potential remedies for low-value care.
Acknowledgments
We thank the 27 participants in a clinical workshop who reviewed the methods and specific indicators, and a clinical coder from the NSW Ministry of Health for reviewing the codes used for defining low-value care.
References
Footnotes
Contributors TBP and KC jointly developed the indicators. TBP performed the analysis and drafted the article. JB and IS provided clinical input for indicator development. SD and NO facilitated access to the data, supervised the project and assisted in drafting the article. SAP and AE provided overall supervision and direction to the project and assisted in drafting the article. All authors read and approved the final article.
Funding This study is funded by the National Health and Medical Research Council (grant number 1109626), Capital Markets CRC, University of Sydney, NSW Ministry of Health, and HCF Research Foundation.
Competing interests TBP receives consulting fees and scholarship support from the Capital Markets Cooperative Research Centre and a University Postgraduate Award from the University of Sydney. KC receives personal fees from the Capital Markets Cooperative Research Centre and the Australian Federal Government via a Research Training Program Award and The University of Sydney. Prof Elshaug is a Board Member of the New South Wales Bureau of Health Information, receives salary support as the HCF Research Foundation Professorial Fellow, receives consulting/sitting fees from Cancer Australia, NPS MedicineWise (facilitator of Choosing Wisely Australia), the Australian Commission on Safety and Quality in Health Care (Atlas of Health Care Variation Advisory Group), the Queensland and Victoria Government Departments of Health, Private Healthcare Australia and the Australian Government Department of Health as an appointee to the MBS Review Taskforce. SAP, IAS, JB, SD, NO have no relevant disclosures.
Patient consent Not required.
Ethics approval The NSW Population and Health Services Research Ethics Committee approved this study (2015/09/607).
Provenance and peer review Not commissioned; externally peer reviewed.
Data sharing statement This study used New South Wales hospital admitted patient data, and restrictions apply under the Health Records and Information Privacy Act 2002 (NSW). The authors can assist in accessing data upon reasonable request and with permission of the data custodian and approval from the NSW Population and Health Services Research Ethics Committee.