Article Text

Abstract
Socrates described a group of people chained up inside a cave, who mistook shadows of objects on a wall for reality. This allegory comes to mind when considering ‘routinely collected data’—the massive data sets, generated as part of the routine operation of the modern healthcare service. There is keen interest in routine data and the seemingly comprehensive view of healthcare they offer, and we outline a number of examples in which they were used successfully, including the Birmingham OwnHealth study, in which routine data were used with matched control groups to assess the effect of telephone health coaching on hospital utilisation.
Routine data differ from data collected primarily for the purposes of research, and this means that analysts cannot assume that they provide the full or accurate clinical picture, let alone a full description of the health of the population. We show that major methodological challenges in using routine data arise from the difficulty of understanding the gap between patient and their ‘data shadow’. Strategies to overcome this challenge include more extensive data linkage, developing analytical methods and collecting more data on a routine basis, including from the patient while away from the clinic. In addition, creating a learning health system will require greater alignment between the analysis and the decisions that will be taken; between analysts and people interested in quality improvement; and between the analysis undertaken and public attitudes regarding appropriate use of data.
- Quality improvement
- Healthcare quality improvement
- Statistical process control
This is an Open Access article distributed in accordance with the Creative Commons Attribution Non Commercial (CC BY-NC 4.0) license, which permits others to distribute, remix, adapt, build upon this work non-commercially, and license their derivative works on different terms, provided the original work is properly cited and the use is non-commercial. See: http://creativecommons.org/licenses/by-nc/4.0/
Statistics from Altmetric.com
In the famous cave allegory from Plato's Republic, Socrates described a group of people chained up inside a cave, with their heads secured in a fixed position to view the wall in front of them.1 A fire was burning, and various people passed between this fire and the captives. These people carried objects, creating shadows on the wall that the captives mistook for the objects themselves. This is an apt allegory to keep in mind when considering ‘routinely collected data’—the varied, and massive, person-level data sets that are generated as part of the routine operation of modern healthcare services.
Huge enthusiasm exists for routine data, which offer a seemingly panoramic view of healthcare.2 ,3 The hope is that these data can identify ways to improve the quality and safety of healthcare, and thus lead to a learning healthcare system.4 ,5 Yet, routine data provide only vague shadows of the people and activities they represent. Routine data are generated for the purposes of delivering healthcare rather than for research, and this influences what data are collected and when. Thus, analysts of routine data cannot assume that they provide the full or accurate clinical picture, let alone a full description of the health of the population.
Our research group uses routine data to improve decision making in health and social care. Many successful studies show that data shadows can be interpreted intelligently to improve care. However, the partial picture afforded by routine data means that there are considerable challenges to achieving a learning healthcare system,6 and these may explain why ‘big data’ seems to have attracted as much scepticism as enthusiasm.7–9 In this article, we discuss the need to improve the information infrastructure of healthcare systems and to understand better the factors that influenced what data were collected. Matching the rapid growth in the availability of large data sets with knowledge about how they were generated will require supplementing big data with ‘small data’, for example from clinicians, patients and qualitative researchers. Creating a learning healthcare system will also require greater alignment between analysts and people interested in quality improvement, to ensure that data analytics provides supportive decision making while being sufficiently embedded within the healthcare system and maintaining public trust in the use of data.
Types and usage of routine data
It will be immediately apparent to anyone who seeks to use routine data that most healthcare systems do not contain a single comprehensive data set, but a patchwork quilt.10 From our experience of the English National Health Service, we have found that the data that are most often used tend to be those that were generated by administrators or clinicians. However, patient-generated and machine-generated data are also important and the technologies that produce them are growing in availability (table 1).
Types of routine data in healthcare
Routine data can be contrasted with data that are collected primarily for the purposes of research, for example for a randomised controlled trial.31 Data that are collected for a research project can be tailored to the specific populations, timescales, sampling frame and outcomes of interest. In contrast, analysis of routine data constitutes secondary use, since the data were originally collected for the purposes of delivering healthcare and not for the analytical purposes to which they are subsequently put. In our discussion of routine data, we exclude data collected as part of surveys (eg, the Health Survey for England32), and some clinical audits,33 even if these are frequently conducted. The specific difference is that these have a prespecified sampling frame, whereas individuals are included in routine data by virtue of their use of specific services.
Routine data have been used successfully in comparative effectiveness studies, which attempt to estimate the relative impact of alternative treatments on outcomes.34 For example, one recent study examined the impact of telephone health coaching in Birmingham, a large city in England. In this example, patients with chronic health conditions were paired with a care manager and worked through a series of modules to improve self-management of their conditions.35 Although the intervention operated in community settings, the study was able to link various administrative data sets together to track the hospitalisation outcomes of 2698 participants over time. Because many of the patients had been hospitalised previously and this group may show regression to the mean, a control group was selected from similar parts of England using a matching algorithm that ensured that controls and health coached patients were similar with respect to observed baseline variables, including age, prior rates of hospital utilisation and health conditions. This study found that the telephone health coaching did not result in reductions in hospital admissions, a finding that was robust to reasonable assumptions about potential impact of unobserved differences between the groups.35 Another study of the same intervention, which used similar methods, uncovered improvements in glycaemic control among a subset of patients whose diabetes had previously been poorly controlled.36
The Birmingham study shows that routine data have some technical benefits (such as wider coverage, longitudinal nature and relatively low levels of self-report bias for some end points).37 However, one of the major advantages of these data is simply that they are available on a routine basis. This means that, for example, matched control analyses could be repeated on a regular basis to understand how the effectiveness of services change over time. This is not the only tool based on routine data that clinicians and managers can use to measure and improve the quality and safety of healthcare in a learning healthcare system.6 ,38 Other examples include:
Predictive risk modelling, which uses patterns in routine data to identify cohorts of patients at high risk of future adverse events;39 ,40
Analysis of the quality of healthcare, such as the identification of cases where there was opportunity to improve care;41 and
Surveillance of disease or adverse events, such as to detect outbreaks of infectious disease.17
In theory, all the types of routine data shown in table 1 can be used in any of these applications but a recurrent concern is whether the data are sufficient to address the questions of interest. In the next sections, we discuss some of the general limitations of routine data, first in terms of the scope of what is included, and then in terms of how the data are assembled.
The scope of routine data: introducing the data shadow
Figures 1⇓–3 illustrate some general features of healthcare systems that influence how these data are commonly collected. We focus of administrative and clinically generated data, as these have been most commonly used to date.
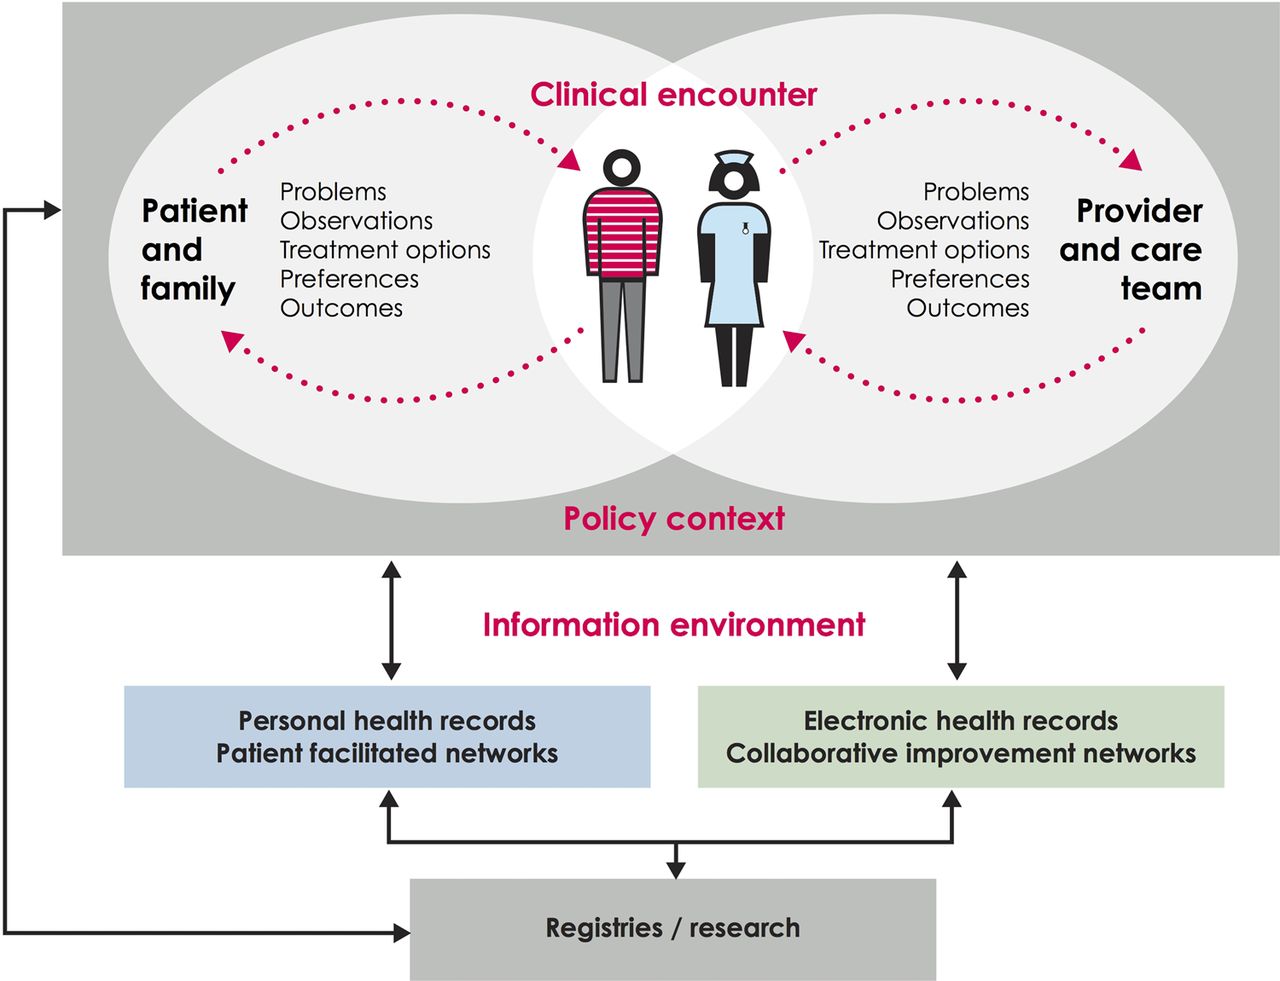
The first boundary of routinely collected data. This illustrates the relationship and distance between data recorded by the patient or family and data recorded by clinician and administrative health records. Cross referencing with table 1, administrative and clinically-generated data generally lie on the right hand side of this figure, while the two types of patient-generated data lie on the left hand side. Based on work by the Dartmouth Institute and Karolinska Institutet.

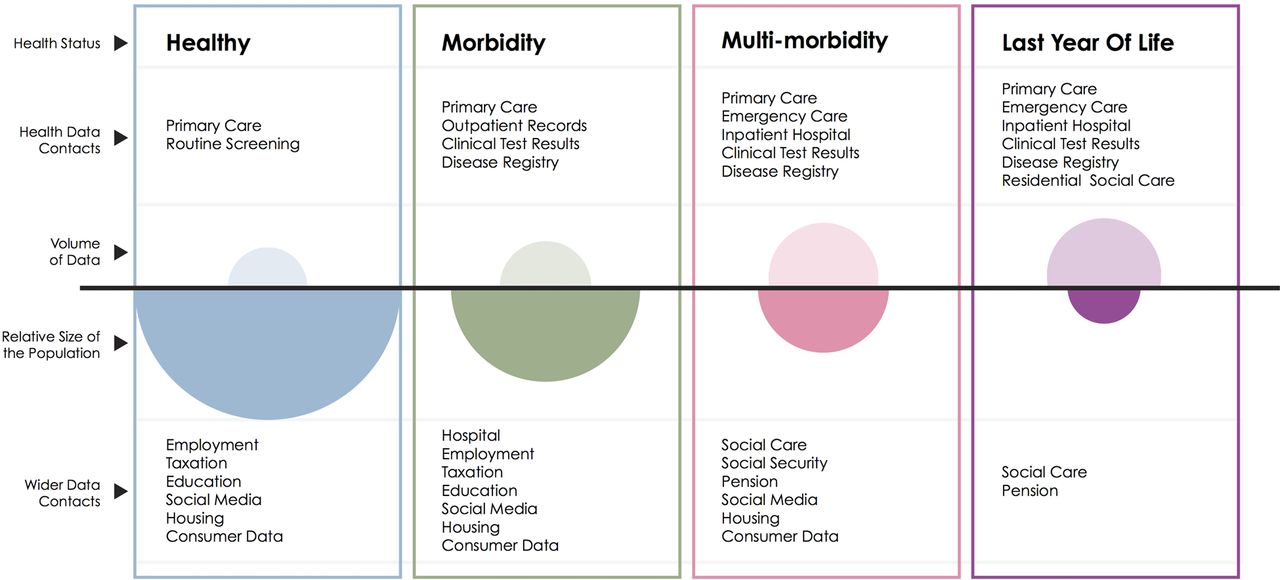
The second boundary of routinely collected data. This schematic illustrates the volume of data available (open ovals) from health datasets for each group of the population defined by health status in contrast with the size of that population (filled ovals).
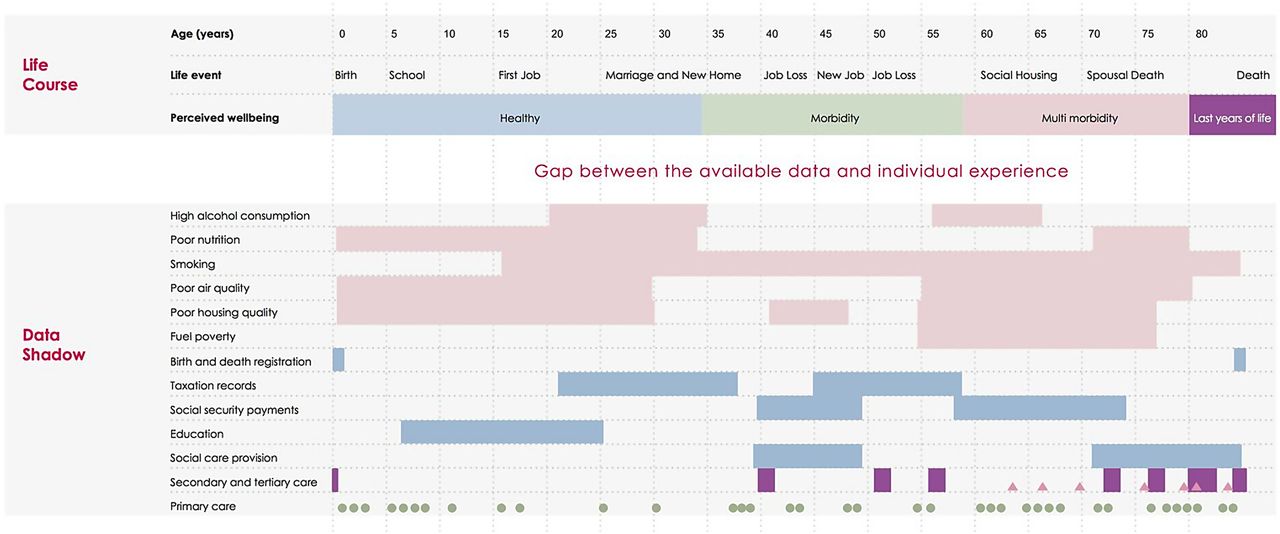
Comparison between the individual experience and the data shadow: We map the life course of a hypothetical individual, showing age in 5-year increments, important personal events and their personal perception of health. In the first six rows of the ‘Data Shadow’ section we indicate behavioural and environmental factors that may be damaging to health, with periods of time of exposure illustrated with solid rectangles. In the following five sections we indicate governmental data sources that contain further information relevant to the health of the individual, with periods of data collection indicated by rectangles. The final three categories give a timeline of patient contact with care services (shown as a theograph47); this uses triangles, circles and lines to indicate different types of health care (primary, secondary and tertiary care) or social care provision. Small circles indicate a GP visit, rectangles a period in secondary, tertiary or social care and triangles an attendance at an emergency department.
Figure 1 begins by taking the viewpoint of a typical healthcare system, and shows the information that might theoretically be exchanged as part of its day-to-day operation. At the centre of the diagram is the clinical encounter, during which symptoms, observations, treatment options, preferences and outcomes may be relevant. Outside of this encounter, there is generally one ongoing dialogue between patients and their support network (the left hand side of the diagram), and another between the clinician and the wider care team (right hand side). A range of factors, including clinical practice, influence what information is shared and recorded.42
Analysts of routine data face particular problems because, in most healthcare systems, the information infrastructure is better developed on the right hand side of figure 1 than on the left hand side. Thus, information systems gather data from the clinician during the encounter (eg, their observations from the patient) and from the wider care team (eg, results of diagnostic tests) but, for most patients, there is no systematic way of communicating what happens outside of the clinical encounter, including symptoms, response to treatment, and the priorities of patients and their families,43 despite the potential value of this information for both health and healthcare.42 ,44 As a result, analyses of routine data often focus on clinical or process outcomes, and there is a risk that the perspective of patients might be forgotten or undervalued. However, there are examples of healthcare systems that combine patient-generated data with administrative and clinically generated data into research databases or registries.18
Another feature of healthcare systems is that they are more likely to interact with people who have concerns about their health than those who do not. Moreover, the lens of data collection is typically focused on the patient, rather than on other groups who might be instrumental to improving health outcomes, such as informal carers.45 This feature leads to another limitation to the scope of routine data: from a population perspective, some groups are described in much more detail than others (figure 2). For example, in England young men visit a GP (General Practice, denotes primary care practice in the UK) much less often than women and older men,46 meaning that less information is available on this group.
These two features mean that the picture shown by routine data can differ markedly from the actual experience of an individual.
Figure 3 (bottom half) shows the information that is typically obtainable from routine data for a hypothetical individual, and would be traditionally included in a theogram.47 Underlying each of the contacts shown, information might be available about the person's recorded diagnoses, test results and treatments. This is what we call the data shadow48 of the person, because it is an imperfect representation of the person's lived experience (top half of figure 3). The data shadow can omit many aspects of a life that the person considers significant, including some that may influence health outcomes, such as: whether the person lives alone; their drug, tobacco and alcohol intake; the breakdown of a relationship; financial hardship; employment status; violence; and other stressors over the life course.49 These observations are not merely theoretical and can pose specific challenges to the analysis. For example, it can be difficult to assess long-term outcomes following surgery because, as people recover, they interact with the system less often and so less information is recorded.
Figure 3 shows that data linkage may address some of the limitations of routine data.47 While valuable information might be missing from healthcare data, in some cases this might be obtained from other governmental, social and commercial data sets.50 For example, approximately five million (as reported May 2014 51) working-age people claimed some kind of social security benefit in Great Britain, and thus records are theoretically available on their socioeconomic situation, housing and previous taxable earnings.51 Innovative examples of data linkage include combining mobile phone usage with police records to show the impact of phone calls on collisions while driving,52 and linking social care with hospital data to predict future usage of social care.40 Although data linkage may shed light on some of the social determinants of health, including employment status, housing, education, socioeconomic deprivation and social capital,53 not all life events will be recorded. Thus, regardless of their sophistication, routine data will only ever represent shadows of individuals’ lives.
Understanding the data GENERATING process
In our opinion, many of the major methodological challenges in using routine data have at their root the difficulty of understanding the data generating process. We define this broadly to consist of the relationships between the factors that influenced why some data were recorded and not others.54 This relates to the choice of diagnoses codes used, and to the factors that influenced whether a person was seen by the healthcare system and which treatments were received. We now give two examples of how a lack of clarity about the data generating process can result in biased analysis,54 before describing in the following section how this can be overcome.
The telephone health coaching studies have already illustrated the risk of selection bias that can occur if, for example, the patients enrolled into a programme have poorer glycaemic control than those who are not,36 when glycaemic control is also associated with outcomes.55 Thus, a straightforward comparison of the outcomes of people receiving health coaching versus not receiving it will yield a biased estimate of the treatment effect. Although matching methods can adjust for observed differences in the characteristics of people receiving health coaching and usual care, the important characteristics must be identified, so successful application of these methods requires an understanding of why some patients received the intervention and others did not.54
The second example relates to postoperative venous thromboembolism (VTE), a potentially preventable cause of postoperative morbidity and mortality. VTE rate is often used in pay-for-performance programmes,56 but some clinicians have a lower threshold in ordering tests for VTE than others, while some hospitals routinely screen asymptomatic patients for VTE. Therefore, if one hospital has a higher rate of VTE than another, this does not necessarily mean that they offer less safe care, as they might just be more vigilant.56 Unless the analyst understands this feature of the data, a particular type of bias will result, called surveillance bias.57 ,58
Information about the data generating process is arguably less important in other applications. For example, when developing a predictive risk model, the primary aim might be to make accurate predictions of future risk, and the data generating process might be considered less important as long as the predictions are valid.59 However, in general, robust analysis of routine data depends on a good understanding of how the data were put together. This has implications for both research methods and the future development of the information infrastructure in healthcare systems, as we now discuss.
Making sense of the shadows
Many of the efforts to address the limitations of routine data have focused on developing and applying more sophisticated analytical methods. These don't attempt to improve or enhance the data but, seek to make inferences with lower levels of bias compared with other methods. For example, a variety of analytical methods exist for dealing with selection bias60–64 and surveillance bias.58 ,65 For example, a recent study58 proposed a proxy for ‘observation intensity’ when dealing with surveillance bias, namely the number of physician visits in the last 6 months of life. It offset the effect of variation in this proxy from the variation in the recorded outcomes. Likewise, many methods have been developed to deal with selection bias, including machine-learning methods such as genetic matching,66 and classification and regression trees.67 Multiple imputation is now an established technique for analysing data sets where there are incomplete observations,68 while Bayesian inference,69 hidden Markov models70 and partially observed Markov process71 have been used to overcome deficiencies in data collection when fitting epidemiological models to routine data. Many other examples exist.
While these developments are helpful, any analytical method will be biased if the underlying assumptions are not met, so it is still important to address deficiencies in the underlying data.54 Relatively few studies have examined the relative strengths of the different types of data listed in table 1 in terms of dealing with common sources of bias.39 ,43 As we have already seen, it may be possible to obtain additional information through data linkage, and thus reduce the gap between a person and their data shadow.15 ,72–75 However, data linkage increases the volume of data available, and so may compound rather than alleviate problems associated with understanding the data.
Although data linkage and advanced analytical techniques are valuable, it seems that, in parallel with these efforts, the information infrastructure of many healthcare systems could also be improved to capture more data relevant to current and future health outcomes (figure 1) and to identify more populations of interest (figure 2). Many outcome measures are available to choose from, but key questions are about how these should be used within the care pathway, where and when they should be collected, and how to put in place a system to collect them.44 There is also a need to balance the benefits of standardising data collection with the heterogeneity in patient and provider preference about what is recorded and when.76 Although some patients might prefer to submit data electronically, others might prefer to use more traditional methods. This was illustrated in a recent telehealth trial, in which patients were given home-based technology to relay medical information to clinicians over Bluetooth, but some still took their blood sugar information to the GP on paper.76 Showing the need to work with both clinicians and patients to develop a method of data collection that serves their needs as well as providing a source of useful data for analysis.
Until we have data that more directly measure what is important, the debate will continue about how to interpret the available metrics.77 ,78 For example, many interventions in primary and community care aim to prevent hospital admissions.2 There are some good reasons to reduce hospital admissions, including: their cost; the geographical variation in admission rates, suggesting that reductions are possible; and findings that a significant proportion of admissions are preventable through improvements in primary and community care.79 ,80 What is less clear is the relationship between hospital admissions and patient preferences for how care is delivered.81
In parallel with efforts to improve the information infrastructure, we must match the growth in the use of routine data with growth in understanding about how these data were generated.82 This is a considerable challenge, particularly as the nature of the data collected is changing over time. For example, the Quality Outcomes Framework linked payments for primary care to indices derived from the electronic medical record,83 and in doing so both standardised codes and altered clinical practice in the UK.84 The nature of the data recorded may also change as healthcare organisations attempt to become more person-centred, for example, as more patients are given access to their visit notes.85 ,86
Ideally, routine data collection would be extended to include variables that describe the data generating process. In some instances this may be feasible, for example by recording which diagnostic test was used alongside test results.87 However, it is not always realistic, and instead ‘big’ data can more useful if used to create ‘wide data’88 where ‘big data’ is supplemented with qualitative and ‘small’ quantitative datasets, providing information on the social and technical processes underlying data collection and processing.7 Examples within healthcare include audits of clinical practice to identify heterogeneity or changes in testing procedures, such as might occur in screening for healthcare associated infections.87 ,89 Also valuable is qualitative work into patient and provider decision making,76 or patient and clinical involvement in the design and interpretation of analysis.90
Diffusing data analytics
Even if the distance between a person and their data shadow is reduced or at least better understood, this will by no means create a learning health system. Routine data can be used to develop tools to improve the quality and safety of healthcare, but these need to be taken up and used to deliver the anticipated benefits.91 In our opinion, this requires closer alignment between:
The questions addressed by the analysis and the decisions that will be taken;
Analysts and people interested in quality improvement; and
The range of analysis undertaken and public attitudes regarding the use of data.
Supporting decision-making
In the midst of the current hype around big data analytics, it can be easy to forget that the analytical products need to be developed so that they better meet the needs of their end users (eg, managers, clinicians, patients and policy makers) and, moreover, that it is important for analysts to demonstrate value. The timeliness of the analysis is important, but there are more subtle questions about whether the analytics is targeted at the decisions that clinicians and managers must make.92 For example, although predictive risk models identify cohorts of patients at increased risk of adverse events,39 by itself this does not provide information about which patients are most suitable for a given intervention.93
Another example is that comparative effectiveness studies often report the probability that the sample treatment effect could have occurred by chance (the p value), but this quantity might have limited applicability within the context of a particular quality improvement project.94 When developing complex interventions,95 the decision is not between offering the intervention or not, but many other options including spreading the intervention, modifying the eligibility criteria, improving fidelity to the original intervention design or refining the theory of change.96 ,97 Recent developments in analytical methods aim to assess the relative costs and benefits of alternative decisions, and relate these to the mechanism of action of the underlying interventions for the target population.98 ,99
Embedded analytical teams99a
Statisticians and data scientists in academia have an essential role to play in developing new methods for health informatics, data linkage and modelling. Unfortunately, these groups have a limited ability to provide routine support and evaluation within healthcare systems, with some notable exceptions.100 ,101 Data analysts working closely with clinicians at a local level have the advantage of local knowledge, which may make it easier to understand the care pathway and data generating process. Some healthcare providers appear to have successfully embedded data analytics, including the US Veterans Health Administration,102 Intermountain103 and University Hospitals Birmingham NHS (National Health Service) Foundation Trust.104 However, in other health systems it is more challenging to assess the number, job descriptions and skills of data analysts,105 and so plan for future workforce needs.
Ultimately, data analytics will not reach its full potential unless its importance is recognised by healthcare leaders. Unfortunately, in some instances there is uncertainty about how best to establish thriving analytical teams within healthcare organisations. Ideally, skilled analysts would be able to adapt to local needs and bring their expertise in the design, analysis and interpretation of data with an incentive to produce work that is clinically relevant and benefits patients and the public.102
Attitudes towards using data
Public trust in healthcare providers and research must not be undermined by real or perceived abuses of data.3 ,106 Given data protection legislation that is generally formulated in terms of consent, system of collecting explicit patient consent for the secondary use of data would give the greatest certainty to both patients and the users of data, and has been signposted as an aim in England.3 However, the primary focus when individuals interact with the health system is delivering healthcare, often with several points of access for patients, and so consent is not always sought for the secondary use of data that are generated as part of this interaction.
In the absence of consent, legal frameworks are necessary that strike the right balance between privacy and the public good,3 ,107 and policy development in this area must be informed by an understanding of complex public attitudes about the use of data,108 ,109 which requires an ongoing dialogue about the uses to which the data are put. Although most discussions about routine data are formulated in terms of identifying the subset of people who would prefer that data about them were not used in analysis, it is also worth bearing in mind that the ‘data donation’ movement shows that many people are prepared to contribute a wide range of data to improve healthcare for other people, as well as to further medical and scientific understanding.110 ,111
Conclusions
Ongoing feedback of insights from data to patients, clinicians, managers and policymakers can be a powerful motivator for change as well as provide an evidence base for action. Many studies and systems have demonstrated that routine data can be a powerful tool when used appropriately to improve the quality of care. A learning healthcare system may address the challenges faced by our health systems,2 but for routinely collected data to be used optimally within such a system, simultaneous development is needed in several areas, including analytical methods, data linkage, information infrastructures and ways to understand how the data were generated.
Those familiar with the final part of Plato's allegory will know that one captive escaped his chains and gained full knowledge of his world. In that instance, the experience was not a happy one—on returning to his peers, they were not receptive to his offers to free them from their chains.1 While there is huge enthusiasm for routine data, diffusing data analytics throughout a healthcare system requires more and more sophisticated ways of analysing the shadows on the wall, and ongoing communication between different groups of people with very different perspectives. Only in this way will we achieve closer alignment between data analytics and the needs of decision makers and the public.
Acknowledgments
This article was based on a presentation to the Improvement Science Development Group (ISDG) at the Health Foundation. The authors are grateful to the members of ISDG and many other colleagues who have provided them with thoughtful comments and advice, including Jennifer Dixon, Therese Lloyd, Adam Roberts and Arne Wolters. Figures were redrawn by designer Michael Howes from versions produced by SRD and AS.
References
- 1.↵
- 2.↵
- 3.↵
- 4.↵
- 5.↵
- 6.↵
- 7.↵
- 8.↵
- 9.↵
- 10.↵
- 11.
- 12.
- 13.
- 14.
- 15.↵
- 16.
- 17.↵
- 18.↵
- 19.
- 20.
- 21.
- 22.
- 23.
- 24.
- 25.
- 26.
- 27.
- 28.
- 29.
- 30.
- 31.↵
- 32.↵
- 33.↵
- 34.↵
- 35.↵
- 36.↵
- 37.↵
- 38.↵
- 39.↵
- 40.↵
- 41.↵
- 42.↵
- 43.↵
- 44.↵
- 45.↵
- 46.↵
- 47.↵
- 48.↵
- 49.↵
- 50.↵
- 51.↵
- 52.↵
- 53.↵
- 54.↵
- 55.↵
- 56.↵
- 57.↵
- 58.↵
- 59.↵
- 60.↵
- 61.↵
- 62.↵
- 63.↵
- 64.↵
- 65.↵
- 66.↵
- 67.↵
- 68.↵
- 69.↵
- 70.↵
- 71.↵
- 72.↵
- 73.↵
- 74.↵
- 75.↵
- 76.↵
- 77.↵
- 78.↵
- 79.↵
- 80.↵
- 81.↵
- 82.↵
- 83.↵
- 84.↵
- 85.↵
- 86.↵
- 87.↵
- 88.↵
- 89.↵
- 90.↵
- 91.↵
- 92.↵
- 93.↵
- 94.↵
- 95.↵
- 96.↵
- 97.↵
- 98.↵
- 99.↵
- 99a.↵
- 100.↵
- 101.↵
- 102.↵
- 103.↵
- 104.↵
- 105.↵
- 106.↵
- 107.↵
- 108.↵
- 109.↵
- 110.↵
- 111.↵
Footnotes
Contributors AS devised the original submission on the invitation of the editor. SRD and AS extended and revised the manuscript. SRD and AS contributed to and approved the final manuscript.
Competing interests None declared.
Provenance and peer review Not commissioned; externally peer reviewed.