Article Text

Abstract
This article builds on the previous two articles in this series, which focused on an evaluation framework and study designs for patient safety research. The current article focuses on what to measure as evidence of safety and how these measurements can be undertaken. It considers four different end points, highlighting their methodological advantages and disadvantages: patient outcomes, fidelity, intervening variables and clinical error. The choice of end point depends on the nature of the intervention being evaluated and the patient safety problem it has been designed to address. This paper also discusses the different methods of measuring error, reviewing best practice and paying particular attention to case note review. Two key issues with any method of data collection are ensuring construct validity and reliability. Since no end point or method of data collection is infallible, the present authors advocate the use of multiple end points and methods where feasible.
Statistics from Altmetric.com
Part 1 of this series of four articles on the epistemology of patient safety research proposed a general framework for the preimplementation evaluation of complex interventions and Part 2 dealt with basic study design. In this third article, we turn to measurement of safety. To determine whether or not a patient safety intervention has been effective, measurements of key objects, events or abstract constructs need to be undertaken as part of the evaluation. These objects, events or constructs are referred to as end points. The process of measurement raises two inter-related methodological questions: what end point(s) should be measured and how should this information be collected? This article discusses the methodological consequences of decisions regarding these what and how questions. We aim to show that methods of measurement are not simply good or bad in themselves but that they also succeed or fail depending on the context in which they are used.
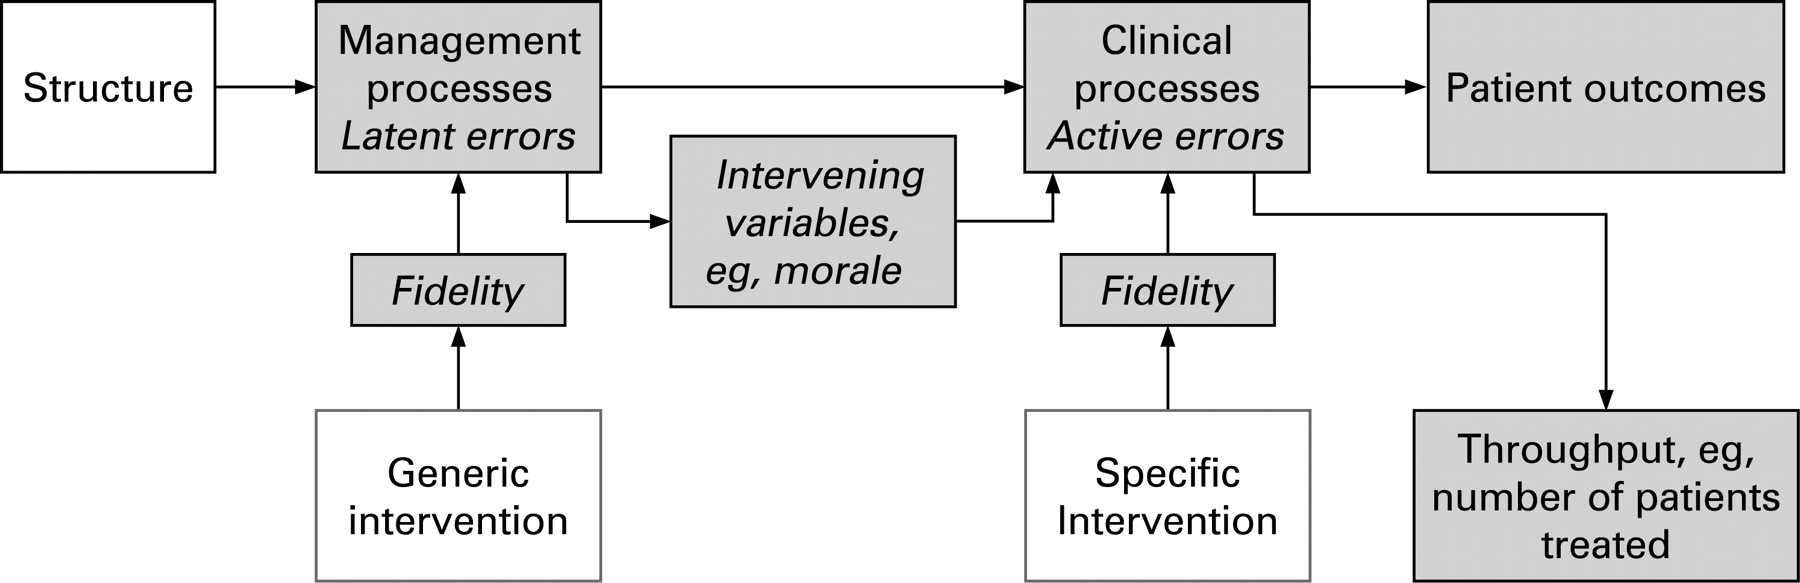
In Part 1 of this series we described a causal chain to show how patient safety interventions may affect patient outcomes – we have re-presented the diagram of this chain in fig 1 in this paper for convenience. In fig 1, the chain of care runs from left to right: from the structure of the organisation to patient outcomes, based on Donabedian’s famous model.1 This causal chain shows how interventions might work and also provides a conceptual map of the end points that may be measured in an evaluation of any patient safety intervention—as identified in the shaded boxes. We separate management from clinical processes, since management processes are usually the target for generic or diffuse management interventions, such as changing skill mix or human resource policies. These interventions may strengthen an institution overall by reducing one or more “latent errors”. Clinical processes are usually the target for specific interventions focusing on a particular safety threat or “active error”, such as avoiding incompatible blood transfusions. This distinction between latent and active errors is discussed by Reason2 as part of his accident causation model. Clearly the wider the intervention’s net is cast, the greater the number of individual safety practices that can be affected, but we may expect lots of things to be improved a little, rather than a few things to be improved a lot. Information technology (IT) occupies a somewhat intermediate position between diffuse and targeted interventions, because it allows specific practices to be targeted by specific algorithms nested in a diffuse enabling technology. The IT platform is a diffuse intervention whereas many specific algorithms are targeted interventions. Similarly, trying to get organisations to use plan-do-study-act cycles is a generic intervention while an intervention to promote particular plan-do-study-act cycles to improve the vigilance of monitoring patients on acute medical wards is more specific.

Our discussion of different end points and associated measurement issues starts at the right-hand side of the causative model in fig 1 with patient outcomes. We then consider three process-level end points as indicated by the shaded boxes in fig 1: fidelity, intervening variables and clinical error rates. Collectively, end points occurring prior to the final patient outcome are known as surrogate end points.
PATIENT OUTCOMES
Classification
The intention of any safety intervention is to improve outcomes for patients by reducing harm. Patient outcomes can either be clinical (eg, morbidity or mortality) or patient derived (eg, quality of life or patient satisfaction). Measurement issues for both quality of life and patient satisfaction are discussed in detail elsewhere34 and we will concentrate on physical harms, not because they are more important, but because they seem to fit more closely into a safety rubric. Two issues arise when patient outcomes are used as an end point:
the signal (improvement caused by the intervention) to noise (stochastic variance in outcome) ratio (ie, issues of precision);
defining outcomes (both the numerator and denominator) consistently and minimising case-mix bias (ie, issues of bias).
Signal to noise ratio
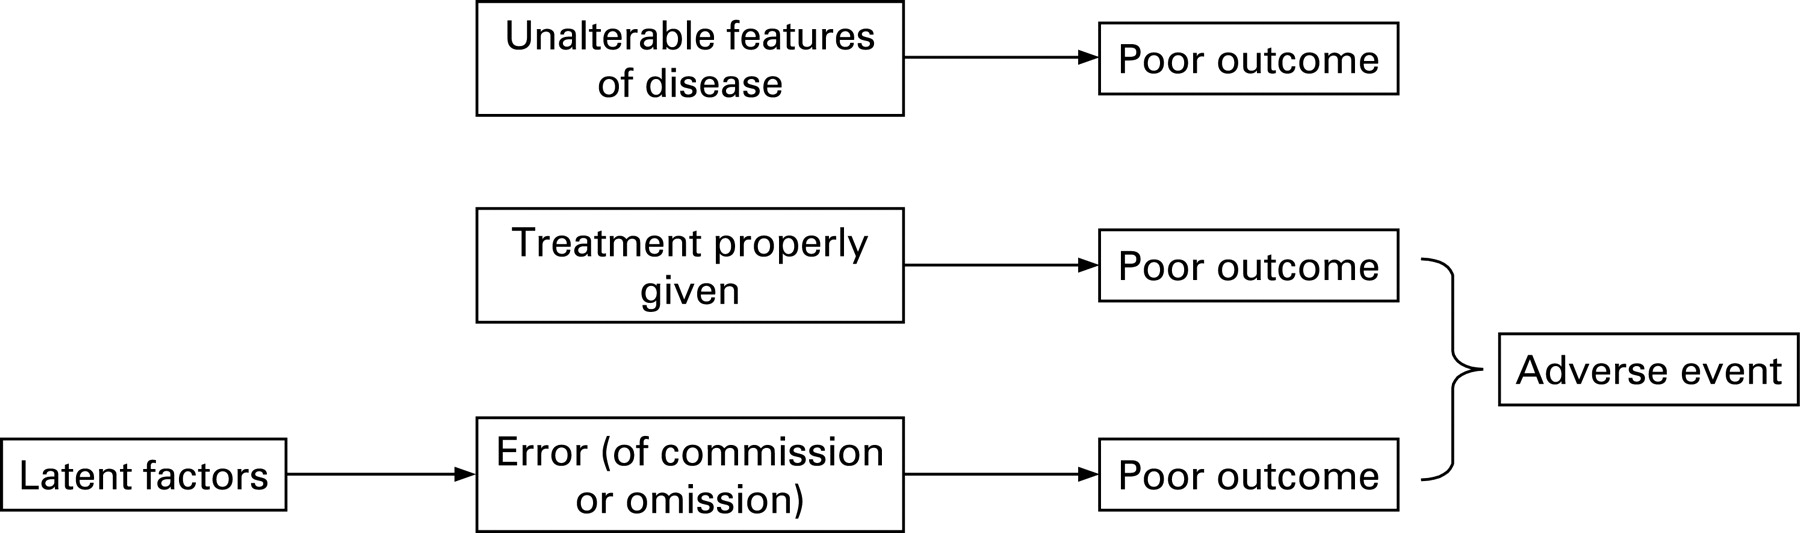
A common problem for evaluators is that the patient outcomes that may plausibly be affected by an intervention are also influenced by many other factors. For example, a computerised prescribing programme may be designed to reduce harm from prescribing errors. Such a programme could be effective in reducing harms of various sorts, but an evaluative study may fail to detect true benefit because the signal (improved outcome from fewer prescribing errors) is lost in the noise (variance in outcomes due to other factors—patient, prescriber and disease related). The causes of poor outcomes are illustrated in fig 2 with errors forming just one component of the model.

Figure 2 illustrates that using patient outcomes as the end point in an evaluation of a patient safety intervention will result in a high risk of a beta (or type II) statistical error—the error of accepting the null hypothesis when it is not true. In short, adverse patient outcomes would be an imprecise end point. As an example of the imprecision of measurements of outcome as a reflection of quality, Mant and Hicks5 model the contribution of adherence to care standards and other factors to documented differences in heart attack survival across hospitals. Even if all appropriate care standards were followed in some sites and none in others, this could account for only half of the observed differences in mortality between hospitals. Since such large differences in safety practice are implausible, very large sample sizes would be needed to show realistic differences in safety in an evaluative/comparative study.
The signal to noise ratio can be improved in various ways:
Choosing patient safety outcomes (harms) that arise exclusively (or mostly) from error as the numerator (or signal). Romano and colleagues6 have produced a list of such outcomes (eg, wrong site surgery or retained surgical swabs). However, such outcomes tend to be rare (as noted in Part 1 of this series). For example, outcomes such as death after a heart attack would not be included, since such deaths are mostly independent of error. This greatly limits the value of an approach based only on measurement of the effects of interventions on such error-specific outcomes.
Selecting as the numerator only the cases of poor outcome (harm) that were caused by poor care—that is, those resulting from error. This requires first identification of poor outcomes and then examination of the process of care so as to select instances when the poor outcome was the result of deficiencies in care. Such “enrichment” has limitations. Firstly, judgement about the outcomes that could be prevented is fallible; it is difficult if not impossible to determine whether a particular case of wound infection was preventable, for example. Different reviewers may therefore disagree: for example in the Harvard Medical Practice Study where two reviewers were asked to judge whether an adverse event (AE) was due to negligence, a κ of 0.24 was achieved, indicating that the reviewers agreed in just 24% more cases than would have been expected by chance alone.7 Moreover, causal judgements are affected by hindsight bias, where reviewers are skewed by awareness of the outcome.89 Studies need to be designed to ensure, as much as possible, that such hindsight bias is equal across units of comparison—for example, by masking (blinding) observers to the unit being compared and the hypotheses being tested and by using the same independent observers across units of comparison.
Avoiding bias
Outcomes may be difficult to measure in a consistent way. For example, Bruce and colleagues10 undertook a systematic review that identified over 40 definitions of two surgical AEs (wound infection and anastomotic leak). They documented considerable variations in the definitions and also in the implementation of an agreed definition across sites. In the context of research, it is important to ensure that the same observers make measurements across sites wherever possible, to ensure that the results will not be biased due to differences across observers, even when they are applying the same definitions.
A comparison of outcomes between sites may also be affected by differences in case-mix. Patients who are sicker and/or older have more comorbidities and are at increased risk of both worse outcomes and experiencing more errors due to the requirement for more interventions. This situation leads to case-mix bias in comparative studies even after statistical adjustment for known confounders.1112 Bias can be minimised by randomisation and by conducting controlled before and after comparisons, as argued in Part 2 of this series.
Outcomes: conclusion
In the case of interventions to tackle safety issues such as wrong site surgery, where the poor outcome is synonymous with the error, the outcome speaks for itself. However, in the more common scenario where error is one of many possible causes of a poor outcome, the risk of a type II error rises in proportion to the dilution of the signal by noise. Ceteris paribus, if the proportion of cases attributable to error halves, the required sample size quadruples.
SURROGATE END POINTS
We now focus on possibilities for measurement occurring at the process level in the causal pathway shown in Part 1 (and repeated in fig 1). Oakley and colleagues13 have recently argued that including a process evaluation alongside a more traditional outcomes-based approach would improve the science of evaluations of complex interventions. We consider three types of surrogate end point: the fidelity with which an intervention is implemented, the effect of the intervention on intervening variables such as morale and the effect of the intervention on clinical error rates. These different surrogates reflect potential “holes” in Reason’s Swiss cheese model2 and hence measuring the size of these “holes” is a metaphor for the measurement of surrogate outcomes across the causal chain in organisations.
Fidelity
Fidelity measures whether the system was implemented as intended—did it “do what it said on the can”? For example, with respect to a computer system: was it installed, did clinicians use the safety functions, were the advertised response times achieved? Where the benefit of the intervention is not in doubt, measuring compliance “stands in for” patient outcomes. For example, a forcing function to prevent mis-connection of tubes delivering oxygen and other gases is known to be effective in terms of patient outcomes. In such circumstances, it might be entirely satisfactory to measure hospital compliance with directives to deploy the intervention. In the more usual situation, where the benefits of a service level intervention are contested, demonstrating high fidelity at least shows that the distal benefits (in terms of patient outcomes) are plausible. If the proximal measures have not even been put in place, then the distal improvements are implausible. Fidelity is therefore often a necessary but not sufficient condition to prove an intervention has improved patient outcomes. Evaluation can make use of this asymmetry in two contexts:
the context where direct measurements of safety (clinical errors and/or outcome) can be made with high precision (and accuracy). In this case the fidelity measure may help explain a null result;
the context where direct measurements of safety cannot be made with sufficient precision. In this case, showing that the intervention was implemented as planned provides reassurance that the desired effects on safety are possible.
As an example, a “wrong site surgery” initiative may involve promulgation of a series of measures to prevent surgery on the wrong part of the body. Showing that the prescribed measures had been put in place would not prove, beyond all reasonable doubt, that the intervention was effective at the patient level, but the reverse finding—continuing violation of the tenets of correct site surgery—would carry the implication that probably little patient benefit will be forthcoming. Such a study could go beyond measurement of compliance to include collection of qualitative data to describe factors that might hinder or help implementation. These observations may buttress fidelity measurements by providing further evidence for or against the plausibility of a beneficial outcome and aid the design of implementation strategies.
Intervening variables
We return to the distinction made earlier between safety interventions targeted at a specific patient safety threat and more diffuse interventions aimed at strengthening an organisation in a more generic sense.1415 The latter may impact on frontline care through intervening (or intermediate/mediating) variables such as knowledge, beliefs and morale. If the intervening variables can be measured they can be used as surrogate end points in evaluations of diffuse interventions. For example, improved human resources (HR) policies (such as staff appraisal) are expected to impact on errors by means of effects on staff motivation and morale and reduced sickness. It may thus be informative to measure the effects of such HR policies on these intervening variables. As with fidelity measurement, changes in surrogate measures do not prove that the “downstream” clinical effects will be realised.
One particularly interesting intervening variable is the extent to which an organisation demonstrates a patient safety culture. This has been defined as a situation where16:
staff have a constant and active awareness of the potential for things to go wrong. It is also a culture that is open and fair and one that encourages people to speak up about mistakes. In organisations with a safety culture people are able to learn about what is going wrong and then put things right.
Many tools have been developed to measure safety culture. Although the metric properties of these tools (reproducibility and sensitivity) have been measured, their construct validity has been contested.17 Cooper18 argues that safety culture is made up of many dimensions that probably do not change in harmony (one dimension may change leaving the others unaffected). It is certainly true that improvements in one aspect of care do not always correlate well (or at all) with improvements in other aspects.1920 Furthermore, different dimensions of the safety culture may impact on different clinical practices and hence different end points. There are therefore good arguments for measuring the dimensions of the patient safety culture independently rather than relying on a single “global” measure. The NHS Research Methodology Programme has sponsored two research projects in this area. The first is a comparison of specific tools/questionnaires and holistic evaluation to measure an organisation’s culture and the second is a review of the validity and reliability of measures of human resource management.2122
It emerges from this discussion that the validity of certain intervening variables may be contested. In this case the reasoning within a scientific study may work in two directions:
From effect to cause. Here we wish to accumulate evidence to test the idea that the intervening variable does indeed predict patient outcomes—to test its validity as a surrogate. Logically, the veracity of an intervening variable should be established (and the result replicated) before it is used as a surrogate. One of the research programmes highlighted above21 will be investigating whether there is a relationship between an organisation’s patient safety culture and clinical error rates.
From cause to effect. Here we know (or believe we know) that the intervening variable is associated with an end point closer to the patient. If the intervening variable has been affected positively by the intervention we may be more confident than otherwise that the intervention is effective. For example, Landrigan and colleagues23 highlighted how reducing interns’ work hours reduced their clinical errors. Subsequent interventions (in comparable settings) that are shown to reduce work hours should have a similar effect on errors and therefore patient outcomes.
Clinical process measurements: error
What is an error?
Our final surrogate end point is clinical error, which we discuss in particular detail. Clinical error, which causes or may cause an adverse outcome, is both logically and chronologically the closest surrogate to patient outcomes (fig 1). Clinical error can be broadly defined as the failure to apply the correct standard of care (we come later to defining the correct standard), the failure to carry out a planned action as intended or the application of an incorrect plan.2 Sometimes the error and the outcome are one and the same—for example, wrong site surgery. In such cases the error and the poor outcome occur with the same frequency and so any problem of rarity cannot be curtailed by measuring error. In most cases, however, the error is more common than the corresponding AE, because many errors, even if carried through to the patient, will not turn out to be harmful. Medication error is an example: such errors are common, with serious medication errors a small subset of total errors, which in turn are much more common than contingent instances of iatrogenic harm.2425 Where errors are more common than AEs, their relative frequency affords greater precision in measurement. However, measurement of error is not a panacea, and in this section we discuss some of the issues that should be considered in the measurement of error. We begin with identification of error by reporting systems and trigger tools and progress to the measurement of error rates by more formal methods. We consider case note review in some detail, although the ideas relating to type of data extracted, validity and reliability apply to other methods.
Reporting systems
Reporting systems may be compulsory or voluntary.26 They are denominator-free in the sense that the reporting system itself does not collect information on the whole “population”.2728 Errors and near-misses are reported as they arise and any denominator has to be “fitted” later. Such a denominator could be a unit of time or a population of patients. Differences between study units in the number and type of patients obviously mean that there is a high likelihood of bias in any comparative study based on reporting and retro-fitting a denominator risks a data driven (self-fulfilling) hypothesis—one of the cardinal offences in scientific practice.29 There are other problems with reporting systems:
Reporting is grossly incomplete and highly selective, irrespective of whether it is voluntary or compulsory.30–33
Any change in reported events may reflect propensity to report rather than a true change in the underlying problem. Indeed, as an institution improves in the care it delivers, more problems may be reported, since open reporting is a tenet of safe practice.
There are thus major problems in both the enumeration of reported events themselves and in relating these events to a “common denominator”. This does not mean that reported incidents are not of scientific value. While moderate differences in reported incidents are not reliable or valid measures of performance, massive proportional changes for particular errors may be indicative of improvement, especially in the case of some of the most egregious errors such as intrathecal injections of neurotoxic pharmaceuticals, which are hard to “hide” and are therefore captured in a fairly consistent way. Furthermore, national-level data from reporting systems are useful for identifying priorities for patient safety interventions or detecting previously unsuspected hazards such as side effects of drugs or device malfunction.3334
Patients have been asked to report on AEs that they think might result from their care. In the specific case of AEs from medication, patients have been shown to identify these reliably.35 However, when asked more generally to identify patient safety incidents, they fail to distinguish between unpreventable AEs and those relating to service quality.3637
Trigger tools
A trigger tool is used to identify sentinel events, such as abnormal laboratory values, the prescription of antidotes or reports of patient harm, which indicate that a preventable AE or adverse drug event (ADE) may have occurred.3839 Although manual detection of triggers from paper-based systems is possible,40 trigger tools are ideally suited to organisations where large amounts of data are captured electronically. Cases with positive triggers are subjected to further investigation to determine whether the trigger event was preventable—that is, whether an error had occurred. Since detailed case note review is only required with respect to a positive trigger, the method is less resource intensive than a detailed manual review of all case notes in the sample. There are three main problems associated with the use of trigger tools: their lack of sensitivity, their low specificity and thus positive predictive value (PPV) and the risk of bias inherent in their use.
The usefulness of trigger tools depends on their sensitivity and specificity. Sensitivity describes the proportion of AEs/ADEs detected by the tool. However, it is difficult to assess sensitivity since there is no explicit gold standard method of detecting these events.41 There is evidence that trigger tools identify more AEs/ADRs than voluntary reporting systems,41–43 but fewer (and also different) events than traditional case note review methods.384445 For example, the first study of the use of trigger tools in the UK38 found that the tool identified less than 1% of prescribing errors (identified through the trigger tool, spontaneous reporting, pharmacist review and retrospective case note review). The proportion of errors identified was higher for serious errors but never exceeded 50%.38
Specificity describes the proportion of triggers that are preventable. If the trigger is not specific the PPV will be low and scarce resources will be devoted to investigating false positives. Empirical estimates of PPV vary considerably as shown in table 1 for a selection of studies, but do not exceed 38%.
Furthermore, from the research point of view, trigger tools may yield highly biased comparative data across organisations. This is because there is a risk that the tools will identify different events with different sensitivities, depending on local factors such as the type and completeness of information held on the database used to identify the triggers and the algorithms used to interrogate the databases. Such comparisons are also prone to bias because of differences in the denominators that must be used to construct event rates for comparative purposes. Trigger tools are likely to yield better (less biased) results when used over time within an organisation so long as there is no material change in the type of data collected, the algorithm that drives the tool or the types of patients treated.
Error rates
Errors affecting clinical processes require measurement of both numerators and denominators if they are to be used for comparative purposes. The best way to identify both numerators and denominators is to construct a cohort—either prospectively or (if the information is available) retrospectively, as we discuss below. Errors are often denominated at the level of the patient (ie, errors per patient). However, this may yield biased results, particularly in non-randomised and unmasked studies. This is because case mix bias may confound comparisons based on error rates as it does comparisons based on outcomes—that is, differences in case mixes across time or place may yield different opportunities for error. A partial way out of this conundrum is to denominate errors on the opportunity for error, rather than on the number of patients.12 Using opportunities for error provides a method to reduce bias due to systematic differences in case mix across comparators. Case mix bias is not likely to be completely avoided by using opportunity for error as the denominator for two reasons:
It may be easier to detect opportunities for error in one place than in another, for example due to differences in note keeping. Consider for example, case note review in two hospitals, one of which keeps exemplary case notes and the other where note keeping is perfunctory. Clearly, the observed opportunity for error will be greater in the former case and this may mask differences between institutions, or worse, result in more adverse measurements for better performing sites. Even if the case notes were exactly the same and completed with equal diligence, bias could still occur if different observers made observations in different hospitals. If this difference between observers was random, then this would widen the variance, diluting any findings and increasing the risk of a type I error. If the difference was non-random, the results would be liable to inaccuracy (bias) as well as imprecision.
Equally performing clinicians may simply find some errors more difficult to avoid than others and this confounds comparisons when the opportunities for error differ from place to place. For example, if patients with more comorbidities “cluster” under the care of particular clinicians, it may seem that these clinicians make more errors, even after case mix adjustment.48
Despite these caveats, we believe that denominating error on opportunity for error provides at least some protection against case mix bias. Clearly avoiding case mix factors is more important with some designs (cross-sectional comparative studies) than with other designs as discussed in Part 2 of this series. In experimental designs these factors widen the variance between intervention groups and hence reduce precision. The opportunity for error method also provides an elegant method to deal with contingent errors, where the opportunity for error arises only if certain pre-existing conditions are fulfilled—for example, giving insulin therapy in intensive care when the glucose level crosses a certain threshold. It is necessary to make an a priori error (failure to make glucose measurements) to expose the risk of contingent error (failure to institute insulin therapy when glucose exceeds a certain threshold). In such instances, comparisons of the number of contingent errors as a proportion of the number of patients across time and/or place would be biased and should instead be denominated on the number of primary errors (which should be enumerated separately).
Formal methods for measurement of error rates
There are four main methods for the direct detection of error rates where both numerator and denominator information are collected according to a prespecified protocol:
case note review—retrospective construction of a cohort;
prospective data collection by clinical staff;
prospective data collection by independent observers;
prospective data collection by a participant observer—simulated or real patients.
The important distinction between all of these methods and reporting systems is that data are recorded from all cases in a predefined cohort, irrespective of whether an error and/or adverse event has occurred. By a long margin, the greatest amount of methodological research has been undertaken using retrospective case note review. A good early example of a study using case note review evaluated changes in the quality of care in the USA following a change in Medicare’s payment process.49 Evidence suggests that the four different methods above will not result in identification of the same set of errors. Michel et al50 show that prospective data collection by clinical staff produced a higher error rate than retrospective evaluation of case notes in the context of accident and emergency care.
The relative strengths and weaknesses of these (and other) methods of data collection have been reviewed by Thomas and Petersen,51 Murff et al52 and the UK’s National Patient Safety Agency.53 Thomas and Petersen51 suggest that the relative utility of different methods depends on the type of error or incident being investigated. Direct observation requires skilled observers and is expensive although there are many errors, such as those arising from drug administration, which are only assessable by direct observation. Participant observation by patients is more reliable and valid for detection of failures in communication, empathy and service quality than for the technical aspects of care.3654 Observation by trained observers or experts simulating patients can be used to describe both the technical and humane aspects of care, but simulated patients can only be used in non-acute settings, for obvious reasons. While the use of “mystery shoppers” is now common within retail settings, most people would think that, ethically, clinicians should be forewarned that some of their patients will be providing assessments of their care.
Implicit versus explicit review
Data on error (whether in case notes or observations) can be collected using implicit and/or explicit methods. The implicit method involves experts making their own judgements about the quality of care provided and can be either structured or unstructured. In an implicit structured review, experts are presented with a series of preparatory questions designed to elicit a complete review of the important facets of care. In contrast, experts are given little specific guidance for unstructured reviews, which follow the format typically used by expert witnesses in litigation cases. However, structured and unstructured reviews are non-rivalrous; both can be undertaken using the same source materials.
Explicit reviews involve the objective application of predetermined standards, for example to facets of care recorded in the case notes. Standards are developed using expert groups and/or national care protocols. Explicit reviews can be focused (using a limited set of supported and feasible measures) or global (using a broader set of quality measures for a large number of conditions). Jha and colleagues19 apply a focused approach to assess care in 3558 US hospitals. Data were collected on 10 indicators of the quality of care across three conditions: myocardial infarction, congestive heart failure and pneumonia. The quality of care in the USA has also been studied using a global approach, applying 439 indicators for 30 conditions and preventive care.55 These global indicators have been adapted for use in the UK,56 using a limited set of 200 indicators across 23 conditions. More recently, the American Medical Association has agreed to requests from the US government to develop by consensus 140 evidence-based measures of doctor performance in 34 clinical areas.57
Criteria or indicators should only be applied in an explicit review if they are considered relevant to the patient in question.49 Such conditionality means that a different number of criteria will apply to each patient, with a risk of bias in comparative studies discussed above. Where prevalence of relevant criteria is low, measurements will be imprecise unless very large (expensive) samples are used.56
One important methodological consideration is the analytical approach to multiple criteria (ie, different types of error) and this is considered in some detail by Kirk and colleagues.56 Different criteria can be analysed separately, but investigators may wish to combine the criteria to produce a global measure of quality/safety. This could simply mean summing the number of criteria judged to have been met or by weighting the different criteria according to a scale of importance. These weightings could be based on judgement of clinical importance/relevance, perceived strength of empirical evidence or the extent to which they have been shown to discriminate between good and bad organisations. Not surprisingly, different methods of combining the same data produce different rankings across institutions. It is important to prespecify how the data will be combined58 to avoid data-driven conclusions.
Both implicit and explicit methods of data collection have advantages and disadvantages (table 2). The National Health Service (NHS) Research Methods Programme is currently funding a study that is comparing implicit and explicit methods using approximately 3000 case notes from patients with chronic obstructive pulmonary disease and heart failure.59 Kerr and colleagues60 compared the results of semi-structured and structured implicit, and explicit reviews using case notes from 621 medical patients across 26 hospitals. Inter-correlations of reviewer scores were moderate to high across different dimensions of care at both the patient and hospital levels. Therefore the different review methods probably tap into the same underlying concept of quality/safety.
Increasing use of patient electronic records will afford greater opportunities for the detection of error. The records contain coded information (typically vital signs, drugs given, allergies, test results and disease codes) and uncoded information (free text). With appropriate reporting functionality, this should facilitate the detection of some errors that will be measurable in an unbiased and precise way under program control, but all the other caveats about error detection will continue to apply to the free text component of the notes, which is where much of the clinical richness lies. A particular issue arises when error rates are used as end points in comparative studies of electronic and manual case notes. In this scenario, the “method might be the medium” in the sense that errors may come to light as a result of the method used. In our opinion this is one of the most important unsolved methodological problems in “safety measurement”.
Validity
Any method of data collection needs to demonstrate construct validity: the results need to be an accurate reflection of the underlying concept intended for the data. A surrogate end point has construct validity if it has been shown empirically to correlate with outcome or if this is judged to be self-evident. Thus, if a particular clinical action is associated with worse outcome, then counting occurrences of the action provides an end point which has high validity.11 For example, failure to administer anti-D prophylaxis to a Rhesus-negative woman after birth of a Rhesus-positive baby is an error that is a good surrogate for harm: sensitisation of the mother.
However, many actions (or failures to act) may be more ambiguous and hence their construct validity is less clear-cut. For example, it is commonly believed in patient safety circles that minor prescription errors are a good surrogate for major prescription errors. It would be convenient if this was so, since the relative frequency of minor errors means that measurements can be more precise, increasing the power of statistical conclusions. However, for this to hold good there must be a correlation between minor and major errors. Heinrich’s seminal work in 1931 outlined a ratio in which there were 29 minor injuries and 300 no-injury accidents for every major injury.61 However the empirical basis for this conclusion is very poorly described and a review of studies on prescribing error found insufficient evidence to support a single ratio that could be used to validate the use of minor errors as a surrogate for major errors.2438 Intuitively, we would expect (any) relationship between minor and major errors to be context dependent and hence we think that this is an important topic for future enquiry. In the meantime we think it prudent to regard minor errors as a surrogate for major errors if they are clearly on the direct causal pathway. Failure to test blood group is on the causal path to failure to give prophylaxis, which is on the causal path to Rhesus sensitisation. However, a minor dosage error is not on the direct causative path to a potentially fatal drug interaction error. They are indirectly linked through the idea that both are a sign of lack of vigilance or some general failing: the idea behind the Heinrich ratio. While this remains unproven we urge caution in concluding that real improvement has occurred when indirectly linked minor errors have been reduced.
Reliability
Any measure of patient safety needs to be reliable (repeatable). Interobserver reliability implies that two (or more) observers/reviewers would come to the same conclusion when evaluating a single care process. The traditional method of assessing the extent of inter-rater reliability between independent reviewers is the Cohen κ,62 although the sensitivity of κ to the prevalence of error63 has resulted in other methods, such as tetrachoric or polychoric correlations, being advocated where possible.64 Since duplicating observations is expensive, it is important to optimise the sample size for the measurement of reliability using formulae to calculate the precision of measurements of interobserver agreement.65
Lilford and colleagues63 build on a previous review of inter-rater reliability of case note review by Goldman.66 A total of 66 sub-studies (taken from 25 original papers) were included in the review, with κ ranging from 0.10 to 0.83. The authors considered factors that may affect the κ obtained and reported that the use of explicit, rather than implicit, criteria for review raised the mean κ from 0.39 to 0.62; assessing outcomes, rather than causality or processes increased κ (mean κ 0.59, 0.41 and 0.37, respectively); and that, as noted earlier, κ was positively correlated with the prevalence of error (r = 0.44, p<0.01).
Reliability in implicit reviews can be enhanced through reviewer training. However, it is important to consider the need to train reviewers, rather than homogenise them. For example, Rubenstein et al67 used reviewer training to encourage use of a uniform set of rating terms rather than to change opinions about what should have been done. Alternatively, discussion between reviewers can be used to share knowledge and (theoretically) increase reliability. However, when Hofer and colleagues68 compared the effects of discussing case notes on inter-rater reliability they found more agreement within, but not between, pairs of reviewers.
CONCLUSION
This article has continued our series on the epistemology of patient safety research, and has considered the what and how questions relating to the measurement of study end points. We have outlined the problems associated with measuring patient outcomes and recommend that a study using patient outcomes as an end point also uses one or more surrogate end points—an idea that is continued in the final article in this series. We considered three types of surrogate end point in this article: fidelity, intervening variables and clinical error. Clinical error can be measured using several different methods, none of which can be considered the “gold standard”. Hence care is required in determining the method of data collection to be employed in patient safety research and this decision may not be independent of previous decisions regarding study design. In Part 4 of this series we therefore bring the themes of the first three articles together to identify the factors influencing decisions with respect to study design and measurement: which size fits whom?
Acknowledgments
We would like to acknowledge the support of the National Coordinating Centre for Research Methodology and the Patient Safety Research Programme. The authors would also like to acknowledge the contributions of attendees at the Network meetings and the helpful comments of the peer reviewers.
REFERENCES
Footnotes
See Editorial, p 154
Competing interests: None.
Authors’ contributions: RL conceived the Network and formulated the first draft of the report and the current paper with assistance from AJ. CB contributed to subsequent drafts of the report and this paper. BDF, TH, RT and JN contributed to the Research Network and provided comments on drafts of the report and papers in their areas of expertise.
This work forms part of the output of a Cross-Council Research Network in Patient Safety Research funded by the Medical Research Council (Reference G0300370). More details of the Research Network can be found at: http://www.pcpoh.bham.ac.uk/publichealth/psrp/MRC.htm
Linked Articles
- Quality lines
- Editorial