Article Text

Abstract
Introduction: Standards of practice have been developed by the pharmacy profession to address the provision of non-prescription medicines, using a consumer-focused and risk management approach. The application of these standards in Australian community pharmacies has been monitored since 2002 by the Quality Care Pharmacy Support Centre (QCPSC).
Methods: Between September 2002 and September 2005, 7785 standards maintenance assessment visits were conducted in 4282 pharmacies, using pseudo-patient methodology. 1909 were symptom-based requests (SBRs) and 5876 were direct product-based requests (DPRs), of which 2864 were for pharmacist-only medicines (POMs) and 3012 were for pharmacy medicines (PMs). 2756 pharmacies received two visits, and 747 received three visits. A pharmacy’s performance was scored out of 10 at each visit (scores 0–3: “unsatisfactory”; 4–6: “satisfactory”; and 7–10: “excellent”).
Results: There was wide variation in performance at baseline, with 1453 (34%) of pharmacies scoring ⩽3, 1851 (43%) scoring 4–6, and 978 (23%) scoring 7–10. Significant improvement was seen over time (p<0.001), the mean score increasing by 5% from 4.4 (2.6) at visit 1 to 4.9 (2.6) at visit 2, and by 10% to 5.4 (2.6) at visit 3. Subanalyses to control for the effect of scenario type and medicine type showed that performance was higher for SBRs than DPRs, but the latter showed greater improvements over time.
Conclusion: Repeated pseudo-patient visits lead to notable improvement in behaviour in the handling of non-prescription medicines in community pharmacies. A range of factors need to be considered when measuring these behaviours, such as scenario or medicine type, as they have considerable influence on performance. Future research should focus on issues of quality control, to better understand what makes some pharmacies perform satisfactorily and others unsatisfactorily, and what is required to shift performance from “satisfactory” to “excellent”.
- PM, pharmacy medicine
- POM, pharmacist-only medicine
- QCPSC, Quality Care Pharmacy Support Centre
- SMA, standards maintenance assessment
Statistics from Altmetric.com
- PM, pharmacy medicine
- POM, pharmacist-only medicine
- QCPSC, Quality Care Pharmacy Support Centre
- SMA, standards maintenance assessment
There is a growing international trend for consumers to self-medicate with non-prescription medications for common ailments.1 Pharmacists and pharmacy assistants are in a unique position to support consumers’ purchases of these medicines through the application of knowledge and skills, in an environment in which safety and quality remains paramount.2,3 Standards of practice have been developed by the pharmacy profession to deal with the provision of these medicines, using a consumer-focused and risk management approach.4 Since 2002, the application of these standards in Australian community pharmacies has been monitored by the Quality Care Pharmacy Support Centre (QCPSC) (Benrimoj et al 2007, submitted for publication). The Centre’s primary objectives are to assess, benchmark and support pharmacies previously accredited under the Quality Care Pharmacy Program.5 The specific objectives of the present study were to:
-
measure the overall change over time in the score achieved by pharmacies, based on the assessment criteria;
-
measure the differences in scores based on the type of scenario—that is, symptom-based requests and direct product requests;
-
measure the differences in scores based on the type of product—that is, pharmacist-only medicines (POMs—medicines for which the pharmacist is required to be personally involved in the sale of the medicine) and pharmacy medicines (PMs—those available only in pharmacies)6;
-
measure the differences in scores based on both the scenario and the type of product.
METHODS
The QCPSC is a national centre based in Sydney, Australia, and is staffed by a director, data manager, administrative assistant and consultant pharmacist. It also has a network of 14 state-based coordinators, whose role includes conducting standards maintenance assessment (SMA) visits.
SMA visits
SMA visits use pseudo-patient methodology, also termed “mystery shoppers”, “pseudo-customers” and “simulated patients”.7 In this technique a person goes to a particular health setting for the purpose of observing and/or testing the healthcare process, rather than seeking treatment.8 SMAs are carried out by actors, together with trained coordinators whose role is to provide an assessment of the pharmacy’s performance according to predetermined criteria based on behaviours (Benrimoj et al 2007, submitted for publication). The SMAs are not intended to measure clinical skills. They are focused on measuring the verbal behavioural interaction between the pharmacist and/or pharmacy assistants and the pseudo-patient, who is acting as a surrogate for a real patient. They are focused on the process as reflected in the standards and protocols accepted by the profession. After the pseudo-patient visit, the coordinator immediately goes back to the pharmacy to provide feedback. The pseudo-patient–pharmacy staff member interaction is audiotaped to ensure that the feedback provided to pharmacy proprietors/managers and their staff is accurate.1,7
The pharmacies were given a score out of 10 according to their performance at each SMA visit. Scores of 0–3 were classed as “unsatisfactory”; 4–6 as “satisfactory”; and 7–10 were considered “excellent”. As stated above, the SMA report is initially scored by the coordinator and the interaction audiotaped to ensure validity. A single individual consultant pharmacist then re-scores the audiotaped interaction. We found that 10% of assessment forms required correction following this checking process. In every case corrected, performance of pharmacists and staff had been underestimated in the immediate assessment. The most common errors observed were failure of the pseudo-patient to recognise information provided by the pharmacist/staff (39%) and lacking clear recall of whether staff had met certain criteria (34%).9
Several scenarios (59 in total) were developed for use in the SMA visits, representing a broad range of over-the-counter requests and simulating common patient presentations. The development and validation of these scenarios using a consensus approach is described in more detail in another paper (Benrimoj et al 2007, submitted for publication). Two scenarios were used per month.
The human research ethics committee at the University of Sydney approved the research methodology and materials.
Direct product vs symptom-based requests
In direct product request scenarios, the pseudo-patient requests a product by name—for example, “Could I please have a box of aspirin?”. In symptom-based requests the pseudo-patient presents with a set of symptoms—for example, “Could I please have something for diarrhoea?”.
Types of product
Within the direct product request scenarios, the requested medicines could either be a POM, thus necessitating the involvement of the pharmacist in the sale, or a PM, which may be sold by a pharmacy assistant.
Between September 2002 and September 2005, 7785 SMA visits were conducted in 4282 pharmacies (representing 87% of Australia’s 4921 pharmacies). Of these 1909 were symptom-based requests and 5876 were direct product requests, of which 2864 were for POMs and 3012 were for PMs. Two visits each were made to 2756 pharmacies, whereas 747 pharmacies received three visits.
Of the 49 scenarios in which than one pseudo-patient participated, six had significant differences in scores (p<0.05) (three symptom-based requests and three direct product requests). However, we did not find any significant differences when the scores for these scenarios were compared with all other symptom-based and direct product request scenarios.
Data analysis
We entered the results from each visit into a Microsoft Access database, and these were then extracted into SPSS v11.5 (2003) for analysis. The analyses included summary statistics and paired sample t tests for mean comparison and differences between SMA performance across different visit points.
RESULTS
Baseline results
At visit 1, 1453 (34%) pharmacies performed unsatisfactorily, 1851 (43%) pharmacies received a “satisfactory” score, and 978 (23%) pharmacies were deemed to have performed in the “excellent” range. The mean (SD) score at visit 1 was 4.4 (2.6).
Overall changes in scores over time
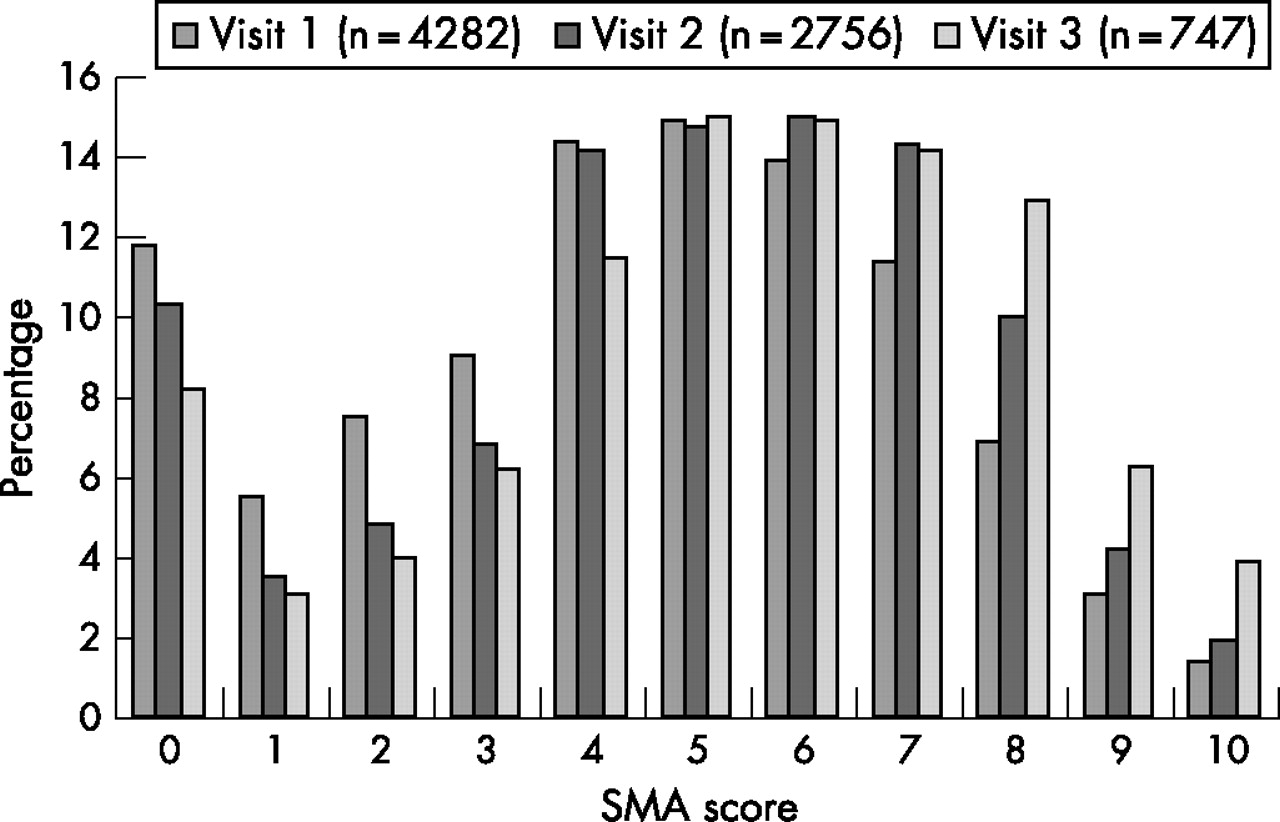
Overall, there was a significant improvement in the mean score between first and second visits (p<0.001), and from second to third (p<0.001; table 1). The mean (SD) score increased by 5% from 4.4 (2.6) at visit 1 to 4.9 (2.6) at visit 2, and by 10% to 5.4 (2.6) at visit 3. Furthermore, fewer pharmacies achieved an “unsatisfactory” result at visits 2 and 3, whereas significantly more achieved “satisfactory” or “excellent” results by scoring 5 or above in the second and third visits (p⩽0.02) (fig 1).
Paired samples t test, visits 1–3

Frequency of standards maintenance assessment (SMA) scores, visits 1–3.
This improvement indicates a mean category shift from “unsatisfactory” to “satisfactory”. When the pharmacies whose performance at the initial visit was “unsatisfactory” (n = 1453) were isolated, the mean score increased from 1.4 (1.2) at visit 1 to 4.9 (2.6) at visit 2 and 5.5 (2.7) at visit 3. So for this group, significant improvements were observed at visit 2 and maintained at visit 3 (p<0.001) (table 2).
Paired samples t test for pharmacies with an “unsatisfactory” result at visit 1
Differences according to scenario type
We found that pharmacies consistently performed better on scenarios involving symptom-based requests than they did on those involving direct product requests (fig 2). As the type of scenario any given pharmacy received at any visit varied on a monthly basis, it was important to analyse the change in performance between visits within each scenario type (table 3).
Mean standards maintenance assessment (SMA) score by scenario type, visits 1–3
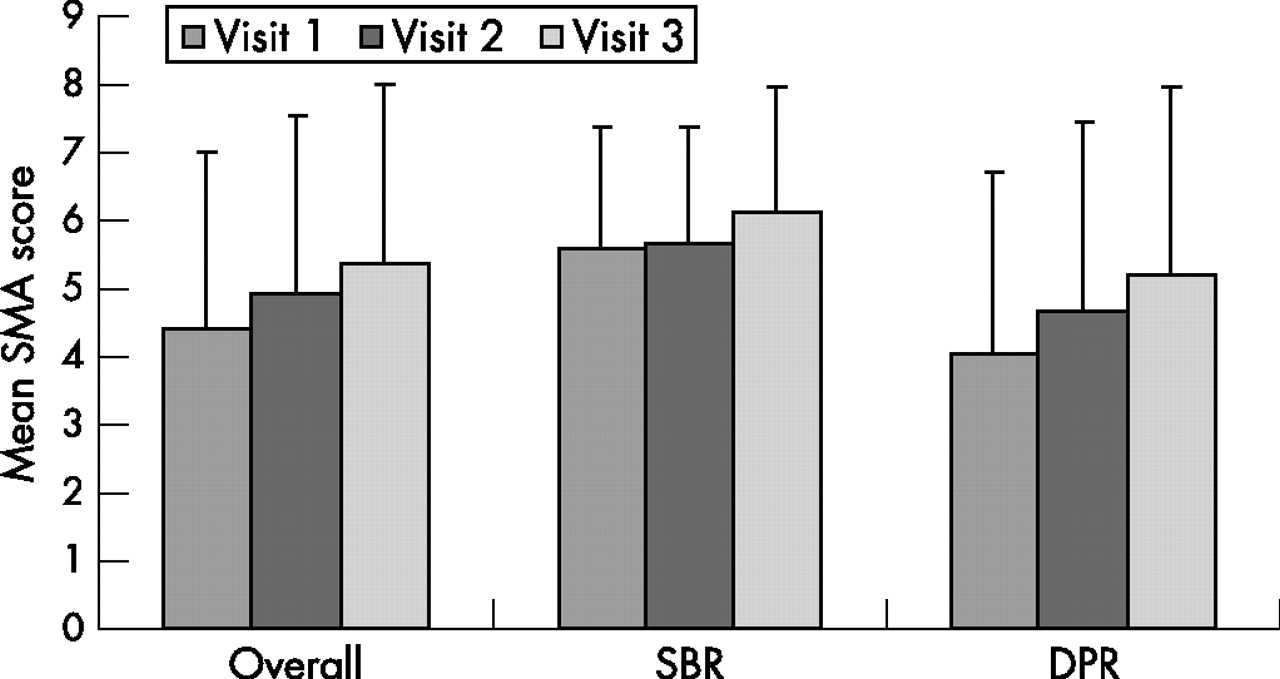
Mean standards maintenance assessment (SMA) score by scenario type, visits 1–3. DPR, direct product request; SBR, symptom-based request.
The different types of scenario elicited differential quality of practice from pharmacies, with consistently better performance observed on scenarios involving symptom-based requests than on those involving direct product requests. The difference between the two decreased at each visit point—from a 16% difference at visit 1, to 10% at visit 2 and 9% at visit 1. However, symptom-based request scenarios showed less improvement between visits 1 and 2 compared with direct product request scenarios (p<0.001).
Differences according to medicine type (POMs and PMs)
Within the direct product request visits, requests for POMs were dealt with better than requests for PMs (fig 3). Significant improvements between visits were made for both PM and POM direct product request scenarios (table 4), with a 9% improvement in the PM visit scores and a 16% improvement in POM visit scores from visit 1 to visit 3 (p<0.001).
Mean standards maintenance assessment (SMA) score by medicine type, visits 1–3
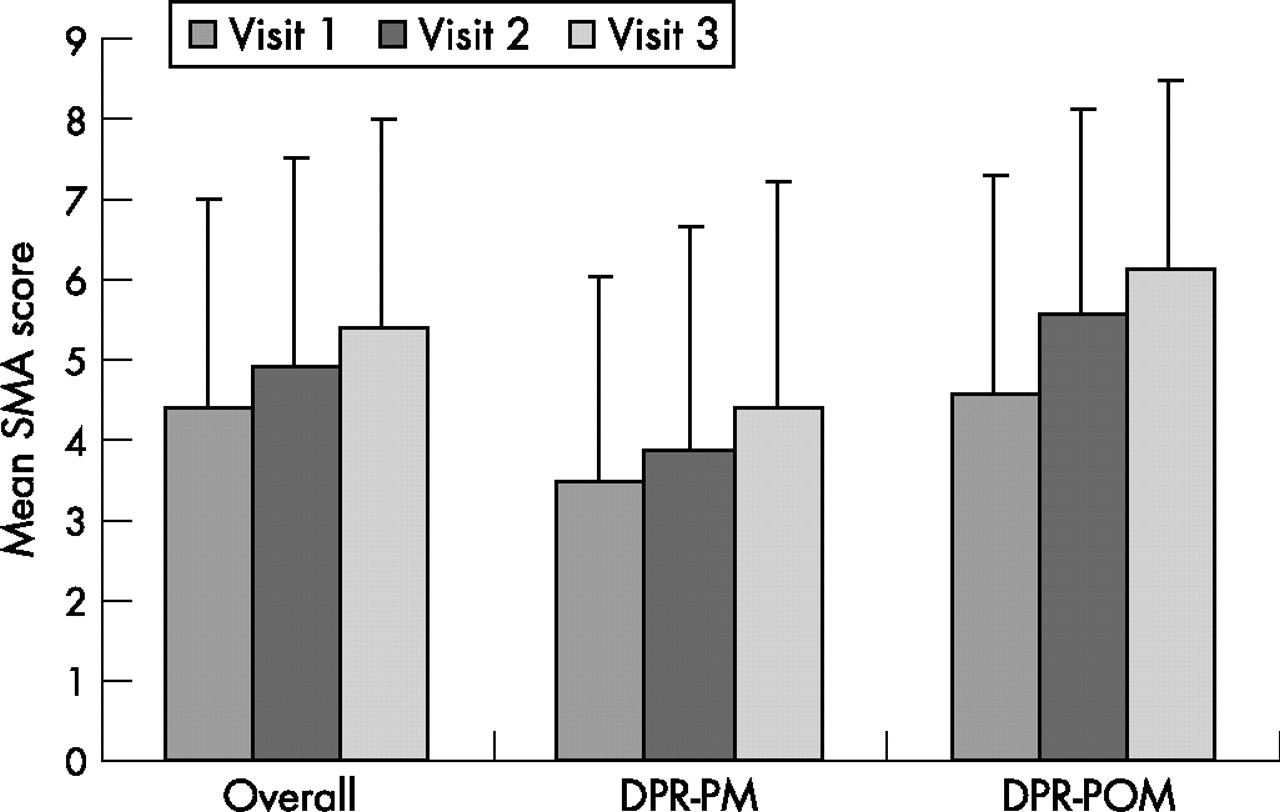
Mean standards maintenance assessment (SMA) score by medicine type, visits 1–3. DPR, direct product request; PM, pharmacy medicine; POM, pharmacist-only medicine.
Scenario and medicine type
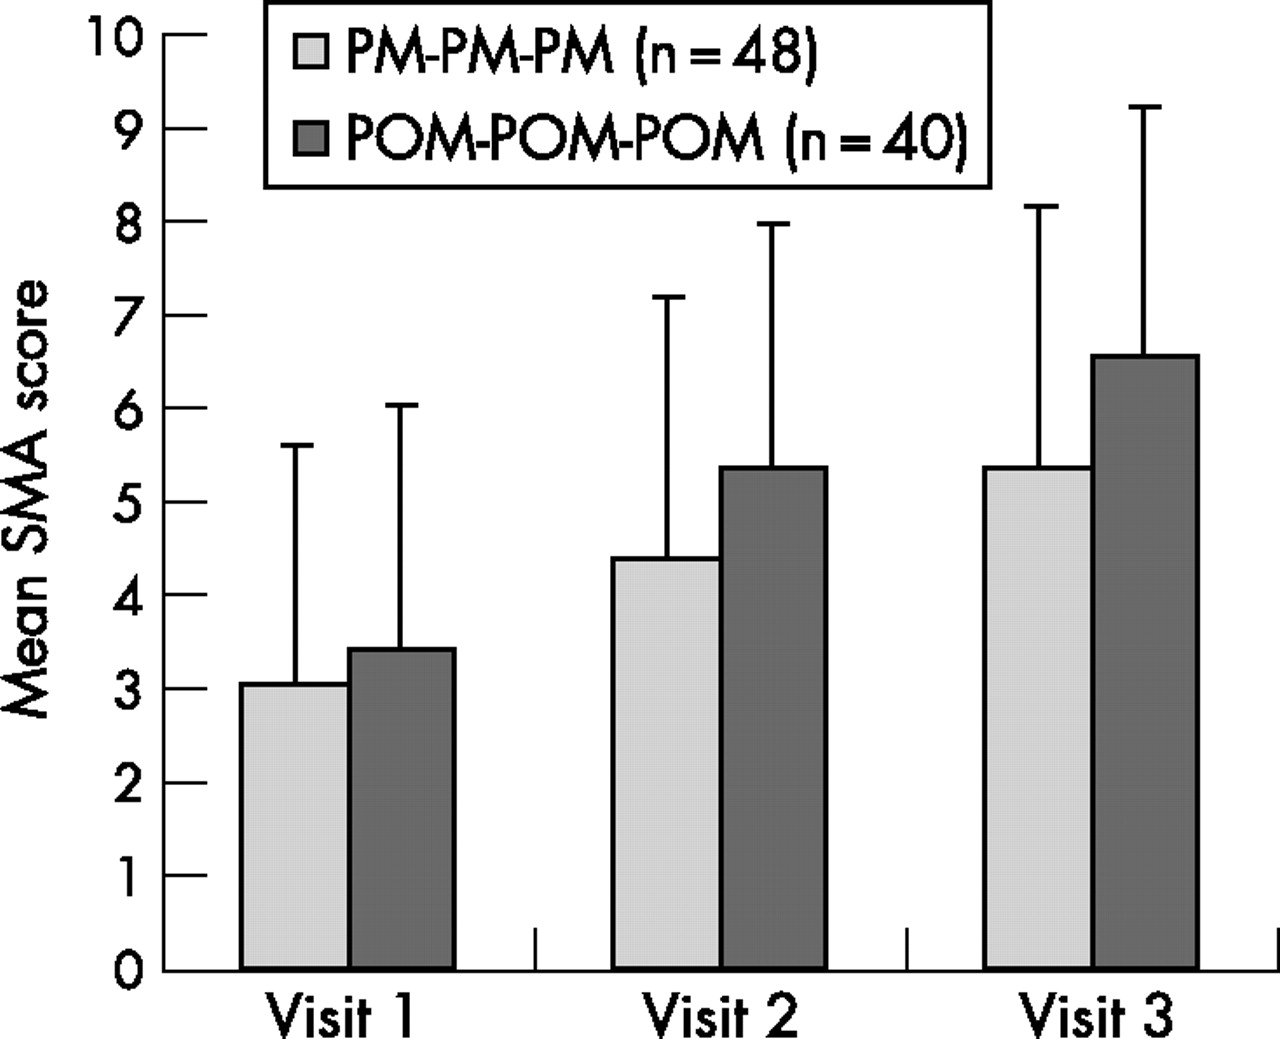
Scenario type was controlled across the three visit points (table 5). The sample size is currently too small to offer any meaningful data on symptom-based requests. Within direct product requests (PM and POM), a significant improvement across visits was shown (p<0.001) (fig 4). Direct product request scenarios are, however, more commonly under-performed than symptom-based request scenarios.
Order of scenario type, visits 1–3

Direct product requests (controlled for medicine type), visits 1–3. SMA, standards maintenance assessment.
DISCUSSION
The combined results of the visits provide a measure of pharmacy performance in relation to the handling of non-prescription medicines. They also allow changes in performance to be measured over time. The overall changes in scores over time suggest that simply by conducting regular pseudo-patient visits to pharmacies, we achieved a 5–10% overall improvement in performance against the standards. We found, however, that although we assume the pharmacies to be a homogeneous population—pharmacies that have all been accredited under the Quality Care Pharmacy programme and are thus familiar with the relevant standards of practice—there is a wide variation in behaviours. This raises questions in terms of quality control for accredited pharmacies, namely, what makes some perform satisfactorily and others unsatisfactorily, and what are the implications for patients of these variations in performance? There may be a range of causes, from the competency skills of pharmacists and pharmacy assistants to their individual behaviours and the systems in place at the pharmacies.
Furthermore, we found that the future behaviours of pharmacists and their staff varied, depending on their initial scores. It seems that the strategy of repeated SMA visits using pseudo-patients is successful for moving pharmacies from unsatisfactory scores to satisfactory scores, but this has less impact on those who score satisfactorily in the first instance. There seems to be variability in terms of competency skills and behaviours, as well as attitudes. It may be that those who receive a satisfactory score initially are complacent and do not see a need nor have any motivation to improve, whereas those who receive an unsatisfactory score initially are “shocked” into improving. Importantly, motivation to change may be affected by an individual’s values.10 These findings have implications for quality improvement as the standards being assessed are minimum standards and not “best practice”.
The order in which scenario types are presented is an important consideration when evaluating improvement from initial to follow-up SMA. For example, if a pharmacy initially receives a symptom-based request scenario and on follow-up receives a direct product request (PM) scenario, their score may decrease even if their practice has not changed in the interim. This is because direct product request (PM) scenarios are generally more difficult (in that they elicit a less thorough performance) than direct product request scenarios. Moreover, pharmacies receiving a direct product request scenario initially, and a symptom-based request scenario as follow-up may display improvement in average score that is merely the result of order of scenario type presentation (receiving the “easier” scenario at follow-up) and not a genuine improvement in the quality of pharmacy practice. Hence it was essential to control for the impact of order of presentation of scenario type on improvement in SMA performance from initial to follow-up visit. Within direct product requests (PM and POM), a significant improvement across visits was shown, reinforcing previous results that suggest pharmacy practice in this area is improving in quality over time. Direct product request scenarios are, however, more commonly under-performed than symptom-based request scenarios, and as such allow more room for improvement.
It is not surprising symptom-based request scenarios typically achieved significantly higher scores than direct product request scenarios, given that in the former the patient provides the opening for the pharmacist or staff member, removing many of the perceived and/or actual communication barriers. It does, however, present a quality assurance issue. The perceptions and behaviours of the pharmacists and assistants are important. For example, the differences between scores for PMs and POMs may well be due to a perception of greater risk in the POM category. This highlights the variations within the overall trend data and raises questions about the impact of this variability on the patient. The true measure of pharmacy improvement is observed in those cases where scenario type is controlled—that is, the same pharmacy received the same type of scenario at both initial and follow-up visits. Symptom-based scenarios showed no significant change in performance over time, but these types of scenario are typically performed well, and thus we may be witnessing a ceiling effect, which thus far does not seem to apply to direct product requests. (A ceiling effect refers to a situation whereby performance on a particular task reaches a level of proficiency across the sample population that results in a lessened ability of said task to fully discriminate between the most competent.) This effect for symptom-based requests typically was seen as an average SMA score around 6. It may be that the current methodology is successful for improving performance in relation to direct product requests (through repeated SMA visits), but not for symptom-based requests, which may require an alternative strategy. As such there still seems to be scope for global improvement across all pharmacies. It may also mean that results of direct product requests at the initial visit may under-represent ability level, and reflect an attitudinal rather than knowledge-based problem.
Several confounding factors could have influenced the observed improvements in pharmacy practice over time. If the scenario type is not controlled for on a pharmacy-by-pharmacy basis, and even within a particular scenario type, there is considerable variability in the difficulty between scenarios. This also applies to differences in medicine type in direct product request scenarios, with PMs producing poorer results than POMs. The scenario any particular pharmacy receives is random—at the moment there is no planning of order of presentation of scenario type, although it is being investigated as a potential development. In addition, the method by which practice is currently assessed works on the assumption that individual behaviour is reflective of overall pharmacy performance. As there is no means of accessing the same individuals at subsequent visits, any internal variation in ability within a pharmacy cannot be measured. Thus, while it is difficult to ascertain the extent to which improvements in pharmacy practice have occurred and the extent to which relative difficulty has masked any changes, improvements observed in the control groups support global findings that suggest an overall improvement from initial to follow-up SMA visit.
We do know that behaviours take time to change. At this stage we are not aware of the impact of these behaviours and any changes on the consumer, which is an area for further investigation. Feedback is provided to the pharmacies on the areas in which they would benefit from improvement, and is also provided to the Guild to use for educational programmes so that they can be tailored to under-performing areas.
CONCLUSIONS
We conclude from this study that repeated pseudo-patient visits lead to notable improvement in behaviour in the handling of non-prescription medicines in community pharmacies. Analysis of a large dataset showed that it is important to consider a range of factors in measuring these behaviours; it is not enough to base conclusions in these types of study on one scenario or one drug8 as these factors considerable influence on performance. These types of data can be used in policy decision making in relation to quality and safety in healthcare. This paper presented the overall results of the first 3 years of the QCPSC’s operations. Future papers will look at subanalyses addressing individual components in more detail. However, investigation in this area is still required, as we know that there is marked variability in the handling of different request types—with symptom-based requests regularly being performed better than direct product requests. There is also variability in performance depending on the medicine type. Future research should therefore focus on issues of quality control, to better understand what makes some pharmacies perform satisfactorily and others unsatisfactorily, and what is required to shift performance from “satisfactory” to “excellent”.
Acknowledgments
The authors would like to acknowledge The Pharmacy Guild of Australia for providing funding to the Quality Care Pharmacy Support Centre.
Footnotes
-
Competing interests: None declared.