Article Text

Abstract
Background Socioeconomic differentials of tobacco smoking in high-income countries are well described. However, studies to support health policies and place monitoring systems to tackle socioeconomic inequalities in smoking and smokeless tobacco use common in low-and-middle-income countries (LMICs) are seldom reported. We aimed to describe, sex-wise, educational and wealth-related inequalities in tobacco use in LMICs.
Methods We analysed Demographic and Health Survey data on tobacco use collected from large nationally representative samples of men and women in 54 LMICs. We estimated the weighted prevalence of any current tobacco use (including smokeless tobacco) in each country for 4 educational groups and 4 wealth groups. We calculated absolute and relative measures of inequality, that is, the slope index of inequality (SII) and relative index of inequality (RII), which take into account the distribution of prevalence across all education and wealth groups and account for population size. We also calculated the aggregate SII and RII for low-income (LIC), lower-middle-income (lMIC) and upper-middle-income (uMIC) countries as per World Bank classification.
Findings Male tobacco use was highest in Bangladesh (70.3%) and lowest in Sao Tome (7.4%), whereas female tobacco use was highest in Madagascar (21%) and lowest in Tajikistan (0.22%). Among men, educational inequalities varied widely between countries, but aggregate RII and SII showed an inverse trend by country wealth groups. RII was 3.61 (95% CI 2.83 to 4.61) in LICs, 1.99 (95% CI 1.66 to 2.38) in lMIC and 1.82 (95% CI 1.24 to 2.67) in uMIC. Wealth inequalities among men varied less between countries, but RII and SII showed an inverse pattern where RII was 2.43 (95% CI 2.05 to 2.88) in LICs, 1.84 (95% CI 1.54 to 2.21) in lMICs and 1.67 (95% CI 1.15 to 2.42) in uMICs. For educational inequalities among women, the RII varied much more than SII varied between the countries, and the aggregate RII was 14.49 (95% CI 8.87 to 23.68) in LICs, 3.05 (95% CI 1.44 to 6.47) in lMIC and 1.58 (95% CI 0.33 to 7.56) in uMIC. Wealth inequalities among women showed a pattern similar to that of men: the RII was 5.88 (95% CI 3.91 to 8.85) in LICs, 1.76 (95% CI 0.80 to 3.85) in lMIC and 0.39 (95% CI 0.09 to 1.64) in uMIC. In contrast to men, among women, the SII was pro-rich (higher smoking among the more advantaged) in 13 of the 52 countries (7 of 23 lMIC and 5 of 7 uMIC).
Interpretation Our results confirm that socioeconomic inequalities tobacco use exist in LMIC, varied widely between the countries and were much wider in the lowest income countries. These findings are important for better understanding and tackling of socioeconomic inequalities in health in LMIC.
- Smoking Caused Disease
- Disparities
- Low/Middle income country
- Global health
- Socioeconomic status
Statistics from Altmetric.com
Background
Tobacco smoking caused an estimated 6.1 million deaths and 143.5 million disability-adjusted life years (DALYs) lost in the year 2013,1 and 967 million smokers are estimated to live in 187 countries worldwide.2 Tobacco use accounts for 18% of deaths and 11% of DALYs in high-income countries (HICs), and 7% of deaths and 3% of DALYs in low-and-middle-income countries (LMICs).3 The global prevalence of tobacco smoking is estimated at 36% by the WHO, with large differences in prevalent rates by sex, and between HICs and LMICs.4 Increases in the rates of smoking in LMICs have resulted in increasing tobacco-related mortality.3 ,5
Patterns of tobacco use vary widely by geography. In addition to smoking manufactured and hand-rolled cigarettes and loose tobacco in pipes, smokeless tobacco consumption, such as chewing (khaini, surti, paan masala) and inhalation (snuff, and snus), is common in South and Southeast Asian countries,6 ,7 whereas water pipe smoking is common in the Middle East and Russia.8 Smokeless tobacco use also contributes to the global disease burden, causing 6 million DALYs lost and a quarter million deaths due to cancers of mouth, pharynx and oesophagus9 and ischaemic heart disease, mostly among men and mainly in Southeast Asia.10
Socioeconomic position is a well-known determinant of health status11 ,12 and socioeconomic inequalities in smoking13 ,14 make an important contribution to mortality differentials by wealth and education.15 ,16 Socioeconomic inequalities in risk factors remain an important public health challenge,17 and quantifying the magnitude of socioeconomic differences in risk factors provides data relevant for policymaking.18 There is solid evidence of socioeconomic inequalities in smoking in HICs,13 ,19 ,20 but for LMICs, most of the evidence21–24 is based on older data from the World Health Surveys (WHS) from 2002/2003.25 Since the social distribution of tobacco use is known to change over time,20 ,26 the existing literature on LMICs may not reflect the current socioeconomic distribution of all forms27 of tobacco use.21–23
Moreover, the literature from LMICs is typically limited to either wealth-related or education-related inequalities in tobacco use. Presently, a comprehensive report on educational and wealth-related tobacco use inequalities using recent, comparable data across LMIC is lacking. Thus, the aim of our study is to provide gender-specific education and wealth-related inequalities in all forms of tobacco use based on the data from most recent Demographic and Health Surveys (DHS).
Methods
Ethics statement
All DHS protocols are approved by the institutional review boards of the DHS programme and participating institutions in each country.28 The respondents were informed of the purpose of the survey, and informed consent was obtained from all the participants.
Data source
The DHS surveys are implemented in over 80 LMICs and survey nationally representative samples of women and men primarily to obtain reliable data on fertility, family planning, health and nutrition, health services utilisation, health knowledge and behaviours.28 ,29 Thus, trained interviewers collected data on standardised questionnaires from eligible men and women aged 15–49 years. In a few countries, men aged up to 54, 59 or 64 years were surveyed. DHS are cross-sectional, house-to-house surveys conducted by incountry/local institutions with funding from US Agency for International Development (USAID) and technical assistance from The DHS programme (Opinion Research Corporation, Macro International, Calverton, Maryland, USA). DHS uses two-stage stratified cluster sampling design, with urban and rural clusters selected by probability proportional to size, followed by a random selection of households within the selected clusters. The details of survey are described elsewhere.28 ,29 The survey years and countries included in this report are given in table 1 and ranged from 2005 (Moldova and Egypt) to 2013 (Nigeria, Namibia, Pakistan and Congo).
Survey characteristics, sample sizes and responses rates for men and women participants of Demographic and Health Surveys
Variables
Tobacco use
Four questions were asked to collect information about tobacco use in all countries. The four questions were: (1) Do you currently smoke cigarettes? (‘yes’ or ‘no’); (2) In the last 24 hours, how many cigarettes did you smoke? (numeric); (3) Do you currently smoke or use any other type of tobacco? (‘yes’ or ‘no’); and (4) What (other) type of tobacco do you currently smoke or use? (options provided were pipe, chewing tobacco, snuff and other country-specific options). The response options were slightly different in some countries. For example, country-specific options such as hookah (sheesha), bidi and cigars (Maldives), hand-rolled tobacco (Timor Leste), bidi (India, Pakistan, Nepal and Bangladesh), cigars (Philippines), pan masala and gutkha (India) and nuswar (Pakistan). Based on the responses to questions 1, 3 and 4, we constructed a binary outcome variable as ‘current tobacco user’, if the respondents replied ‘yes’ to the questions on current cigarette smoking, current smoking of pipe, cigars etc or use any other type of tobacco products such as chewing tobacco, snuff etc. Users of multiple tobacco products were included in current tobacco users and we did not present them separately in our analyses.
Markers and measures of inequality
DHS collects information about household assets, dwelling characteristics and ownership of consumer items. Based on these items, DHS calculates a wealth index to estimate socioeconomic position. The highest educational level of each participant was classified as ‘no education’ (0 years), ‘primary’ (1–5 years), ‘secondary (6–10 years)’ or ‘higher (>10 years, university or vocational education after school)’ based on number of years of schooling. Each participant is given a relative socioeconomic rank and categorised as belonging to one of five country-specific quintiles, where the first quintile is the poorest 20% and the fifth quintile the wealthiest 20%.30 We analysed the data separately for men and women, as it is well known that tobacco use varies by sex worldwide.31
Measuring health inequalities across socioeconomic groups such as education and wealth involves judgements regarding the consideration of population size, reference points for measuring departures from equality32 and the scale of inequality measurement. We report absolute and relative measures of inequality, as these two measures may lead to different conclusions about the magnitude of inequality.33 We used the slope index of inequality (SII) and relative index of inequality (RII), regression-based inequality measures that take into account the size of the population across education and wealth groups.34 We classified the countries as low-income (LIC), lower-middle-income (lMIC) and upper-middle-income (uMIC) countries as per World Bank classification.35
Statistical analyses
For each country, we calculated estimates of overall prevalence and 95% CIs for current tobacco use by category of education and wealth for men and women. For all analyses, we used sample weights to ensure that estimates are nationally representative. To estimate tobacco use inequalities, we calculated the SII and RII using marginal predicted rates of tobacco use.36 ,37 To enable comparison of the tobacco use rates across education and wealth quintiles, for each country and socioeconomic variable, we first calculated ridit scores indicating the cumulative proportion of the population at each socioeconomic level, ordered from lowest to highest.38 Individuals with the same score were assigned the average rank.39 We used logistic regression analyses with tobacco use as the outcome variable and the ridit score as the exposure variables to calculate a coefficient that estimates the difference in log odds of tobacco use for 1-unit change in socioeconomic rank (ie, from the bottom (0) to the top (1) of the socioeconomic scale). We used our model coefficients to estimate marginal predictions and SEs of the smoking rate at the bottom and the top of the socioeconomic distribution, and used linear and non-linear contrasts to calculate SII and RII, respectively.40 The SII is estimated as the expected difference in smoking between the bottom versus the top of the socioeconomic distribution, and RII is the ratio of the same two estimates. Thus, if smoking decreases with increasing socioeconomic position, then SII>0 and RII>1, whereas if smoking increases with increasing socioeconomic position, then SII<0 and RII<1. Finally, we used random effects meta-analysis to calculate pooled estimates of the SII and RII across all countries and within World Bank income groups.35 Random effects meta-analysis treats each survey as a separate estimate and combines them into a summary (weighting each study by the inverse of its variance), assuming that the studies are sampled from a distribution and our analysis is a random sample of possible inequality estimates.21
Results
Table 1 shows descriptive characteristics of surveys included for this analysis. Tobacco use data were measured for 353 516 men and 824 593 women surveyed in 49 and 54 countries, respectively. The overall response rates were above 80% (84–98.9%) in all countries except Zimbabwe (77%). Data on tobacco use, education and wealth index were available in all countries, except a small (<1%) missing data for some tobacco use variables in certain countries. The overall prevalence of any tobacco use by education and wealth categories are presented separately for men (see online supplement 1) and women (see online supplement 2). The overall prevalence varied widely between countries and World Bank income groups. Tobacco use was more prevalent among men than women in all countries. Among men, the highest prevalence of tobacco use was 72.5% in Indonesia and the lowest was 7.3% in Sao Tome and Principe. In women, the corresponding findings were 21% in Madagascar and 0.22% in Tajikistan.
supplementary figure men
supplementary figure women
Educational inequalities
Men
Educational inequalities among men differed considerably across countries within each World Bank income group. In most countries except Niger (RII=0.86), and Kyrgyz Republic (RII=0.79), relative education-related inequalities were >1 (ranging from 1.03 to 11.86), indicating that tobacco use is higher among those with lower education (figure 1). For example, educational RII was nearly 12 in Benin and Ghana, implying that the estimated prevalence of tobacco use differs by a factor 12 between the bottom and the top of the education distribution. The aggregate RII by income group, weighted by inverse variance method, was 3.61 (95% CI 2.83 to 4.61) in LICs, followed by 1.99 (95% CI 1.66 to 2.38) in lMICs and 1.82 (95% CI 1.24 to 2.67) in uMICs (table 2).
Aggregate tobacco use inequalities among men and women by World Bank income groups

Educational inequalities among men.
Absolute educational inequalities for tobacco use among men also varied widely between countries. The SII ranged from −0.03 to 0.58, suggesting that tobacco use is estimated to be up to 58% points higher at the bottom versus the top of the education distribution. Cambodia, Nepal and India showed large inequalities, with a >50% point difference in tobacco use by educational attainment (figure 1). The magnitude of educational inequalities among men increased with decreasing country-level wealth: the SII was 0.30 (95% CI 0.23 to 0.36) in LIC, 0.20 (95% CI 0.11 to 0.29) in uMIC and 0.16 (95% CI 0.11 to 0.21) in lMIC (table 2).
Women
Compared with men, the education-based relative inequality estimates showed greater heterogeneity and were larger in magnitude among women. In many LICs of Africa and South East Asia, the estimate of relative educational inequalities was extraordinarily high because of very low tobacco use among women with secondary and higher education. However, there was a reverse gradient in educational RII (<1) in Moldova, Armenia, Kyrgyz, Albania, Egypt, Bolivia and Peru, where smoking was more common among women with greater education (figure 2). The pooled educational RII for women was 14.49 (95% CI 8.87 to 23.68) in LIC, 3.05 (95% CI 1.44 to 6.47) in lMIC and 1.58 (95% CI 0.33 to 7.56) in uMIC. A similar trend was observed for aggregate absolute educational SII, but the absolute values of SII were much lower than for men (figure 2).

Educational inequalities among women.
Wealth-related inequalities
Men
Among men, cross-country differences in wealth-related inequalities tended to be smaller than for education, as was the overall magnitude of inequality. In most countries, tobacco use inequalities were pro-rich (greater use among the poor). Pro-rich RIIs varied from 1.01 to 10.3 and the SII ranged from 0 to 0.44, implying that the estimated tobacco use rates were up to 44% points greater among the poor. However, tobacco use inequalities were pro-poor in Armenia (RII, 0.88 and SII −0.08) and Kyrgyz Republic (RII, 0.68 and SII −0.20) (figure 3).

Wealth-related inequalities among men.
Aggregate wealth-related RIIs among men were 2.43 (95% CI 2.05 to 2.88) in LIC, 1.84 (95% CI 1.54 to 2.21) in lMIC and 1.67 (95% CI 1.15 to 2.42) in uMIC and the corresponding estimates for SII were 0.21 (95% CI 0.16 to 0.25) in LIC, 0.15 (95% CI 0.07 to 0.24) in lMIC and 0.13 (95% CI 0.08 to 0.18) in uMIC (table 2).
Women
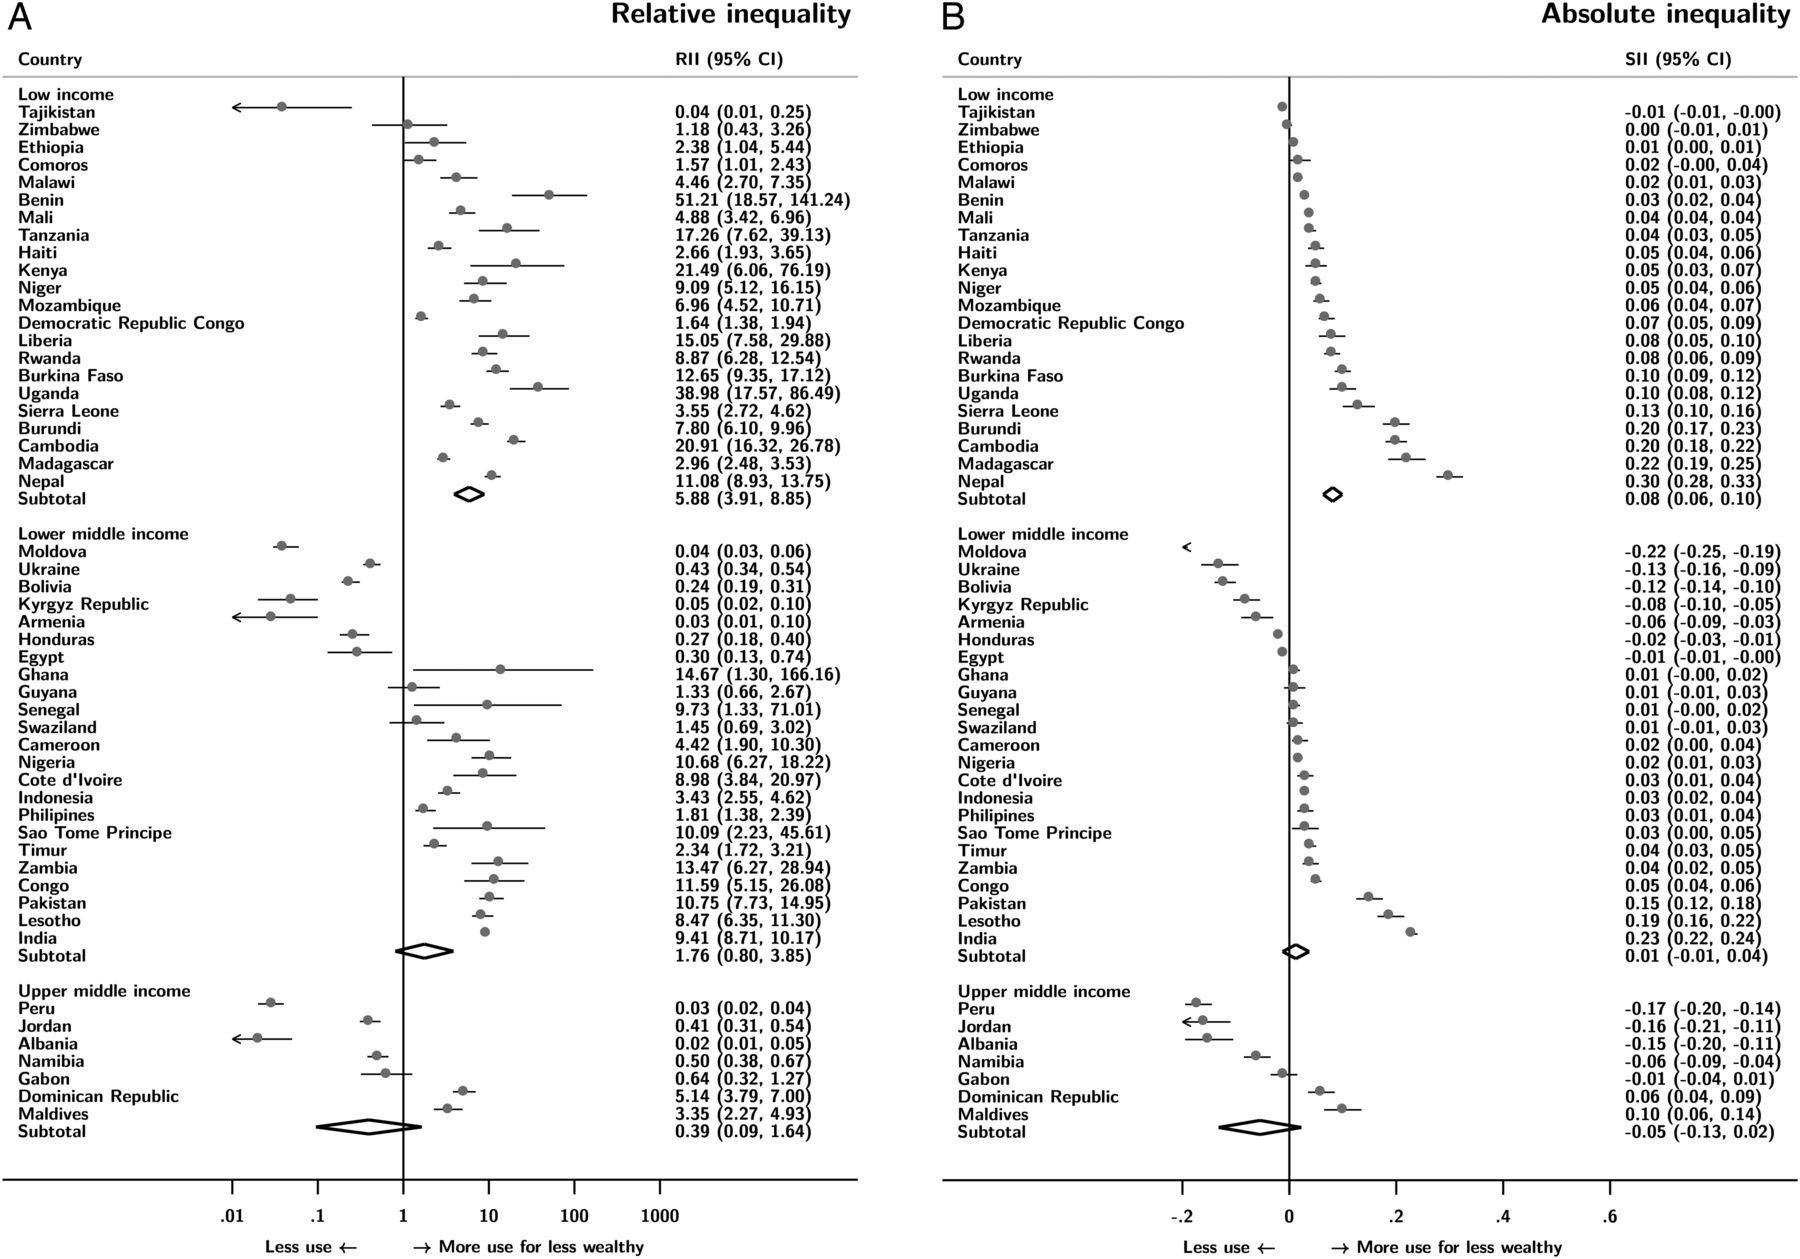
For wealth-related inequalities among women, the RII and SII showed less between-country variation, and the magnitude of inequalities was smaller than for men. However, in many African and South East Asian nations, the RII was 10 or above, indicating wider wealth-related inequalities. In contrast to men, 13 countries had pro-poor wealth-related inequalities among women, primarily from Central Asia, Eastern Europe and Latin America. An aggregate RII was 5.88 (95% CI 3.91 to 8.85) in LIC, 1.76 (95% CI 0.80 to 3.85) in lMIC and 0.39 (95% CI 0.09 to 1.64) in uMIC (figure 4). In most countries, the SII was <0.2 (figure 4), and the aggregate SII was also much lower than for men 0.08 (95% CI 0.06 to 0.10) in LIC, 0.01 (95% CI −0.02 to 0.04) in lMIC and −0.05 (95% CI −0.13 to 0.02) in uMIC.

Wealth-related inequalities among women.
With respect to the patterning of inequalities, we found that, across countries, relative inequalities in tobacco use tended to decrease as the overall prevalence of tobacco use increased, particularly for men. In contrast, absolute inequalities in tobacco use tended to be higher in countries with higher overall prevalence of tobacco use (see online supplementary figures S1 and S2).
supplementary appendix
Discussion
Our analyses of DHS surveys in LMIC showed that socioeconomic inequalities in tobacco use exist in most countries among men and women. Tobacco use inequalities varied widely in terms of magnitude and (to a lesser extent) direction between countries and by World Bank income groups. The pooled estimates by income group suggest that relative and absolute inequalities among men are generally greater when measured by education compared with wealth. Among women, the picture is more mixed. We found higher tobacco consumption among higher educated women in several countries, especially lMIC. However, tobacco use is more prevalent in uMIC and the average relative and absolute inequalities are largest among women from LIC. We observed the same pattern when using wealth as an indicator of socioeconomic position. However, the average relative and absolute inequalities among women in LIC are smaller when social inequalities are measured by wealth compared with education.
In previous studies,21–24 cross-national comparisons of tobacco use inequality among adult men and women were made based on WHS, 2002/2003.25 However, our results based on DHS data that were collected more recently (2005–2013) are broadly similar to WHS-based studies, despite the differences in analyses and measures of inequality. Pampel and Denney24 have reported that increasing national income may widen educational disparities among men. Pampel41 also reported that an inverted ‘U’ shaped (men) and a linear (women) relationship between national income and prevalence of tobacco use using country-level aggregate data. In our study, aggregate educational inequalities were highest in LICs and lowest among uMIC. However, Bosdriesz et al 21 argued that there was a positive educational gradient among older women and a negative gradient among younger women of Europe and Central Asian countries. These pro-poor disparities could be explained by increasing social acceptability of smoking among younger women, growing empowerment of women and economic independence of women in these regions.42 Bosdriesz et al 21 have also reported that strong negative gradients existed among men and women in South-east Asian countries which is similar to our results. Studies by Harper and McKinnon22 and Hosseinpoor et al 23 have reported that smoking inequalities were pro-rich in most countries while pro-poor in some European countries (among women), also similar to our results. Our results are not directly comparable with WHS-based studies, as they used different definitions of tobacco use, different inequality measures and measures of socioeconomic position that are not directly comparable to the DHS. Our DHS-based results follow uniform methodology to enable cross-country comparisons29 and may provide more precise estimates for each country, since the DHS covered nationally representative samples that were larger than WHS sample in each country and the response rates were over 90% in the majority of the 54 LMICs. Though each country was surveyed at various time points, our data are more recent than WHS (2002–2003),25 and are more reflective of the current stage of the tobacco epidemic in most countries studied.
Limitations
The DHS only asks about current tobacco use, so we were unable to provide any estimates of inequalities in more robust lifetime measures of accumulated exposure (eg, pack-years) that are relevant for the burden of disease.43 We did not adjust for covariates (including age) because our interest was in estimating the magnitude of inequality as it currently exists in LMIC, rather than hypothetical estimates holding covariates fixed at arbitrary values. Adjustments for factors such as age could produce different estimates if the patterning of smoking differs by age and socioeconomic position across countries. DHS also relies on self-reports that may have resulted in under-reporting by younger individuals and women due to stigma surrounding tobacco use.44 ,45 Validated measures for self-report of non-cigarette tobacco products are not yet available.46 We studied only 54 countries for which data were available and grouped them by World Bank income categories,35 so our results may not be applicable to all LMIC. We used the World Bank taxonomy, which is based on per capita income, but this crude categorisation does not represent all levels of development.47 Nevertheless, the World Bank taxonomy of LMIC does allow for investigation of tobacco use inequalities across broad levels of economic development. We could not study inequalities in the intensity of smoking as we used ‘any tobacco use’ as main outcome variable and in most countries, the number of cigarettes smoked in last 24 hours was not reported by the majority of the current smokers. Harper and McKinnon22 have reported that inequalities in terms of pack-years of smoking were weaker than for current smoking. We included DHS surveys from 2005/2006 (Egypt and India) onwards, after major tobacco control initiatives were launched in many countries by adopting the WHO's Framework Convention on Tobacco Control (2003).48 However, given our inability to assess trends in smoking inequalities over time, we are unable to draw any inferences on how the tobacco control policies may have affected socioeconomic inequalities in smoking. Katanoda et al 49 recently reported on data from East Asia, one of the world’s largest tobacco epidemic regions, and concluded that many tobacco activities remain unrestricted and prevalent, and that there is an urgent need for the implementation of a set of tobacco policies and public health interventions to reduce the tobacco-related disparities.
Conclusion
Our results suggest that socioeconomic inequalities vary greatly across LMIC, between and within World Bank income categories. A reduction in global inequalities in tobacco use will need action and targets that focus on LMIC where tobacco use is presently high. Tobacco control policies should be implemented with any eye towards not only reducing overall initiation and prevalence, but also to reducing the gap in use between these socioeconomic groups. Further research is needed to understand the association between tobacco use inequalities and environmental measures of tobacco control policy.
What this study adds
Tobacco use patterns change over time. Prior reports on socioeconomic inequalities of smoking in low-and-middle-income countries (LMICs) are outdated and do not reflect the current socioeconomic gradients.
We demonstrate that relative and absolute socioeconomic inequalities of tobacco use vary widely across sex, countries as well as by World Bank categories.
Tobacco control policies in LMICs may have been less successful in reducing social inequalities in tobacco use over the last decade.
The study demonstrates the need for future monitoring of tobacco use in LMICs.
Acknowledgments
The authors thank The DHS Programme for providing us access to data for 54 countries included in this analysis.
References
Footnotes
Contributors CTS, SH and LE conceptualised the study, CTS and SH analysed the data and prepared graphs and tables, LE wrote the results, CTS and SH revised the results and interpretations. CTS wrote the first draft of the manuscript, SH and LE revised the manuscript and finalised the manuscript. All authors read the final manuscript submitted for publication.
Competing interests None declared.
Ethics approval Institutional review boards of the DHS programme and participating institutions in each country.
Provenance and peer review Not commissioned; externally peer reviewed.