Article Text

Abstract
Aim To estimate current clinical practice for frequency of visual field (VF) monitoring in glaucoma in England.
Methods A cross-sectional review of all patients with chronic open angle glaucoma (COAG) attending specialist glaucoma clinics at six hospitals in England was performed. The number of VF tests undertaken prior to the study date and during the first 2 years since diagnosis were recorded and compared with European Glaucoma Society (EGS) guidelines for newly-diagnosed patients. Clinician-requested monitoring intervals were compared with intervals from the National Institute of Clinical Excellence (NICE) guidelines, and the relationships with disease severity, intraocular pressure (IOP) and glaucoma progression status were reviewed.
Results One-hundred and four patients with COAG were included. 73 patients had at least 2 years of follow-up. Median (IQR) total number of VF tests and in the first 2 years of diagnosis were 4 (2–7) and 2 (2–3), respectively. No patients met EGS guidelines, but 87% of patients had their monitoring intervals requested in accordance with NICE guidelines. These intervals were not related to disease severity or VF stability (Kruskal–Wallis test, p=0.25) but shortened significantly when IOP control was inadequate or when the overall clinical impression was disease progression (p<0.001).
Conclusions Most newly-diagnosed COAG patients receive less than three VFs in the first 2 years following diagnosis and an average of 0.7 VF per year over the duration of follow-up.
- Glaucoma
- Field of vision
- Public health
Statistics from Altmetric.com
Introduction
Patients with chronic open angle glaucoma (COAG) represent a major workload of hospital eye services.1 ,2 The guidelines for glaucoma published by the National Institute of Clinical Excellence (NICE) in the UK highlighted the lack of evidence about how patients with the condition should be monitored over time.3 The NICE Guideline Development Group made a few important recommendations for essential future research, including the urgent need to establish the clinical-effectiveness and cost-effectiveness of using different monitoring strategy in patients diagnosed with glaucoma.3
The aim of glaucoma management is to reduce or halt visual loss and preserve the patient's quality of life. Monitoring patients’ visual field (VF) to detect functional progression should be a key element of that clinical management. Ideally, any VF progression should be ameliorated to a rate which is compatible with a sighted lifetime without significant disability. Rates of VF progression often vary widely between patients and timely detection of progression requires accurate and consistent measurements of VFs over a period of years.4 ,5 The European Glaucoma Society (EGS) recommends that all newly-diagnosed glaucoma patients should be tested three times per year during the first 2 years in order to establish the rate of VF loss at an early stage.6 These ‘ideal’ monitoring intervals are supported by results from studies using statistical modelling, computer simulation or retrospective assessment of large VF databases.7–9 In particular, Chauhan and colleagues published practical recommendations for measuring rates of VF change in glaucoma patients based on empirical data and statistical modelling; they concluded that three examinations per year are required to identify an overall change in mean deviation (MD) of 4 dB over 2 years in a patient with average VF variability.9
There is a strong rationale for frequent monitoring to detect the rapidly progressing patient because, from a healthcare planning perspective, the cost of glaucoma management increases considerably with the severity of visual loss.10 ,11 Meanwhile, with a significant number of patients having stable treated disease, there are potential cost implications by performing a greater number of tests than are necessary. With the current incidence of COAG estimated to be approximately 9000 new cases per year (excluding glaucoma suspects or those with ocular hypertension),3 valuable resources could be redistributed by optimising the monitoring guidelines to maintain disease stability; however, this could be offset by reduced statistical sensitivity to detect VF progression, which may in turn lead to disease worsening and treatment escalation. This fine balance is further complicated by what is achievable with the resources currently available.
The aim of this multi-centre cross-sectional study was first to ascertain the current practice of VF testing for monitoring patients with glaucoma in England and, second, to evaluate this practice in relation to EGS and NICE guidelines. The results are valuable for healthcare providers and represent an important starting point for research on optimising VF testing in newly-diagnosed patients.
Materials and methods
Six hospitals in England were identified to ensure good geographic coverage and even representation from district secondary units and tertiary centres: Calderdale and Huddersfield NHS Trust, Gloucestershire Hospitals NHS Trust, Norfolk and Norwich University Hospital NHS Trust, North Middlesex University Hospital NHS Trust, Southport and Ormskirk NHS Trust, and Portsmouth Hospitals NHS Trust. Consultant ophthalmologists with a subspecialist interest in glaucoma from each of these units were invited to participate in the study, and all invitees agreed to take part.
All patients with COAG seen in specialist glaucoma clinics during the last week of January 2012 were included in the study with their case records reviewed retrospectively. Patients were excluded from the study if they had undergone laser or ophthalmic surgery within 6 months prior to the day of their clinic visit.
Data including patient demographics, best corrected visual acuity (BCVA), stage of disease, intraocular pressure (IOP), frequency of VF testing (number and interval of tests) and planned monitoring interval were recorded using a standardised pro forma that was first piloted in each hospital before the final amended version was used. Some units had used Snellen visual acuity to record BCVA, while others had used logMAR charts. For consistency, all Snellen BCVAs were converted into approximate logMAR equivalents to aid analysis.
The clinician's opinion on IOP stability, the clinical interpretation of VF, optic nerve head appearance and overall disease stability were also collected, with the possible responses collated in table 1. Investigators were either specialist trainee doctors or optometrists, and written instructions about the pro forma were given to ensure the data collected were similarly detailed. To avoid altered behaviour of assigning intervals during the study, staff members at each hospital were unaware that the study was being conducted.
Parameters recorded regarding the intraocular pressure (IOP) level and glaucoma progression status at the study visit
Anonymised data were collated and analysed by the main investigators (SF, CL). The Humphrey Field Analyser (Carl Zeiss Meditec, California, USA) MD (mean deviation; dB) was used as an estimate of a patient's VF defect severity. MD is a standard age corrected clinical measure of the overall severity of VF loss with more negative values indicating greater VF loss. Patients were also classified into different stages of disease based on the Canadian Ophthalmological Society Glaucoma (COSG) Guidelines,12 with early disease defined as vertical cup to disc ratio ≤0.65±mild VF defect; moderate disease as vertical cup to disc ratio 0.7–≤0.85 or VF defect not involving 10° of fixation; and advanced disease as vertical cup to disc ratio >0.9 and/or VF defect within 10° of fixation. For ease of comparison, data were analysed based on worse eye status for each patient, that is, if the right eye (RE) of a patient had a higher IOP and more advanced disease than their left eye (LE), the data of their RE were used in analyses on the basis of IOP status. The monitoring interval was defined as the time assigned to the next VF examination (with or without optic nerve head examination); if a VF test was not specifically booked, it was assumed that the next recorded appointment would include a VF test.
Statistical analyses were carried out using R (Foundation for Statistical Computing, Vienna, Austria). The non-parametric Kruskal–Wallis test was used to compare data from different groups, with statistical significance defined as p<0.05. This study was reviewed by the Research and Ethics committee at each hospital and is compliant with the Declaration of Helsinki. We certify that all applicable institutional and governmental regulations concerning the ethical use of human volunteers were followed during this research.
Results
Demographics
A total of 104 patients were included in this study; 54% were women. The median (IQR) age was 77 (70–84) years. The median (IQR) time in attendance at the glaucoma clinic for COAG was 5.5 (2.0–11.4) years, with 73 patients having at least 2 years of follow-up. The number of patients from each individual centre (after excluding glaucoma suspects, ocular hypertensives, secondary glaucoma and those with recent intraocular surgery) were as follows: 13 patients from Calderdale and Huddersfield NHS Trust; 20 from Gloucestershire Hospitals NHS Trust; 19 from Norfolk and Norwich University Hospital NHS Trust; 17 from North Middlesex University Hospital NHS Trust; 31 from Southport and Ormskirk NHS Trust; and four from Portsmouth Hospitals NHS Trust.
Data for RE and LE were comparable, including BCVA (mean±SD: RE 0.23±0.34 logMAR; LE 0.18±0.25 logMAR), VF MDs (RE −6.3±8.2 dB; LE −7.4±7.9 dB) and IOP (RE 15.4±3.5 mm Hg; LE 15.5±4.1 mm Hg). The disease status (COSG guidelines) was also comparable between eyes: in the RE and LE, respectively, 28 and 32 cases were at early stages; 51 and 43 were at moderate stages; and 25 and 27 at advanced stages (two patients had lost sight in the LE).
Worse eye characteristics are listed in table 2. One patient had no follow-up details recorded and was excluded from further analysis. Overall, 84.5% (87/103) of patients did not have changes to their treatment after the study visit; 15.5% (16/103) had medications adjusted; and 1.9% (2/103) were listed for surgery.
Characteristics of patients with chronic open angle glaucoma.
Frequency of VF testing
The median (IQR) total number of VF tests per person since diagnosis was 4 (2–7), which equates to 0.7 VF tests per year over the average 7.2 years of follow-up. The median (IQR) number of VFs in the first 2 years since diagnosis was 2 (2–3), ranging from 1 to 5 tests (figure 1A). The number of patients diagnosed with COAG before publication of the NICE guidelines (pre-2009) was 69, while 35 patients were diagnosed in, or after, 2009. Reviewing the VF history, among patients who had at least six tests during their entire follow-up (n=39), the median (IQR) duration to achieve this was 4.6 (3.7–6.0) years, ranging from 2.2 to 17.5 years (figure 1B). No statistically significant relationship was found (using the Kruskal–Wallis test) between the number of VFs performed and disease stage (early, moderate, advanced), adequacy of the IOP control (adequate, inadequate, not recorded), VF stability (stable, progressing, unsure, not recorded), optic disc appearance (stable, progressing, unsure, not recorded) or overall stability of the conditions (stable, progressing, unsure, not recorded) (table 3).
Median number of visual field (VF) tests by disease severity and intraocular pressure (IOP)

Visual field (VF) testing. (A) The number of VF tests performed for the first 2 years in patients with minimum follow-up of 2 years; (B) The time taken for patients to receive six VF tests.
Monitoring intervals
Two patients were arranged to undergo surgery (one trabeculectomy and one cataract surgery), and thus they were excluded in this part of analysis. A total of 59 patient records contained details for the time to the next VF examination while 43 records specified only the time interval to the next appointment. The overall median (IQR) monitoring interval requested at the study visit was 7.5 (3.8–8.0) months. In all, 84.5% of patients had no changes made to their management. When patient outcomes were considered according to NICE recommended monitoring intervals for complete examination (ie, including VF testing and optic nerve head examination), 88/101 patients (87.1%) were guidance compliant. Among the patients with non-compliant outcomes, five of them had longer than recommended interval for IOP monitoring, three had longer than recommended VF monitoring interval while another three patients had shorter VF monitoring intervals than NICE recommendations.
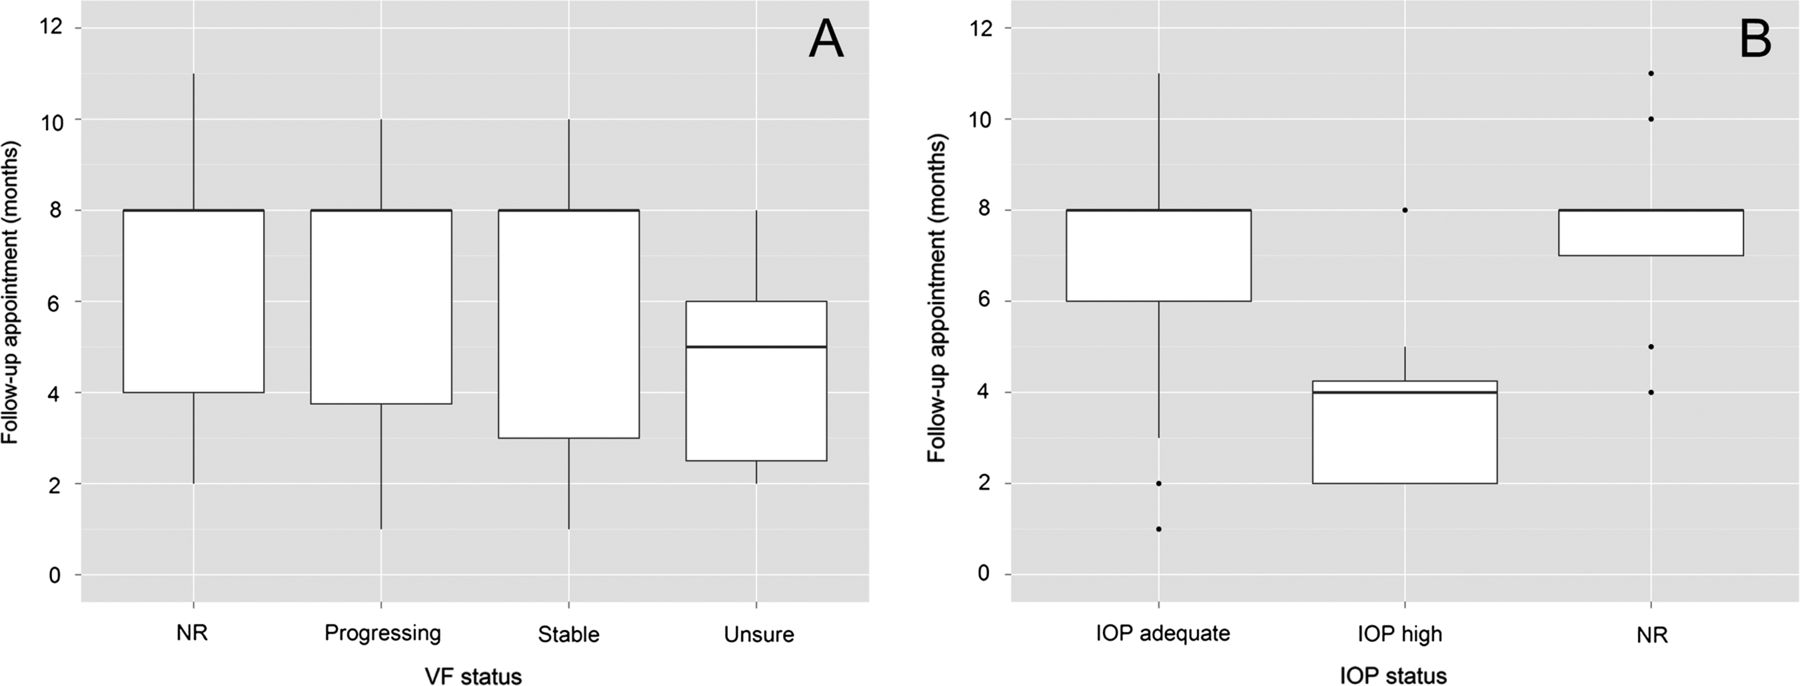
No relationship was found between stability of VF defects (Kruskal–Wallis test, p=0.25) and the monitoring interval requested. The severity of disease also had no influence on the monitoring interval requested (Kruskal–Wallis test, p=0.40). The median (IQR) monitoring intervals requested for early, moderate and advanced glaucoma were 7 (3–8), 8 (4–8) and 8 (4–8) months, respectively; while the median (IQR) intervals requested were 8 (3–8) months for stable VF defects, 8 (4–8) for progressing VF defects, 5 (3–6) for uncertain VF progression and 8 (4–8) months for those with no comments on VF status (figure 2A).
Patient monitoring in relation to clinical findings. (A) Box plot of intraocular pressure (IOP) (with or without optic nerve head examination) monitoring intervals by glaucoma progression status; (B) Follow-up interval by IOP status. (Horizontal lines represent medians. Boxes represent 25% and 75% quartiles. Each whisker extends 1.5 times the IQR; outliers are represented by dots.) NR, not recorded.
In contrast, monitoring intervals were significantly shortened when patients had inadequate IOP control or when the overall clinical impression was disease progression (p<0.001 and p<0.001, respectively). The median (IQR) monitoring intervals were 8 (3–8) months for patients with adequate IOP control, 4 (2–5) for those with inadequate IOP control and 8 (7–8) for patients with no comments on IOP control (figure 2B). For the overall impression of disease status, the median IQR) monitoring intervals were 8 (4–8) months for stable patients, 4 (2–5) months for patients with disease progression, 6 (4–6) for those with uncertain status and 6 (5–8) for those with no comments on overall status.
Discussion
This multi-centre cross-sectional study shows that no patients received the frequency of VF testing recommended by Chauhan et al9 and the EGS guidelines (six VFs in the first 2 years). Typically, patients had two to three VF tests in the first 2 years following diagnosis. The median time for six VF tests to be undertaken was more than 4 years. Frequent VF tests after initial diagnosis help to detect VF changes, and could determine the speed of disease progression in each individual patient, which subsequently allows the management to be appropriately tailored.6 It is important to note that the speed (rate) of VF progression varies widely between patients and timely detection of progression requires accurate and consistent measurement of VFs over years. Notably, the frequency of VF testing suggested by the EGS guidelines6 and Chauhan et al9 aims to determine, with good certainty, rapidly changing eyes (MD <−2 dB/year). Therefore, patients with slower progression will not be identified as quickly (at the same statistical power).
For monitoring patients with glaucoma, the clinician's aim is to try and maintain patients’ visual function during their lifetime. Risk of visual impairment depends on the stage of disease at presentation, the life expectancy as well as the rate of visual deterioration.13 ,14 Clearly, patients with rapid VF progression are at greater risk of suffering blindness than patients with slow progression; hence, one method to identify those patients who require the most attention is to calculate their rates of VF loss over time. Significantly, recommendations of Chauhan et al9 do not incorporate information about a patient's level of VF damage at presentation, which is an equally important consideration when trying to ensure that a patient's visual function remains unaffected. Considering treatment and monitoring costs, it is imperative that resources are prioritised in favour of those patients who are in the greatest danger of suffering visual disability in their lifetime.14
A significant finding of the current study was the observation that the value of VF test results for assigning future VF intervals to clinicians seems limited. Our results suggest that overall clinical impression is driven by the adequacy of IOP control rather than VF test findings. IOP control is a modifiable risk factor for disease progression and, therefore, it requires careful surveillance. Nevertheless, perimetry is the only direct method for monitoring functional change in patients. Therefore, it is surprising that no relationship was found between stability of VF defects, or the severity of disease, and the monitoring interval requested. While recommended monitoring intervals were considered as NICE compliant, VF intervals were variable for a given level of disease severity. The low frequency of VF testing in newly-diagnosed patients observed in this study, at first, seems at odds with the statistic that 87% of decisions on monitoring intervals were compliant with NICE guidance. There is insufficient evidence to conclude which guidelines, EGS or NICE, are likely to be most appropriate, but more research is necessary to establish the clinical-effectiveness and cost-effectiveness of the recommendations. Furthermore, unlike the EGS guidelines, the exact NICE monitoring interval depends on the disease severity and IOP relative to target IOP. So, for patients with stable disease and adequate IOP, annual monitoring is within NICE guidelines. Further, the intervals given by NICE are fairly wide, so that the permitted interval spans 2–6 or 6–12 months. An earlier single-centre study by Tatham and Murdoch also found that assigned intervals were in accordance with NICE guidance.15
It is important to note that the current NICE guidelines have been unable to identify any evidence with sufficient quality about the role of VF testing in glaucoma monitoring; this study therefore provides important data on current UK practice of VF monitoring. These data are useful for healthcare planning for improving hospital resources. It is presumed that the current rate of VF testing is consistent with the VF capacity of hospital glaucoma outpatient services in terms of cost and staff restrictions. Increasing the number of VFs from the current practice to meet EGS guidelines would require an approximately threefold increase in the number of VFs for newly-diagnosed patients in the first 2 years, yet there is no evidence for whether the EGS guidelines are feasible with the resources available. For example, if resources are to be diverted, what is the detriment to other patients whose VF test frequencies would become even less frequent? This represents an important health service delivery research and health-economic question given the large number of patients being monitored. Some work on these issues is currently being undertaken.16 Furthermore, other studies have investigated other types of VF follow-up schemes which may be more efficient.17 ,18
This retrospective study has its limitations. It is assumed that the six units sampled are representative of national practice. Being a cross-sectional study, sampling bias is an inherent issue. Further, for each centre the patients sampled during the study week are assumed to be representative of the general population of COAG patients seen in that unit. The number of patients from Portsmouth was only four, which is not comparable with other participating centres. However, out of the 32 patients seen in Portsmouth during the study week, 28 patients did not meet the study inclusion criteria (17 had a diagnosis other than COAG and 11 had recent intraocular surgery). Although the purpose of our study was not to draw comparisons between participating hospitals, this unequal sampling across units could bias our results. It is also worth noting that patients requiring more intensive control are more likely to be included in the study, and so there are likely to be a higher proportion of patients with poor IOP control (and advanced glaucoma severity) than those with adequate IOP control in the study population. However, this is likely to make the sample representative of the distribution of patients (in terms of proportions with different IOP control and disease severity) seen in the clinic annually.
Data were collected on patients since initial diagnosis and the additional assumption has been made that clinical practice, in terms of monitoring intervals, has remained unchanged during this time. In addition, clinical note taking was often poor or incomplete; several patient records contained no comments on adequacy of IOP control, VF status or overall disease status. Inevitably with any retrospective analysis of patient records it is difficult to draw certain conclusions since notes are often made by multiple clinicians, with varying levels of expertise. Where available, the clinician's comments regarding optic disc and/or VF progression were assumed to be documented and an accurate representation of the patient's clinical state in each case.
In conclusion, this study shows that the number of VF tests performed in newly-diagnosed COAG patients in the first 2 years of follow-up is much lower than the recommended number suggested by current research and EGS guidelines. On average, less than one VF test was performed per year over the duration of follow-up in the patients captured by this cross-sectional study. Monitoring intervals for the majority of patients were in compliance with NICE glaucoma guidelines, although the importance of VF testing on monitoring intervals is limited. Further studies to determine the effect of VF testing intervals on patient outcomes and cost-effectiveness are required.
Acknowledgments
The authors would like to thank David Crabb's co-investigators on the NIHR Health Services and Delivery Research programme of work (project number 10/2000/68): David Garway-Heath (NIHR Biomedical Research Centre for Ophthalmology, Moorfields Eye Hospital Foundation NHS Trust and UCL Institute of Ophthalmology London), Carol Bronze (Patient, Moorfields Eye Hospital Foundation NHS Trust) and Rodolfo Hernandez (University of Aberdeen). The authors would also like to thank Adam Hustler, Alexander Silvester, Anas Injarie, Kate Doorduyn and Samiksha Fouzdar Jain for their effort during data collection of this study.
References
Footnotes
-
Contributors SSMF: conducting and reporting the work. CL: planning and reporting the work. RAR: analysing the data, writing and reviewing the manuscript. RM: analysing the data, writing and reviewing the manuscript. DPC: conceived the idea, writing and reviewing the manuscript and is the guarantor. Adam Hustler, Alexander Silvester, Anas Injarie, Kate Doorduyn and Samiksha Fouzdar Jain: data collection.
-
Funding This work was funded by the UK National Institute for Health Research (NIHR) Health Services and Delivery Research programme (project 10/2000/68). RAR and RM received a proportion of their funding from the Department of Health's NIHR Biomedical Research Centre at Moorfields Eye Hospital NHS Foundation Trust and UCL Institute of Ophthalmology. The views expressed are those of the authors and not necessarily those of the NHS, the NIHR or the Department of Health.
-
Competing interests
-
Ethics approval Research and Ethics Committee at Calderdale and Huddersfield NHS Trust, Gloucestershire Hospitals NHS Trust, Norfolk and Norwich University Hospital NHS Trust, North Middlesex University Hospital NHS Trust, Southport and Ormskirk NHS Trust, and Portsmouth Hospitals NHS Trust, United Kingdom.
-
Provenance and peer review Not commissioned; externally peer reviewed.