Article Text

Abstract
Aim: To assess fundus autofluorescence (AF) for differential diagnosis of macular pseudoholes (MPH) and lamellar macular holes (LMH) evaluated by optical coherence tomography (OCT) as the “gold standard”.
Methods: The files on 50 eyes of 46 consecutive patients diagnosed by OCT as having a foveal defect with residual retinal tissue at the bottom were reviewed. Retinal thickness was measured at the foveal centre and 750 μm temporally and nasally to differentiate further MPH and LMH. The corresponding corrected AF images were then evaluated. Eyes with either macular pucker or stage 1a impending macular hole served as controls.
Results: OCT measurements allowed the classification of two different profiles: 28 eyes classified with MPH had macular centres and perifoveal retinas that were significantly thicker than the 22 eyes classified with LMH. The corrected value of the foveal AF intensity was not significantly different between the two groups. In addition, the AF did not correlate with the thickness of the retinal tissue at the base of either MPH or LMH eyes. None of the control eyes showed foveal AF.
Conclusions: The findings suggest that OCT data must be interpreted with caution when differentiating between MPH and LMH. In this series, the two groups showed similar foveal AF. AF imaging may add useful information to the differential diagnosis of MPH from LMH: the presence of foveal AF is consistent with a loss of foveal tissue and therefore a diagnosis of LMH.
Statistics from Altmetric.com
In the presence of a foveal defect with relatively well-preserved visual acuity, the question arises of whether we are dealing with macular pseudoholes (MPH) or lamellar macular holes (LMH). The pathogenesis of each is different from the other. MPH are macular lesions that have the appearance of macular holes, but with no loss of foveal tissue. They are attributable to the centripetal contraction of an epiretinal membrane and may be stable. The visual acuity of patients with MPH is usually preserved.1 In contrast, LMH are the result of an abortive process in the formation of a full-thickness macular hole. Clinically, the patient also has relatively well-preserved visual acuity, usually 20/40 or better, and the macula contains a stable, round, and well-circumscribed reddish lesion, but with loss of foveal tissue.2–9
Optical coherence tomography (OCT) evaluation has become useful in the diagnosis of macular holes as it is able to visualise retinal anatomy with near-microscopic resolution (≈10 μm). Although OCT studies have added valuable information regarding the definition, pathogenesis and progression of macular holes,4–8 the differential diagnosis between MPH and LMH is unclear. In particular, when there is residual retinal tissue at the bottom of the foveal defect, as occurs with OCT classification stage 2 according to Azzolini et al,7 OCT imaging cannot determine with certainty whether or not there is loss of retinal tissue. In this case, the diagnosis of MPH or LMH is often a matter of speculation. Haouchine et al9 defined new criteria for the OCT diagnosis of LMH, and Witkin et al10 further expanded this topic using ultra-high-resolution OCT, a not yet commercially available technology capable of ≈3 μm axial image resolution in the human eye. However, the definition of LMH or MPH with OCT imaging remains controversial.
Fundus autofluorescence (AF) derives from the lipofuscin-laden retinal pigment epithelium.11 It is generally accepted that lipofuscin represents the product of degradation of photoreceptor outer segments. In a normal fundus, the distribution of AF is diffuse, with decreased intensity at the optic nerve head, under the retinal blood vessels which appear dark, and at the macula.11 12 Macular AF is attenuated by the luteal pigment, and the concentration of this pigment in the fovea is most dense along the outer plexiform layer (fig 1).13 Any foveal defect, including LMH which spare the photoreceptors,10 may alter the degree of foveal AF by decreasing the amount of masking macular pigment, and therefore increasing the foveal AF. In vivo imaging of AF can be performed with commercially available confocal scanning laser ophthalmoscopes.12 The usefulness of this technique has already been demonstrated for the diagnosis of full-thickness macular holes, and its accuracy has been reported as comparable to that of fluorescein angiography.14 15

The aim of this study was to assess the clinical information given by AF in the differential diagnosis of MPH and LMH evaluated with OCT as the “gold standard”.
PATIENTS AND METHODS
We retrospectively reviewed OCT and AF images of 50 eyes of 46 consecutive patients suspected of having a macular hole or an impending macular hole on the basis of clinical examination between January 2004 and June 2006 at our institution. On examination by OCT (Stratus OCT; Carl Zeiss Meditec, Inc, Dublin, California, USA), each was diagnosed as having a stage 2 idiopathic macular hole with residual retinal tissue at the bottom of the foveal defect,7 and the presence of a full-thickness macular hole was ruled out. Data were accumulated with approval from the local institutional review board, informed consent was obtained from each subject, and the study adhered to the tenets of the Declaration of Helsinki as revised in Tokyo and Venice. In every patient, six radial macular OCT scans of 6 mm length each were acquired at angles separated by 30° intervals, the standard Stratus OCT imaging protocol. The scans were centred on the fixation point. After OCT imaging was completed, all images were corrected for axial motion using standard re-registration algorithms. The stage 2 holes were further classified as MPH or LMH according to OCT profiles established by Haouchine et al.9 Retinal thickness was measured manually, using software callipers, at the foveal centre and 750 μm temporally and nasally from the centre. Mean values were determined from horizontal and vertical scans. For MPH, the OCT profile was a steepened contour with increased perifoveal retinal thickness and normal or slightly increased centrofoveal thickness. For LMH, the OCT profile was an irregular contour, with near-normal perifoveal thickness and thinner than normal centrofoveal thickness.
After OCT image analysis, the corresponding AF images were then evaluated. AF imaging is part of the standard examination of patients with macular disease at our institution. For the patients in this study, images were recorded with a confocal scanning laser ophthalmoscope (Heidelberg Retina Angiograph, HRA classic; Heidelberg Engineering, Dossenheim, Germany). To enhance image contrast compared with non-confocal images, a small pinhole aperture suppressed light originating from outside the focal plane. An argon blue laser (488 nm) was used for excitation. Emitted light was detected above a 500 nm barrier filter. To amplify the AF signal, several images were aligned, and a mean image was calculated after detection by the dedicated image analysis software of the instrument. As this image showed an artificial AF intensity, we defined the foveal AF as the ratio of the AF intensity at the site of the macular defect to a reference point located in the most autofluorescent area at 7° or more from the fovea (1000 pixel-box, median value). The ratio between the two measurements provided the corrected value of the foveal AF intensity.
A group of 20 consecutive patients (20 eyes) with a diagnosis of macular puckers (four eyes) and stage 1a impending macular holes on OCT examination (16 eyes) served as controls.
Clinical data were expressed as mean (SEM) and analysed (StatGraphics; Statistical Graphics Corp, StatPoint Inc, Herndon,Virginia, USA) by analysis of variance for comparison of continuous variables. Linear regression was used to assess the correlation between intensity of foveal AF and thickness of retinal tissue at the base of MPH and LMH.
RESULTS
Of the 50 eyes with stage 2 macular holes on Stratus OCT examination,7 28 were classified as MPH and 22 as LMH.
For patients with MPH, the fovea was always characterised by a steepened contour, and the centrofoveal mean thickness was 143.1 (23.6) μm (range 104–192 μm; table 1). The mean perifoveal retinal thickness was 338.8 (40.6) μm on the nasal side and 345.9 (55.0) μm on the temporal side. For patients with LMH, the fovea was always characterised by an irregular contour, and the mean centrofoveal thickness was 116.4 (15.9) μm (range 93–157 μm; table 1). The mean perifoveal retinal thickness was 281.9 (24.7) μm on the nasal side and 275.8 (31.6) μm on the temporal side. The macular centre was significantly thinner in LMH than in MPH (p<0.001, table 1). The perifoveal retina was also significantly thinner on both the nasal and the temporal sides in LMH than in MPH (p<0.001, Table 1).
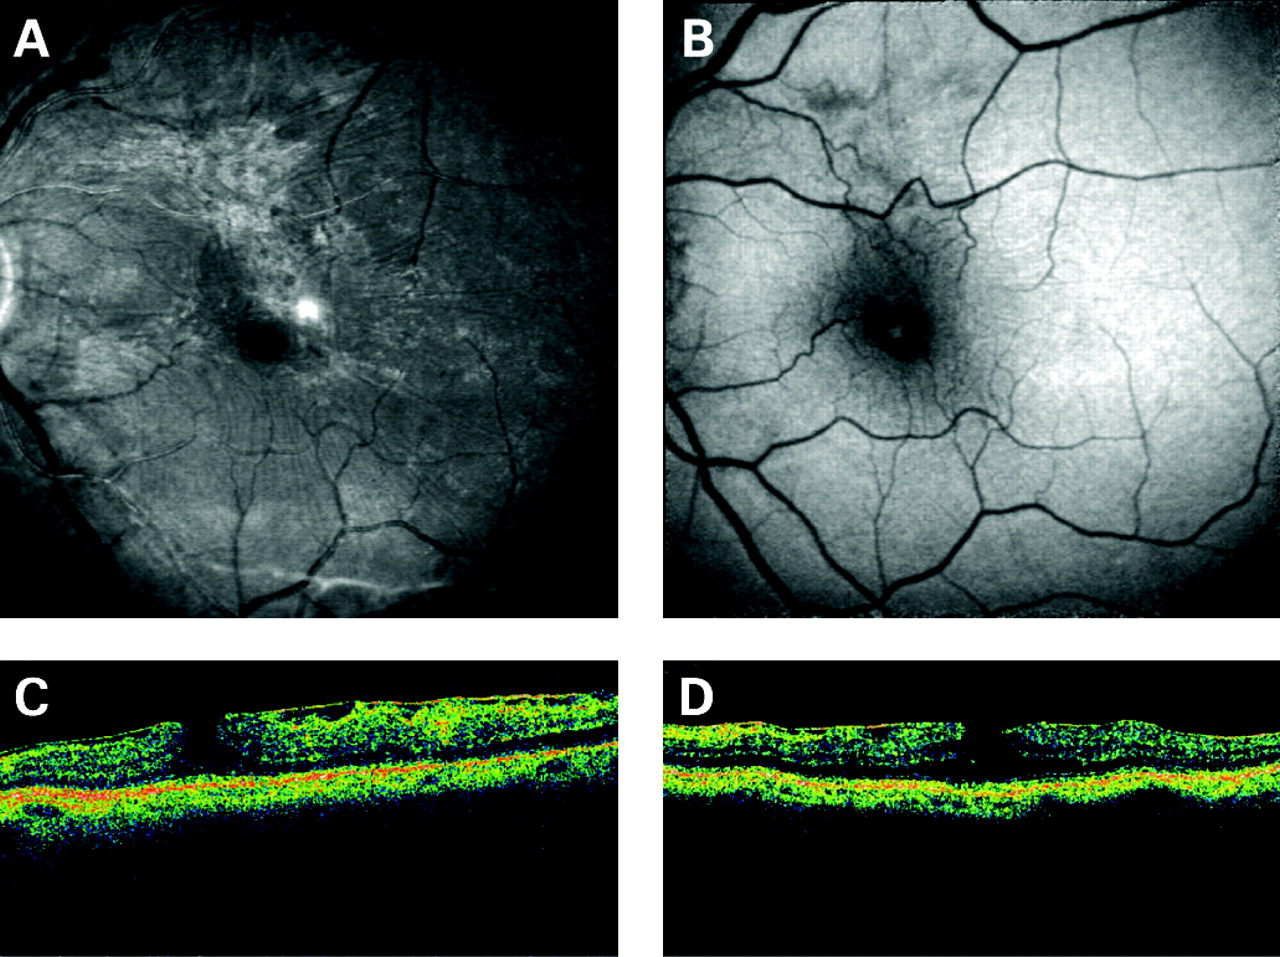
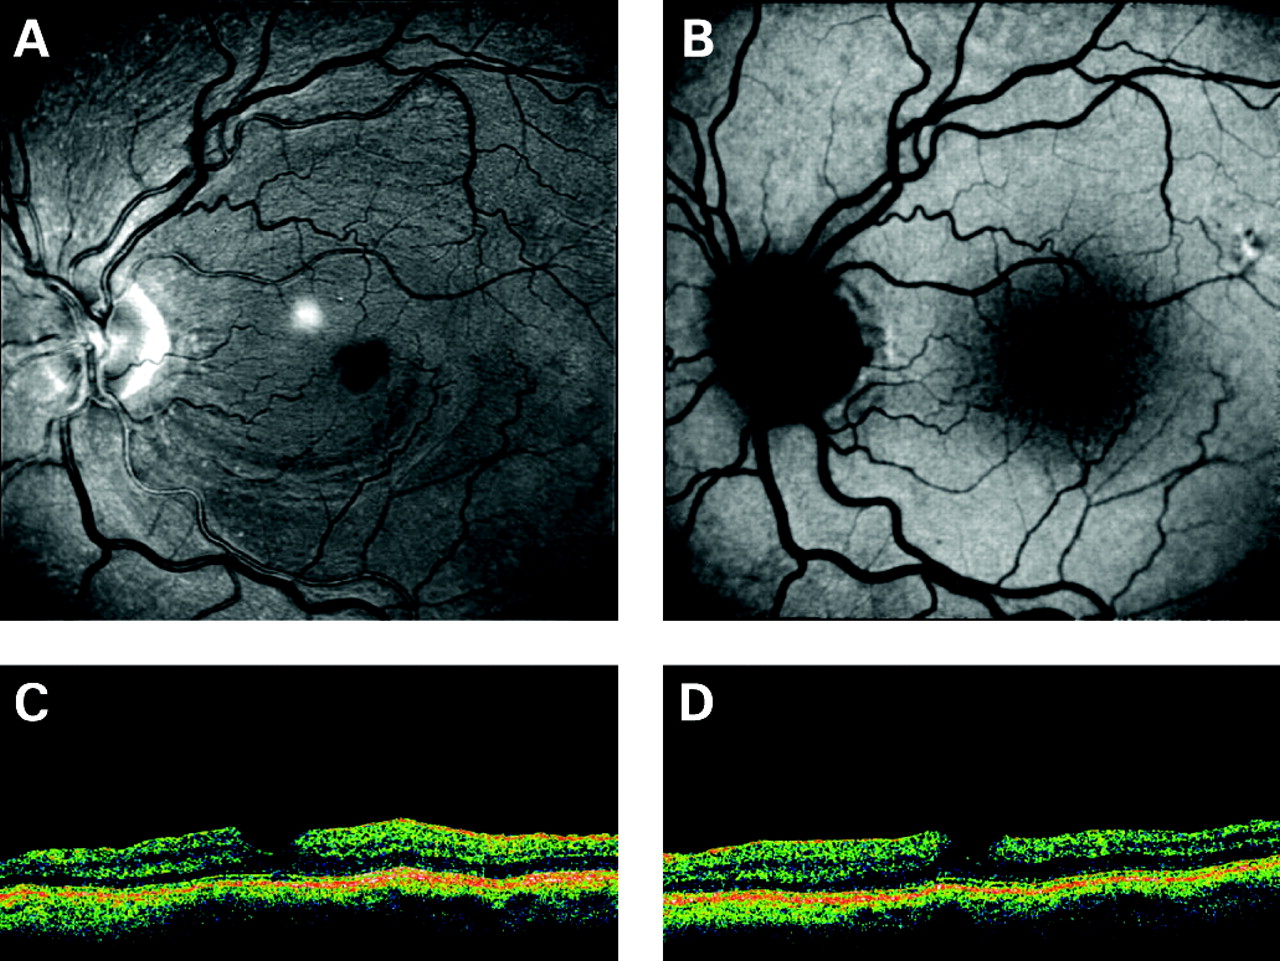
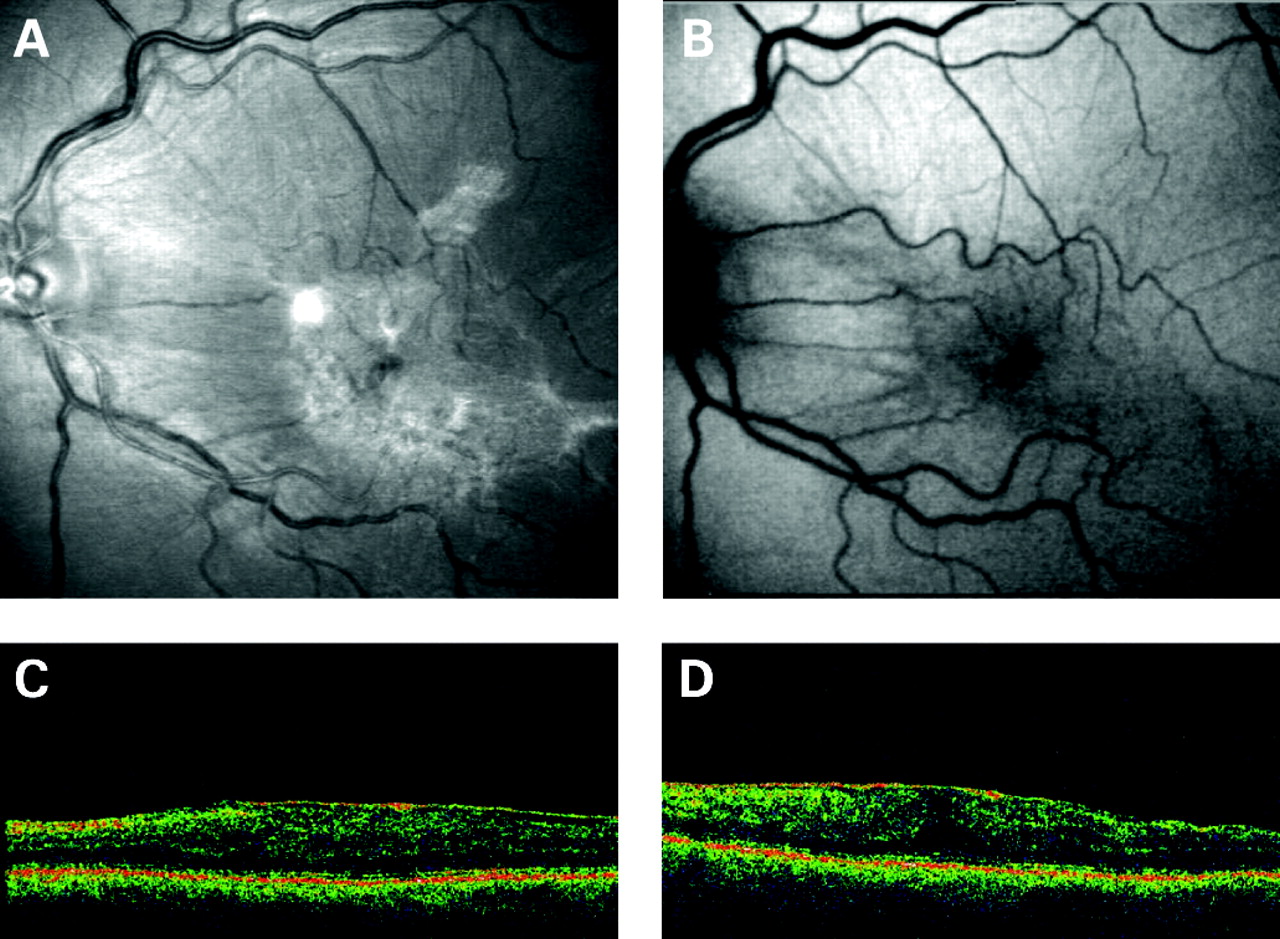
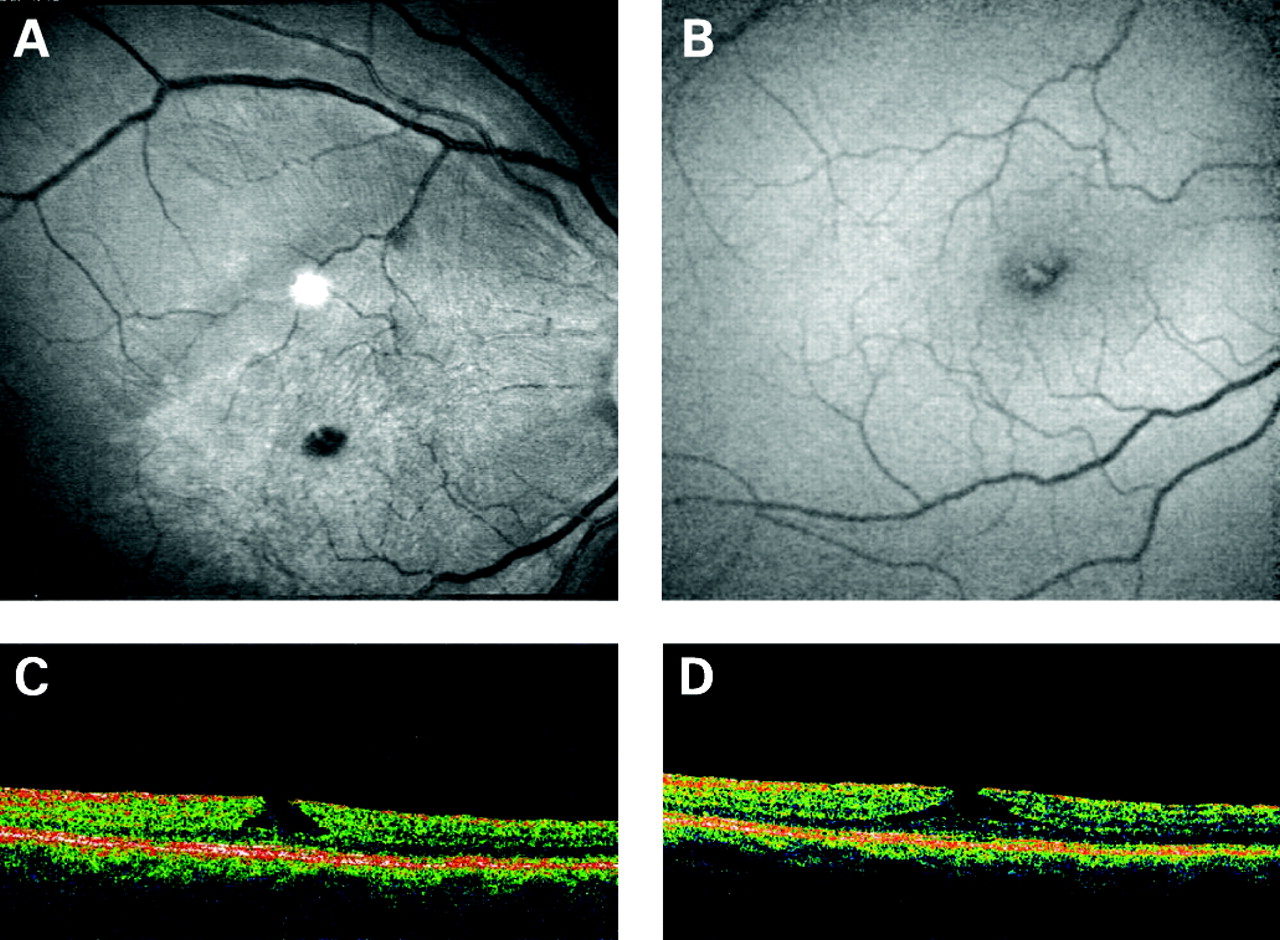
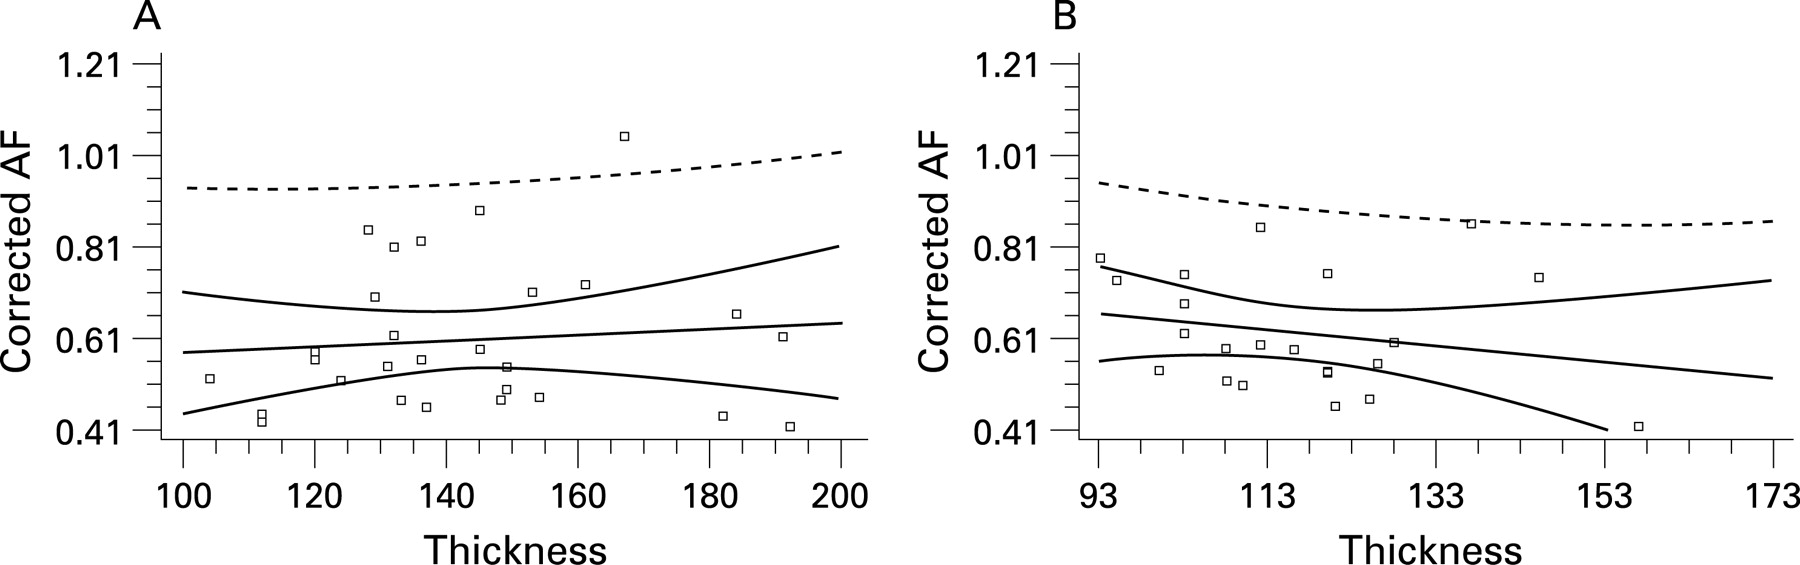
The corrected value of the foveal AF intensity for MPH was 0.606 (0.03), which was not significantly different from the LMH of 0.622 (0.03) (fig 2). Every case showed some degree of foveal AF (figs 3–5), whereas none of the 20 eyes in the control group did (figs 6 and 7). In addition, there was no correlation between the amount of corrected foveal AF and the thickness of the retinal tissue at the base of eyes classified as either MPH or LMH (LMH, r = −0.21; MPH, r = 0.09; fig 8).


DISCUSSION
By definition, MPH represent lesions that have the appearance of macular holes, but which do not have a loss of foveal tissue. To determine the differential diagnosis between MPH and LMH, we must assess if there is loss of tissue or not. Functional tests are not very useful for this purpose. The Watzke–Allen test16 is negative in both cases, with no scotoma being detected on scanning laser ophthalmoscope microperimetry,17 and both conditions lead to similarly impaired vision (median 20/40).9 10 OCT studies have increased our knowledge about the pathogenesis and progression of macular holes,4–8 and recently also about the differential diagnosis between MPH and LMH.9 10 In OCT classification stage 2 lesions with an intact photoreceptor layer at the bottom of the fovea,7 Haouchine et al9 suggested that two different OCT profiles of the fovea may allow the differential diagnosis of MPH and LMH. Thus, we classified our stage 2 patients as having either MPH or LMH according to these OCT profiles. On the basis of the objective criteria, the two groups were indeed significantly different from one another, and our results are consistent with those of Haouchine et al.9 We then tested the loss of foveal tissue with AF imaging.
AF derives from the lipofuscin-laden retinal pigment epithelium,11 and in the macula it is attenuated by the luteal pigment. Most of this pigment in the fovea is along the outer plexiform layer,13 interposed between the foveal photoreceptors and the stimulating light. Thus, even very thin foveal defects, such as those affecting only the outer plexiform layer and sparing the photoreceptors as in LMH,10 may increase the foveal AF.
Alternative fluorophores to retinal pigment epithelium lipofuscin are present in various anatomical layers of the posterior pole. For instance, Bruch’s membrane possesses autofluorescent properties.11 18 However, the excitation and emission spectra are different from those of lipofuscin in retinal pigment epithelium cells, although with a slight overlap. The same is true for choroidal components and the sclera. Furthermore, sub-pigment epithelial fluid in the presence of pigment epithelial detachments or longstanding subretinal haemorrhages may contain fluorophores that induce an increased AF signal in the wavelength ranges relevant to the method applied herein.19 The latter two changes were not present in the eyes examined in our study. Thus, from the spectrophotometric analyses by Delori et al,11 we assumed that the dominant fluorophore responsible for the increased AF signals in our study indeed originated from retinal pigment epithelium lipofuscin.
In our series, the two groups showed similar foveal AF, demonstrating a similar loss of foveal tissue (figs 2–5). Cases classified as MPH on the basis of the OCT examination were in fact autofluorescent, suggesting a defect at the level of the outer plexiform layer. In addition, we found a lack of correlation between the amount of AF and the thickness of the residual retinal tissue at the bases of either MPH or LMH (fig 8). A likely explanation is that, once the outer plexiform layer in the fovea is affected, the absence of masking pigment allows the AF originating from retinal pigment epithelial cells to be easily detected, irrespective of the thickness of the overlying photoreceptor layer. The role of a defect at the level of the outer plexiform layer for foveal AF detection is validated by the lack of AF recorded in our control groups (figs 6 and 7). This is consistent with the absence of the effects of macular pucker or impending macular hole on the anatomical location and concentration of luteal pigment in the fovea.
The absence of any difference in AF between the two groups and the lack of correlation between foveal AF and retinal thickness raises questions about the validity of distinguishing between MPH and LMH on the basis of OCT data alone. It may be that high-resolution three-dimensional OCT imaging, now available with the new spectral domain instruments and capable of ≈5–7 μm axial image resolution, could better define the anatomical level of tissue loss in suspected LMH. However, even with ultra-high-resolution OCTs (≈3 μm axial image resolution, a real histopathological section), the definition of LMH or MPH remains controversial.10
In conclusion, our findings suggest that OCT data must be interpreted with caution when differentiating between MPH and LMH. In our series, the group diagnosed as having MPH by OCT showed a similar foveal AF, and thus similar loss of tissue, to the group diagnosed as having LMH. The level of this loss can hardly be defined by OCT images. AF imaging may add useful information to the differential diagnosis of MPH from LMH because the presence of foveal AF is consistent with LMH.
Acknowledgments
We are greatly indebted to Francois Delori, PhD, for his invaluable help in designing this study and providing the picture of macular pigment distribution in a macaque (fig 1).
REFERENCES
Footnotes
Presented in part at the 25th meeting of the Club Jules Gonin, 15-20 October 2006, Cape Town, South Africa
Funding: None.
Competing interests: None declared.
Ethics approval: Ethics approval was obtained.
Linked Articles
- At a glance