Article Text

Abstract
Aims: To predict the burden of blindness, partial sight, and visual impairment (binocular visual acuity 6/18 or less) due to late stage age related macular degeneration (AMD) in the ageing population of the United Kingdom.
Methods: A systematic review, followed by a request for data, was used to establish a pooled prevalence of AMD and corresponding visual loss. Prevalence figures were applied to the UK population. Using UK population trends, the future burden of AMD over the coming decade was established.
Results: Pooled data from six studies showed that the prevalence of visual loss caused by AMD increased exponentially from the age of 70–85 years of age, with 3.5% (95% CI 3.0 to 4.1) having visual impairment beyond the age of 75 years. The authors estimate that there are currently 214 000 (95% CI 151 000 to 310 000) with visual impairment caused by AMD (suitable for registration). This number is expected to increase to 239 000 (95% CI 168 000 to 346 000) by the year 2011. Currently there are 172 000 (95% CI 106 000 to 279 000) and 245 000 (95% CI 163 000 to 364 000) with geographical and neovascular AMD, respectively.
Conclusions: Estimates of visual impairment agree with official statistics for the number registered partially sighted or blind, caused by AMD, and are well below other figures often cited. Although these estimates are associated with wide confidence intervals (CI) and a number of caveats, they represent the best available data, which can be used to guide health and social care provision for older people in the UK setting. Implications for low vision services are outlined.
- age related macular degeneration
- blindness
- partial sight
- prevalence
Statistics from Altmetric.com
Age related macular degeneration (AMD) is the most common cause of adult blind registration in many developed countries,1,2 including the United Kingdom.3,4 AMD occurs predominantly in older people and is associated with significant impairment in quality of life and functional independence.5 AMD is largely incurable. Treatment is appropriate for few and, at best, halts progression of the disease.6,7 Geographical variations in the provision and accessibility of low vision rehabilitation services exist.8 Growth of the older population will increase the burden of ocular morbidity and visual disability due to AMD (assuming that there will be no improvements in factors influencing the incidence or treatment of AMD). Despite the public health importance of this condition, attempts to quantify the future burden in the United Kingdom have not been made, although analysis of sequential blind registrations in the United Kingdom may indicate an increase in the number of people with visually impairing AMD.9 However, blind registers only give data on the incidence of certification, and not the incidence or prevalence of disease.9 The extent to which registrations reflect the prevalence of visually impairing AMD in the population is controversial, with suggestions of substantial under-registration.10,11 The few population based prevalence studies of AMD in the United Kingdom have been too small to provide reliable estimates.12–14 The purpose of this study was to estimate the prevalence of visually impairing AMD in the United Kingdom by pooling data from suitable population studies to ascertain registration coverage and assess the implications for future levels of health and social care provision.
METHODS
Definitions of blind and partial sight
In the United Kingdom a person is registered blind (B) if their better eye Snellen visual acuity (VA) is less than 3/60 (6/60 if there is severe restriction of their visual field). An acuity of 6/60 to 3/60 warrants partial sight (PS) registration (6/18 or worse with gross restriction of the visual field, 6/24 or worse with moderate restriction of the visual field). Severe peripheral field restrictions do not occur with AMD as it affects central vision. Hence, data on visual fields are not always collected or presented. To avoid this problem the prevalence of better eye VA 6/18 to better than 6/60 was used to denote PS, 6/60 to 3/60 PS and/or B (PS/B), and less than 3/60 pure B. The B category is identical to the International Classification of Diseases 10th edition (ICD-10) definition of blindness.15 A collective category of visual impairment (VI) was used to denote those with VA 6/18 or less similar to the ICD-10 definition category 1 (VA less than 6/18) to 5 (no light perception).15
Definitions of age related macular degeneration
Ideally the international definition16 of AMD, including geographical AMD (GAMD) and neovascular AMD (NVAMD), should be used. However, as studies were conducted before the existence of this definition, “geographical/dry/atrophic/non-exudative/late” AMD was used to denote GAMD, and “neovascular/exudative/wet,” NVAMD.
Systematic review process and request for data
A systematic review of AMD prevalence and visual loss caused by AMD was conducted using published papers, letters, abstracts, and review articles from Medline, Embase, and Web of Science databases. References were identified using a combined text word and MESH heading (for Medline only) search strategy of AMD (macular degeneration {epidemiology}, age related maculopathy, senile macular degeneration) and prevalence (also incidence). Papers were restricted to studies written in English, conducted in representative population based samples, from predominantly white populations. Studies including volunteers17 or specific professions were excluded18–21 since these may be selected and biased groups. This search was completed in August 2001 and yielded 673 references. The abstracts of these articles were reviewed and 27 unduplicated references were identified as being of potential relevance. Because of the heterogeneous presentation of results in these papers (containing different age groups or definitions of AMD), 19 studies were chosen, based on geographically defined, randomly sampled populations, published in 1990 onwards, where a current contact address could be found. Authors of these studies (reference list on request) were written to and invited to provide data. Reminders were sent to encourage participation.
Given that the prevalence of AMD rises sharply from the age of 60 years,22 age stratified prevalence of the above definitions of binocular visual loss (caused by AMD), were sought from less than 50 years of age, 50–90 years of age in 5 year bands, and from 90 years of age onwards. In addition age stratified rates of GAMD and NVAMD in at least one eye were requested. Data for males and females were requested separately.
Statistical methods
Statistical analysis was performed using Intercooled stata 7.0 for Windows software (Stata Corporation, TX, USA). Most studies provided data on the prevalence of PS attributed to AMD and prevalence of GAMD and NVAMD in the age range 65–79. A meta-analysis of the study prevalence estimates for these three outcomes was performed for this age group using a fixed and random effects model (META command within stata). Sex differences in prevalence were also explored. In the absence of any statistically significant between study heterogeneity a fixed pooled effect is reported.23 If there was statistically significant (p<0.05) between study heterogeneity a random effects meta-analysis was performed. To assess the impact of heterogeneity between studies, pooled prevalences were recalculated after removal of results near or outside the 95% range of the Galbraith plot.24 This gives an indication of the stability of combined prevalence estimates. Characteristics of the studies lying near or outside this 95% range were examined to see how they differed from other studies. An a priori exception was made for the Rotterdam Eye Study, under the assumption that this population has a similar lifestyle and demography to the United Kingdom.
Stratifying by 5 year age groups resulted in very few, if any, cases of visual loss or AMD in younger age groups. In view of this, a sample size weighted average of prevalence was calculated and exact binomial 95% confidence intervals (CI) determined. This method of combining study estimates does not allow for the between study heterogeneity to be explored within age strata; however, in view of the small numbers for some age groups the authors believe that this approximation is reasonable. Weighting by the square root of the study sample size made little difference to the combined estimate.
RESULTS
Data were received from six of the 19 studies (Table 1). Prevalence of visual loss (attributed to AMD) from the North London Eye Study was the only source of UK data (prevalence of GAMD or NVAMD was not recorded).14 Data from all studies were provided for age groups between 65 and 79 years of age. A meta-analysis of GAMD, NVAMD, and PS (caused by AMD) prevalence (between the ages of 65–79) was performed for males, females, and overall (Table 2). Differences in GAMD prevalence between studies were not statistically significant, percentage prevalences were similar in males and females with 95% CI overlapping (Table 2). Figure 1 shows a forest plot of GAMD prevalence and fixed effect combined estimate for sexes combined (0.5% 95% CI 0.4 to 0.7).
Summary of studies that responded to the request for data
Meta-analysis of GAMD, NVAMD, and PS (caused by AMD) prevalence, aged 65–79 years
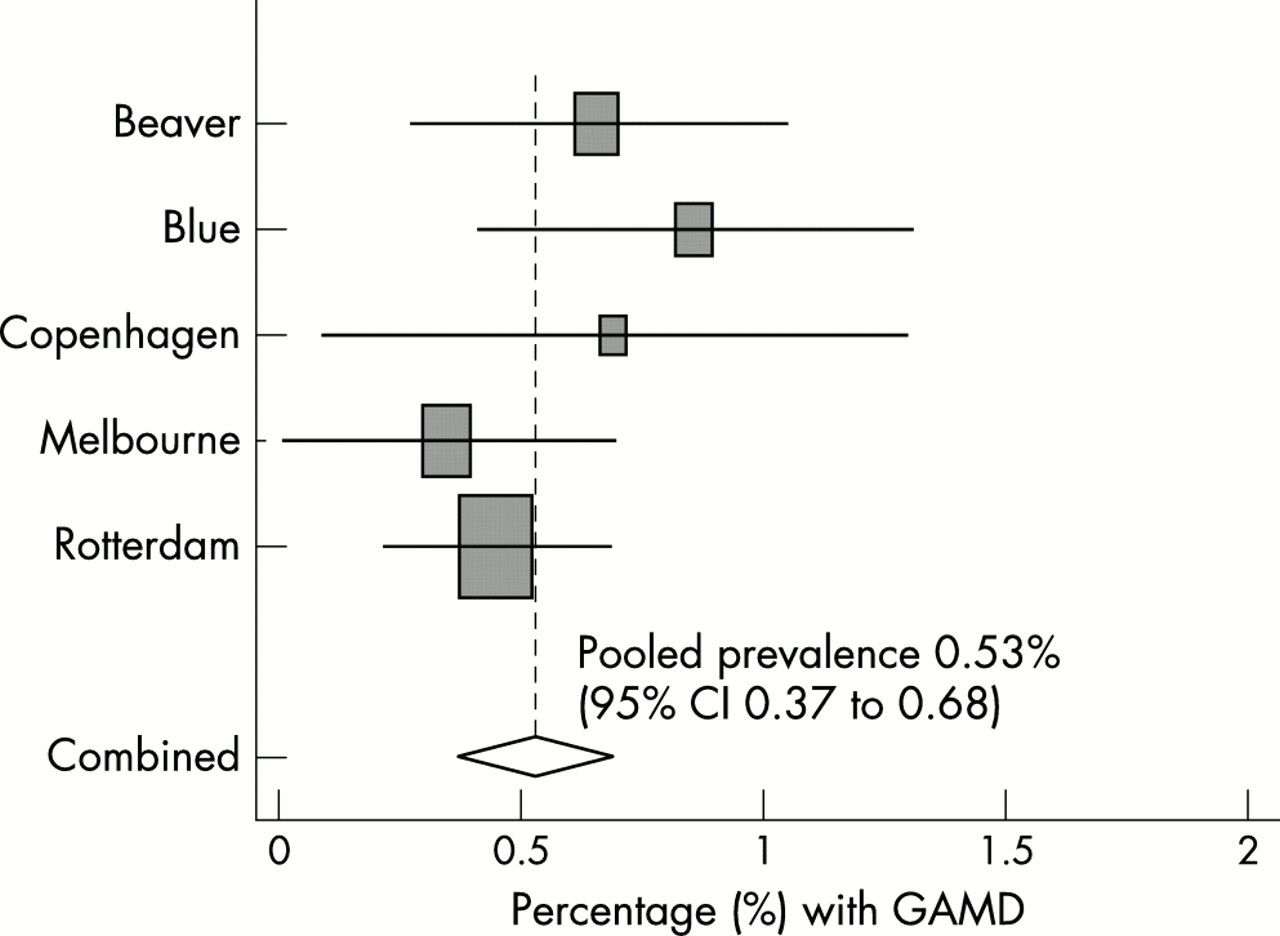
Percentage prevalence of GAMD (for males and females, aged 65–79 years) from Beaver Dam Eye Study, Blue Mountains Eye Study, Copenhagen City Eye Study, Melbourne Visual Impairment project, and Rotterdam Eye Study. Combined estimate based on a fixed effects model shown by broken vertical line and diamond (95% CI).
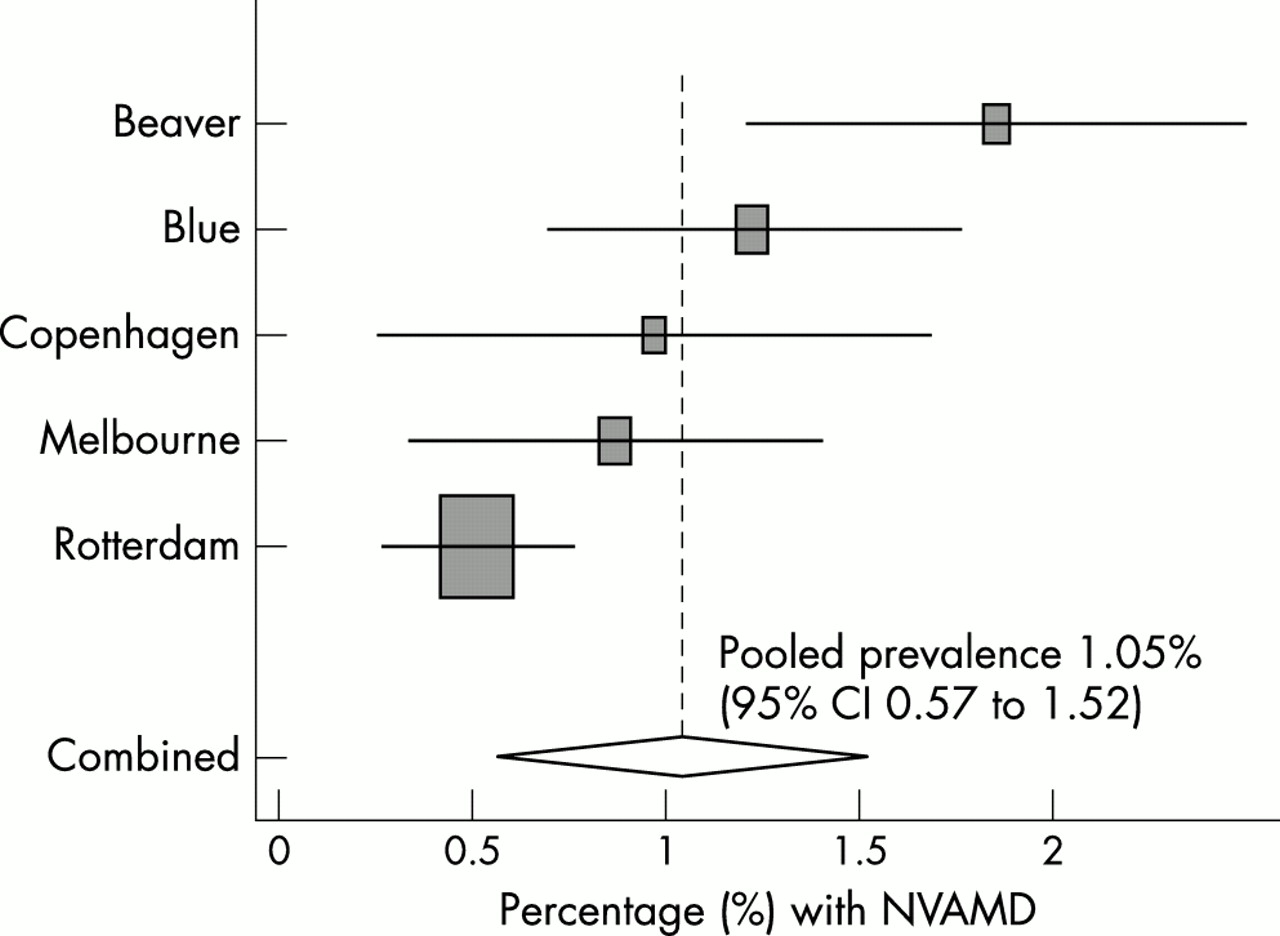
Differences in NVAMD prevalence between studies for males (aged 65–79 years) were not statistically significant (Table 2). The prevalence of NVAMD among males, was higher in the Beaver Dam Eye Study (1.45%, 95% CI 0.56 to 2.34) compared to the Rotterdam Eye Study (0.53%, 95% CI 0.14 to 0.92) although 95% CI overlapped. In females, differences in NVAMD prevalence were statistically significant, with a larger difference in prevalence between Beaver Dam (2.14%, 95% CI 1.23 to 3.04) and Rotterdam Eye studies (0.50%, 95% CI 0.18 to 0.83). Figure 2 shows a forest plot of NVAMD prevalence (random effects combined estimate) for sexes combined, showing differences between studies (especially between Beaver Dam and Rotterdam studies). Exclusion of the Beaver Dam Eye Study (as its result was outside the 95% range of the Galbraith plot) resulted in a similar combined prevalence (0.70%, 95% CI 0.50 to 0.90, χ2 test for heterogeneity p=0.08).

Percentage prevalence of NVAMD (for males and females, aged 65–79 years) for Beaver Dam Eye Study, Blue Mountains Eye Study, Copenhagen City Eye Study, Melbourne Visual Impairment project, and Rotterdam Eye Study. Combined estimate based on a random effects model shown by broken vertical line and diamond (95% CI).
Figure 3 shows a forest plot of PS prevalence (caused by AMD) showing heterogeneity between studies, with PS being most common in the North London Eye Study (1.23%, 95% CI 0.59 to 1.87) and least common in the Rotterdam Eye Study (0.10%, 95% CI 0 to 0.21). Exclusion of North London Eye Study and Copenhagen City Eye Study data (based on the Galbraith plot) resulted in a slightly reduced combined prevalence (0.16%, 95% CI 0.07 to 0.25, χ2 test for heterogeneity p=0.196).

Percentage prevalence of PS caused by AMD (for males and females, aged 65–79 years) for Beaver Dam Eye Study, Blue Mountains Eye Study, Copenhagen City Eye Study, Melbourne Visual Impairment project, and Rotterdam Eye Study. Combined estimate based on a random effects model shown by broken vertical line and diamond (95% CI).
Exclusion of studies with prevalence estimates out of line with other studies (near or outside the 95% range of the Galbraith plot) had minimal effect on the combined prevalence of NVAMD and PS caused by AMD. Hence, prevalence estimates derived from all studies are used throughout.
Table 3 shows age stratified prevalence of PS, PS/B, and B caused by AMD, and prevalence of AMD type. Visual difficulties are rarely seen below the age of 70 years, despite the presence of GAMD and NVAMD in a small proportion of this age group. Graphically, the prediction of visual compromise rises exponentially beyond the age of 70, as does the number suffering from AMD in at least one eye.
Age (years) specific percentage prevalence (95% CI) of binocular visual impairment caused by AMD, and presence of GAMD and NVAMD in either eye
Current and future predictions of population growth for the United Kingdom for the next 10 years, stratified by age, were obtained.25 The prevalence estimates of PS, PS/B, B, VI, GAMD, and NVAMD were applied to this population forecast for years 2001 and 2011 (Table 4). Table 4 shows increasing numbers with visual loss and AMD type from the age of 65–84 years, after which the numbers appear to plateau. The proportionate increase in visual loss (PS, PS/B, B, and VI) ranged from 11%–13% from year 2001 to 2011 (just over 1% per year). The vast majority of VI (≈97%) is predicted to be in those aged 70 and older. GAMD is rare in those aged 50–69 years; thereafter, it increases with age, with a peak in the 85–89 year age group. The occurrence of NVAMD, in at least one eye, followed a similar pattern to GAMD. NVAMD appears to occur 5 years earlier than GAMD, reaching a peak in the 80–84 year age group. A plot of the natural logged number suffering from GAMD and NVAMD by age was linear (up to 80–85 years of age), indicating that there is an exponential rise in AMD with age.
Prevalence figures applied to UK population predictions to give the expected number (in thousands) of AMD caused PS, PS/B, B, VI (visual acuity of 6/18 or less), GAMD and NVAMD (95% CI), stratified by age, for 2001 and 2011
DISCUSSION
A key question is the extent to which these pooled estimates of visual loss caused by AMD and the prevalence of AMD type can be applied to the UK population, given that only one of the studies took place in the United Kingdom. A pooled estimate showed that 3.5% (95% CI 3.0 to 4.1) of those 75 years or older were visually impaired due to AMD. This agrees well with an estimate found among 106 people (n = 3/106, 2.8%, 95% CI 0.5 to 8) of similar age (≥75 years), within a GP practice population in London.12 However, a smaller study in Melton Mowbray found far higher estimates of better eye VI (n = 13/82, 16%, 95% CI 9 to 26) in a slightly older age group (mean 80, range 77–90 years).13,26 The majority of the older population of Great Britain are white27 and so application of prevalences from racially similar population studies such as America,28 northern Europe,29–31 and Australia22,32–34 was considered appropriate. However, geographical variations in AMD prevalence exist31 because of genetic35 and/or environmental exposures, such as sunlight,36 smoking,17,37 and diet.38
There are many sources of heterogeneity between studies and caution should be exercised when combining data from different surveys because of non-standardised definitions of disease, criteria for diagnosis, and examination methods. Methods of examination included fundus photography,28,31,32 indirect,14,22,31,32 and direct ophthalmoscopy.30 Diagnosis made solely at examination14,29,30 may be open to bias compared to those verified independently from photographic images.22,32–34 This may explain the higher percentage of PS attributed to AMD found in two studies.14,29,30 In the Beaver Dam Eye study,28 causality between advanced maculopathy and visual loss was not assumed. Hence, other pathologies may have caused the recorded visual loss leading to overestimation of the effect. Acuity measured with current spectacles (which may not be up to date) as opposed to immediately after refraction, may cause additional visual compromise.14 A homogeneous approach to AMD classification has since been advised but was not available to earlier studies.16
Current AMD rates may have changed since the 1980s28,30 and early 1990s,31,32 but there was no evidence of a cohort effect among studies included. Method of population recruitment, response rates (although generally high), and action on non-responders varied between studies. Non-response may bias prevalence estimates, as non-responders may represent those with the disease. Response to the request for data was low (32%), which may lead to study response bias in itself. However, data were provided by four22,28,31,32 of six1,39 major population based studies which used independent photographic grading to confirm AMD diagnosis. An attempt was made to compare our findings with published data from these two other studies (Framingham Eye Study and Salisbury Eye Evaluation).1,39 Our pooled estimate of VA 6/60 or worse (0.4%, 95% CI 0.3 to 0.5) in those aged 65–84 years, compared well with data from the Salisbury Eye evaluation (United States) in a white population of similar age (n = 7/1853, 0.4%, 95% CI 0.2 to 0.8). Our estimate of both GAMD and NVAMD combined (3.4%, 95% CI 2.9 to 3.8) in those aged 65–84 years was considerably less than the prevalence of AMD in the Framingham Eye Study (n = 133/1249, 10.6%, 95% CI 9.0 to 12.5). However, comparison with a study carried out in the early 1970s may not be appropriate.1
Sex specific rates of AMD were combined to give an overall measure of prevalence, as sex differences were not statistically significant. Numerous studies have failed to find a sex difference in prevalence of early stage age related maculopathy (ARM) or AMD.28,32,37,40,41 Disputes over whether AMD blindness is higher in females than males may be genuine or may be due to increased life expectancy, and over-representation of elderly females in studies.2
Local authorities in the United Kingdom reported that 193 956 were on the blind register and 160 197 were on the partial sight register on the 31 March 1997.10 Approximately half (48.5%) of these registrations can be attributed to AMD.3 Hence, 94 000 PS and 78 000 B registrations (total 172 000) were potentially caused by AMD. This number agrees well with our point estimate of VI for 2001 (Table 4). In 1991, the Bruce report estimated that 300 000 should be registered blind and 457 000 partially sighted in Great Britain. Half of this total number (∼400 000) can be assumed to be caused by AMD. These “conservative” figures were extrapolated from a highly selected interviewed group and a measure of precision (95% CI) was not given. The most widely quoted estimates of visual impairment (PS and B) are given on the RNIB website,10 which are derived from the Bruce report.11 These figures estimate that there are ≈900 000 (125 940 and 750 460) visually impaired people in the United Kingdom aged 65 years or more. Just over half of these registrations (54.5% B and 53.2% PS registrations) were due to degeneration at the macular and posterior pole in those aged 65 years and above.3 Hence, ∼500 000 people in this age group are predicted to be B or PS by AMD. These sources of data10,11 are often used to indicate substantial under-registration of the visually impaired in the United Kingdom.42,43 The results from the studies presented in this paper suggest that, taking even the upper range of the 95% CI, substantial under-registration is unlikely.
We estimate that there are currently 172 000 people (95% CI 106 000 to 279 000) with geographical AMD in the United Kingdom, and 245 000 (95% CI 163 000 to 364 000) with neovascular AMD. The apparent greater prevalence of neovascular AMD compared to geographical AMD (although not statistically significant) has been corroborated by a recent pooled analysis37 of three studies used in the current study.28,31,32 In addition, neovascular AMD has been shown to be a more common cause of blind registration compared to the geographical variety.1,44 Disparity in population prevalence and clinical presentation of AMD type could be due to difficulties in distinguishing between late stages of either disease or sample bias in those who present to hospital eye departments. NVAMD progresses more rapidly to visual loss than GAMD. Despite patients being less likely to perceive age related visual changes associated with GAMD, hospital eye departments may accumulate large numbers of patients with slowly progressing disease, increasing the proportion seen with GAMD compared to those with acute NVAMD. Patients with NVAMD are more likely to present acutely with irremediable late stage disease, and might not be seen in hospital eye service clinics for the same period of time as those with GAMD. If the population prevalence of visual loss caused by GAMD and NVAMD are similar, then the natural history of the disease determines that larger numbers with early stage GAMD must exist. This may explain the historic view that nearly four fifths of all AMD cases have GAMD, when a definition of GAMD including an early stage of disease was used (that is, macular drusen or pigmentary disturbance without exudation of fluid or proliferation of scar tissue).1
Despite the caveats associated with the derivation of these estimates, there are a large number of elderly patients in the United Kingdom with visual impairment caused by AMD, which is likely to increase with time. The levels of vision described amount to considerable visual compromise and constitute a major public health burden, resulting in increased social isolation, depression,45 restriction of daily activities,46 risk of falling and hip fracture.47 Reassuringly, our estimates did not demonstrate a hidden burden of service need. Although numbers in need of low vision rehabilitation will increase, it is unlikely to be overwhelming. However, nationwide low vision services are notoriously fragmented and access variable.8 Potential beneficiaries often do not have access to services48 which improve vision related quality of life.49,50 Public sector reform 51,52 and recent initiatives53 seek to tackle these inequalities in service provision and access. Ultimately, these need to be redressed if help is to be given to growing numbers of older people living with poor vision.
Acknowledgments
Sources of support: Macular Diseases Society (UK).
Conflicts of interest: None.
Our thanks to the following who provided data; Professor R Klein and Ms S Tomany (Department of Ophthalmology and Visual Sciences, University of Wisconsin-Madison Medical School, USA), Drs H Buch, T Vinding, M La Cour, and N V Nielsen (The National University Hospital, Rigshospitalet, Denmark), Professor P de Jong and Dr J Vingerling (The Netherlands Ophthalmic Research Institute, Amsterdam; Erasmus Univeristy, Rotterdam; Department of Ophthalmology, Academic Medical Centre, Amsterdam, The Netherlands), Dr A Reidy (Moorfields Eye Hospital, London, UK) and Dr D C Minassian (Institute of Ophthalmology, London, UK), Professor H Taylor, Dr L Weih (Centre for Eye Research Australia, University of Melbourne, Australia), Drs P Mitchell and J J Wang (Centre for Vision Research Australia, Department of Ophthalmology, University of Sydney, Westmead Hospital, Australia). Our thanks to Ms J Evans (Institute of Ophthalmology, London, UK) for useful comments on drafts of the manuscript.