Article Text

Abstract
Introduction Multiple nutritional risk assessment tools are available, but there are limited data on their application in the acute setting. We explored the validity of two tools in a tertiary Children's Hospital's acute unit and the cohort's nutritional status using WHO definitions.
Methods Prospective study n=300 (median 38 months; 44.6% female; 25.7% ≤12 months). Participants had standard anthropometry measured, all were screened using the Screening Tool for the Assessment of Malnutrition in Paediatrics (STAMP), the Paediatric Malnutrition Screening Tool (PMST) (modified STAMP) and 125 were additionally screened using the Paediatric Yorkhill Malnutrition Screening (PYMS) tool.
Results The percentages with medium/high nutritional risk were as follows: STAMP 73.1%, PMST 79.3% and PYMS 30%. Height/weight were normally distributed with: 3.4% stunted (height-for-age z-score <−2); aged ≤ 5 years, 6.8% wasted (weight-for-height z-score (WHZ) <−2), 17.9% overweight (WHZ 1–2) and 6.2% obese (WHZ >2); aged >5 years, 5.8% thin (body mass index (BMI)-z-score (BAZ) <−2), 17.3% overweight (BAZ 1–2) and 5.8% obese (BAZ >2). The tools showed poor specificity and variable sensitivities when compared with WHO malnutrition criteria, with positive predictive values of <50%. κ-Analysis also showed poor agreement between the tools and the WHO cut-offs.
Conclusion These results suggest that nutritional screening tools have poor sensitivity and are difficult to interpret in the acute setting. It may be more effective to include the assessment of weight and height and nutritional intake in the context of the acute presentation as part of routine clinical assessment rather than relying on screening tools to identify those at risk.
- nutrition risk
- malnutrition
- screening tools
Statistics from Altmetric.com
What is already known on this topic?
Nutritional screening is recommended within routine nutritional care of patients.
A number of paediatric nutritional screening tools exist but there is no gold standard.
No current tool assesses for overweight/obese patients.
What this study adds?
Our results suggest that nutritional screening tools are poorly specific and oversensitive when used in the acute setting.
There is poor agreement between the tools.
The routine inclusion of growth monitoring in daily ward review may be more effective in identifying those at risk.
Introduction
Children have increased nutritional risk when admitted to hospital. Depending on the criteria used, the prevalence of disease-associated malnutrition in European hospitals ranges from 6% to 30%.1–3 Many different terms are used interchangeably to describe poor nutritional status including malnutrition, failure to thrive and faltering growth, although they do not necessarily describe the same level of undernutrition or overnutrition.4 ,5 A recent multicentre study reported that malnourished children (body mass index (BMI) <−2 z-scores) had an increased length of hospital stay and greater complication rates.1 The purpose of nutritional screening is to identify patients at high nutritional risk6 and includes anthropometric (height and weight) assessment interpreted within the context of current illness, with the aim of preventing a further decline in nutritional status during hospitalisation.5 ,7 ,8
The Nutrition and Hydration Report 20159 recommends nutritional screening on admission and currently a number of paediatric nutrition screening tools are used in the National Health Service (NHS).7 ,10 ,11 Their reliability however has been inconsistent and results from our own centre suggest poor reliability and reproducibility in children with chronic disease.12 Of the many tools available the Royal College of Nursing (RCN) suggests the Screening Tool for the Assessment of Malnutrition in Paediatrics (STAMP)11 ,13 ,14 and the Paediatric Yorkhill Malnutrition Screening (PYMS) tool10 ,14 ,15 in their guidance regarding malnutrition,16 although European Society for Clinical Nutrition and Metabolism (ESPEN) and European Society for Paediatric Gastroenterology Hepatology and Nutrition do not currently endorse one specific tool.17 A recent meta-analysis of nutrition screening tools also showed that there is ‘marked variation between studies’ including reference tests or gold standards used to validate the tools.8 This has been further supported by a large multicentre study of STAMP, PYMS and STRONGkids tools which found variation in the identification and classification of malnutrition by the tools, as well as poor identification of children who, by anthropometric standards, were malnourished.18 There are also issues around ease of use, implementation and reproducibility within a clinical setting, where even standard anthropometry, particularly height/length, is not always recorded,3 ,19 suggesting that the measurement and interpretation of growth may not be embedded in routine clinical practice. Recent work, in mainly lower/middle-income countries, has suggested the use of mid-upper arm circumference (MUAC) in screening for malnutrition; however, there is discrepancy between the cut-offs for both undernutrition and overnutrition.20–22 In addition, those at risk according to MUAC do not always correlate with weight-for-height, depending on the population.21
The primary aim was to assess the validity of two nutritional screening tools in the acute setting by describing the nutritional risk in a cohort of infants and children attending our Paediatric Assessment Unit (PAU), a general paediatric ward accessed by the local community. The secondary aim was to explore the nutritional status of these children using the WHO definitions.
Methods
Data collection
For this prospective observational study, a convenience sample of participants was collected in two cohorts by a single observer during a 12-week period (December 2014–March 2015). All cases presented to the PAU at University Hospital Southampton (UHS) (n=300). Verbal consent was obtained from the parents/nominated carer for each participant. Anthropological measurements were performed by a single observer and recorded in line with the UHS Child Health Trust Policy. Weight was measured to the nearest 0.1 kg using a digital scale; infants under 1 year were weighed naked and those older with minimal clothing. Recumbent length was measured to the nearest 0.1 cm in all children under the age of 2 years using an infantometer (Seca; California, USA) and height was measured to the nearest 0.1 cm using a stadiometer (Seca; California, USA) in older children. Other demographic and clinical data were collected from the notes and included in the analysis.
Z-scores were calculated using WHO Anthro (World Health Organisation. WHO Anthro (V.3.2.2, January 2011). 2015) for those under 5 years and WHO AnthroPlus (V.3.2) (World Health Organisation. WHO AnthroPlus. 2015) for those older than 5 years. WHO growth reference interpretation of cut-offs for malnutrition (undernutrition and overnutrition) were used. These are defined as stunting (length/height-for-age z-score (HAZ) <−2), wasting in children under 5 years and thinness in children over 5 years (weight-for-height z-score (WHZ)/BMI-for-age z-score (BAZ) <−2), children who are overweight (WHZ/BAZ >1) and obese children (WHZ/BAZ >2).23
Nutrition screening
Each participant's nutritional risk was calculated using STAMP and the Paediatric Malnutrition Screening Tool (PMST), (modified from STAMP). 125 consecutive children were also screened using the PYMS tool.
STAMP
STAMP assesses all three variables that, as recommended by ESPEN, should be included in nutritional screening, namely,24 diagnosis, current intake, weight and height (maximum score 9) and has been validated in children older than 2 years. Children are grouped into low (score 0–1), medium (score 2–3) and high risk (score ≥4) with appropriate action plans.25
PMST (modified STAMP)
To assess both undernutrition and overnutrition, the current tool used clinically at UHS, PMST, is based on STAMP.11 This has been modified to include: <2 years of age, overweight (BMI >85th centile) and obesity (BMI >98th centile). Scoring and risk classification remain the same as STAMP and this and the modifications to STAMP to create the PMST are described in table 1.
Screening Tool for the Assessment of Malnutrition in Paediatrics (STAMP)*
PYMS
The PYMS tool follows a similar format as STAMP in assessing BMI, recent weight loss, current intake and expected intake; however PYMS specifies that the decreased/expected decrease in intake is over 7 days (maximum score=7; low risk=0, medium risk=1, high risk ≥2).10 ,14 ,15
For clinical reasons where height could not be measured, step 3 of STAMP/PMST and step 1 of PYMS were omitted. This was accounted in the analysis by a ‘Plus’ score (STAMP+/PMST+/PYSM+), indicating nutritional risk may be the same or greater than the score given. These were included in the same risk category as an actual score in the analysis; for example, score of 3+ was considered the same as 3.
Data analysis
Analysis included assessing nutritional risk as classified by each tool, validated by assessing the sensitivity, specificity, positive and negative predictive values of the tools together with κ-analysis of the degree of agreement between the tools and the WHO cut-offs. κ value >0.6 represents a good level of agreement and <0.2 is poor. Statistical analysis was performed by SPSS (V.24; SPSS, Chicago, Illinois, USA).
Results
Population demographics
A total of 300 children were recruited, 40 were ex-preterm. Median age was 38 months (0–17.6years); 25.7% (n=77) were <12 months and 61% (n=183) were under 60 months (5 years); 44.6% (n=134) were female. Respiratory (45%) or ear, nose and throat (ENT) (11%) conditions accounted for the majority of presentations. Surgical conditions accounted for 9% and orthopaedic, endocrine and oncology presentations were the least common with approximately 1% each.
Nutritional risk scoring
STAMP
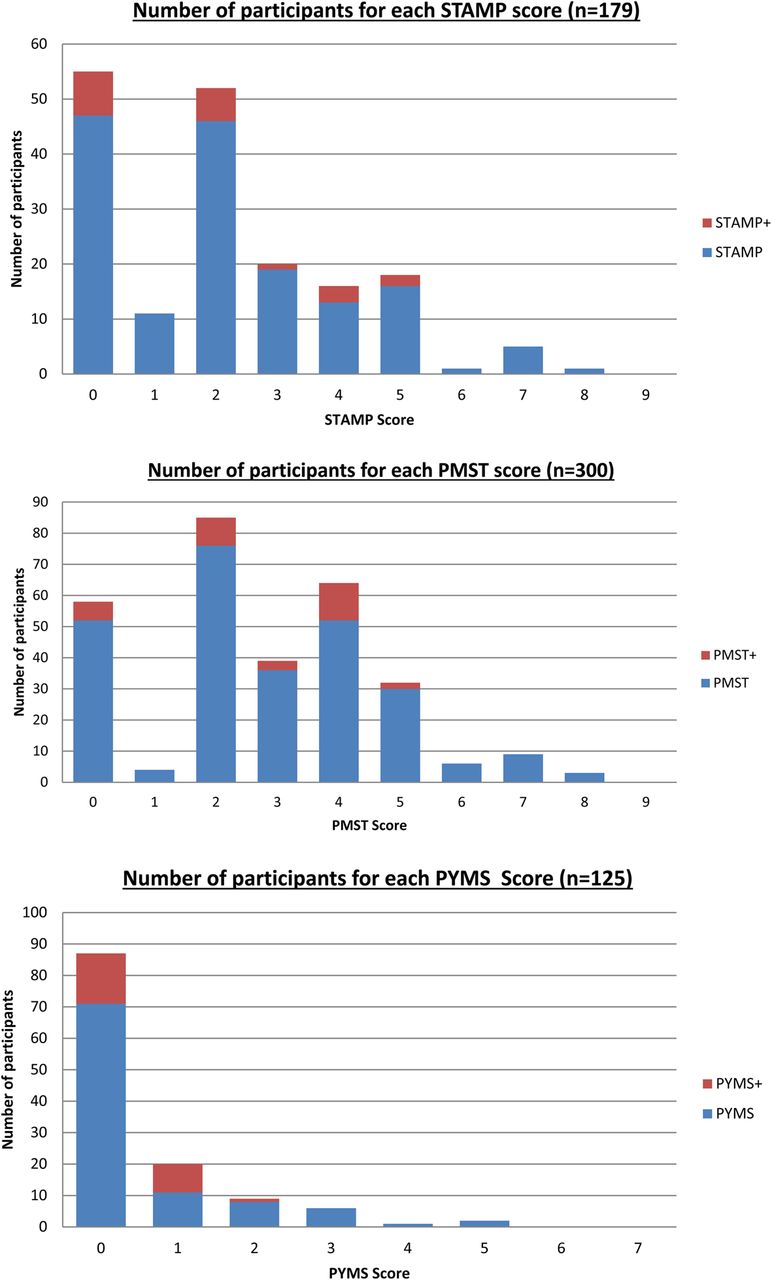
60% (n=179) were aged over 2 years and were screened using STAMP. 36.9% of participants (n=66) were categorised as low risk (score 0–1), 40.2% (n=72) were categorised as medium risk (score 2–3) requiring rescreening in 72 hours and 22.9% (n=41) were categorised as high risk (score ≥4) requiring immediate dietetic referral during admission (figure 1A).

Distribution of nutritional risk when using (A) Distribution of nutritional risk when using STAMP (n=179) Low risk=0–1; Medium risk= 2–3; High risk ≥4 STAMP+= Score from Step 1 and 2 of tool only as no height available for Step 3. (B) Distribution of nutritional risk when using PMST (n=300) Low risk=0–1; Medium risk= 2–3; High risk ≥4 PMST+=Score from Step 1 and 2 of tool only as no height available for Step 3 and (C) Distribution of nutritional risk when using PYMS (n=125) Low risk=0; Medium risk=1; High risk ≥4 PYMS+= Score from Step 2, 3, & 4 of tool only as no height available to calculate BMI in Step 1. PMST, Paediatric Malnutrition Screening Tool; PYMS, Paediatric Yorkhill Malnutrition Screening; STAMP, Screening Tool for the Assessment of Malnutrition in Paediatrics.
PMST (modified STAMP)
All 300 participants were screened using the PMST. 20.7% of participants (n=62) were categorised as low risk (score 0–1), 41.3% (n=124) were categorised as medium risk (score 2–3) requiring rescreening in 72 hours and 38% (n=114) were categorised as high risk (score ≥4) requiring immediate dietetics referral (figure 1B).
PYMS
A total of 125 participants were screened using the PYMS tool. 69.9% (n=87) were categorised as low risk (score 0), 16% (n=20) were considered medium risk (score 1) requiring repeat screening in 72 hours and 14% (n=18) were categorised as high risk (score ≥2) requiring dietetic referral (figure 1C).
Anthropometric analysis
Age under 5 years
Of the children under 60 months (n=183), 162 patients (88.5%) had their height recorded. 3.1% were stunted (HAZ <−2) (figure 2A), 6.8% were wasted (WHZ <−2), 17.9% were overweight (WHZ >1) and 6.2% were obese (WHZ >2) (figure 2B). Using BMI for age, 6.1% were wasted (BAZ <−2), 16.0% were overweight (BAZ >1) and 6.1% of children were obese (BAZ >2).
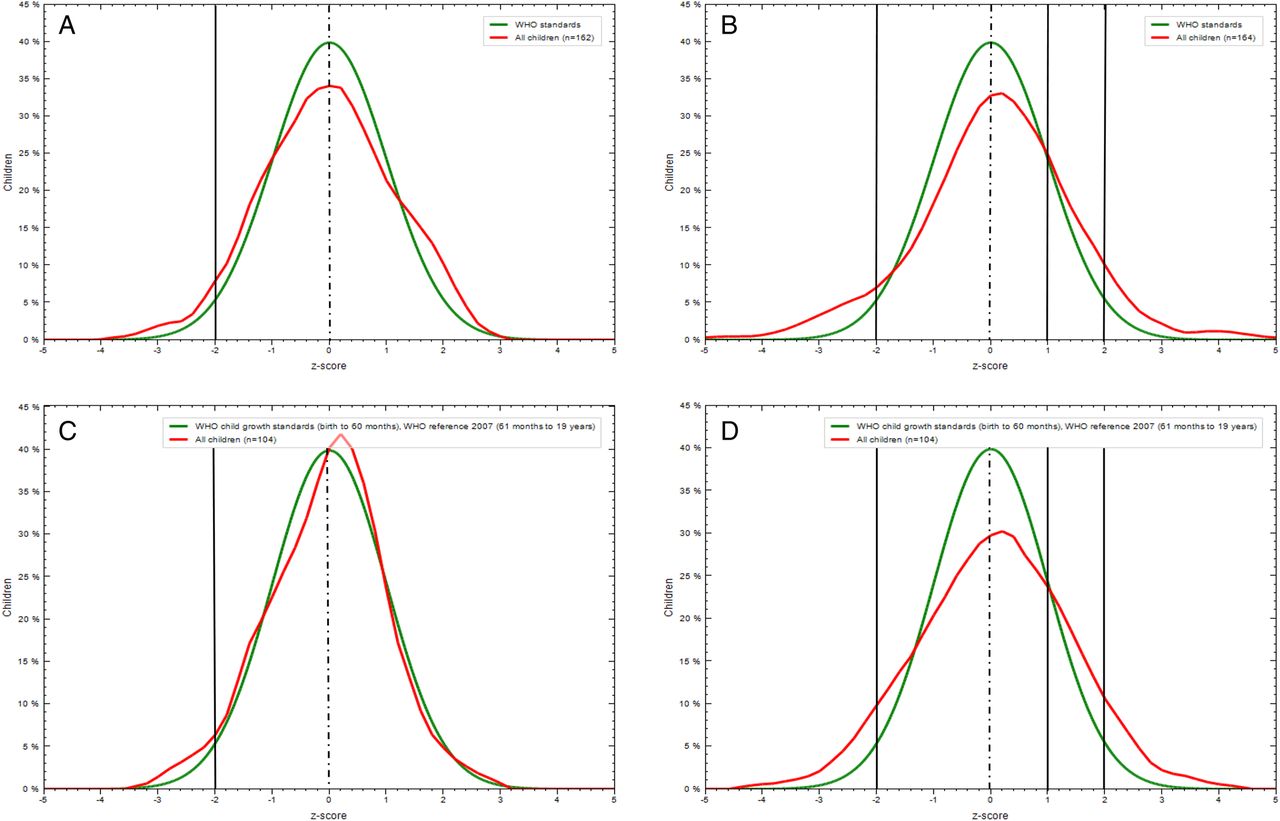
Prevalence of stunting, wasting, overweight and obesity.
Validity of screening tools
Sensitivity, specificity, positive and negative predictive values were calculated for each screening tool. κ-Analysis was performed to assess the degree of agreement between each tool and WHO cut-offs (table 2). Those who scored medium or high risk by the tool were compared with those who would be considered to be malnourished/at risk using the WHO definitions: stunted (HAZ <−2), wasted/thin (WAZ/BAZ <−2), overweight (WAZ/BAZ >1) or obese (WAZ/BAZ >2). Those with missing height data were excluded from the analysis.
The nutritional screening tools’ sensitivity, specificity, positive and negative predictive values and κ-analysis of agreement with the WHO cut-offs of malnutrition
Discussion
We have described the nutritional risk in 300 children seen in an acute paediatric setting. Our results suggest that the nutritional screening tools have a poor sensitivity and variable specificity with each tool having a positive predictive value of <50% and a very high proportion of acute admissions being scored as at medium/high risk.
STAMP classified 40.2% at medium risk and 22.9% at high risk. PMST identified 41.3% at medium risk and 38% at high risk. PYMS tool identified fewer patients at risk with 16% at medium risk and 14.4% at high risk. However, when using WHO anthropometric criteria for malnutrition, a considerably lower proportion of the cohort would be classified as nutritionally at risk with only 4.9% being wasted/thin (WHZ/BAZ <−2) and 3.4% being stunted (HAZ <−2). A much higher proportion were at the other end of nutrition risk spectrum with 18.8% being overweight (WHZ/BAZ 1–2) and 5.6% being obese (WHZ/BAZ >2) (figure 2). κ-Analysis showed poor agreement when the tools were compared with WHO cut-offs. Our results therefore question the validity and use of screening tools within the acute setting.
Chourdakis et al18 found that risk classification varied with tools and concluded that they were unable to recommend the current tools for use in clinical practice. In their study they only considered children who scored as high risk to be at risk and found that on a number of occasions those with subnormal BMI were not identified by the tools.18 We, however, considered those who scored either medium or high risk to be at risk in our analysis, as those who were medium risk required ongoing monitoring and would be expected to pick up children with a suboptimal BMI who did not score as high risk.
The difference between the tools outcomes may be explained by the questions asked, together with their subjective interpretation. PYMS focuses on low BMI and the child's intake for the previous and onward 7 days, whereas STAMP/PMST does not classify the duration of reduced intake. PMST (modified from STAMP) includes scores for overweight/obese. Despite both the PYMS tool and STAMP being routinely used by the NHS, STAMP is only validated in children aged ≥2 years11 and PYMS in those ≥1 year.10 As 25.6% of our participants (n=77) were ≤1 year and 14.6% (n=44) were ≤2 years, the efficacy of these tools in an acute setting is questionable. Between 14% and 38% required immediate dietitian review on admission and a further 16%–41.3% require additional screening which therefore questions if current services can accommodate such high referral rates.
Recent international studies clearly described an association between malnutrition, increased hospital stay and complications, recommending timely identification and nutrition management to improve patient outcome.1 ,18 Despite this, there has been very little research, or evidence, that the use of current screening tools improve outcomes in those identified as being at risk and, as such further, work is required.5
To our knowledge no nutrition screening tool currently assesses for overnutrition. The risks of obesity in childhood are well documented; however, there is a paucity of evidence regarding the impact of short-term nutritional management and periods of deficit in overweight/obese children and the subsequent impact on length of stay, morbidity or mortality. A recent study in the USA found that physicians and their trainees rarely identified or addressed overweight/obesity in hospitalised children26 and this therefore needs addressing. Although STAMP and PYMS tools are designed to identify those who are undernourished, we included those who were overweight/obese into the at-risk group for analysis as these children are, although slightly different, still are at nutritional risk.
The strengths of our study are that it has a large cohort collected from a single centre by one observer. However, some limitations were that only those in the second cohort (n=125) were additionally screened using PYMS following a decision to compare the participants against a tool which we had previously shown to have a modest agreement with STAMP in patients with chronic disease,12 with a view to investigating the validity of PYMS in an acute setting. Another limitation is that we have not compared all nutritional screening tools available, instead focusing only on those recommended by RCN/British Association for Parenteral and Enteral Nutrition for use within the NHS. It would, however be interesting to compare our findings with other tools, particularly STRONGkids,7 ,27 as a recent review found it to be a practical and reliable tool for assessing nutritional risk.5 However, Cao et al27 describe that significantly more clinical resources and health costs are required to ensure that those classified as high risk receive adequate nutritional support during admission to ensure positive outcomes and within limited resources the cost:benefit ratio must also be taken into consideration. As part of our future work, we plan to investigate the relationship of nutritional risk in an acute setting and clinical outcomes post-discharge to investigate the impact on health cost, healthcare utilisation and other health-related outcomes.
The real issue is what constitutes nutritional screening and how should this be used, particularly in an acute setting? Should it assess those at risk during their current illness, as per the current tools, or should/could it be adapted to consider those more at chronic risk, due to acquired or congenital disease conditions and be adapted to include early detection and intervention of those who are both undernourished and overweight/obese to improve longer-term health and nutrition?
There are many factors that impact on nutritional risk: nutritional and disease state, requirements and intake. The intention of nutritional screening is to consider all these factors so that an intervention can be planned and appropriate measures could be taken to decrease further risk to the patient. The nutritional status at illness onset/admission is only one factor. Sermet-Gaudelus et al28 found that reduced intake of <50% of daily allowance, pain and severity of the underlying disease significantly predicted weight loss as an inpatient and nutritional status on admission did not increase this risk.
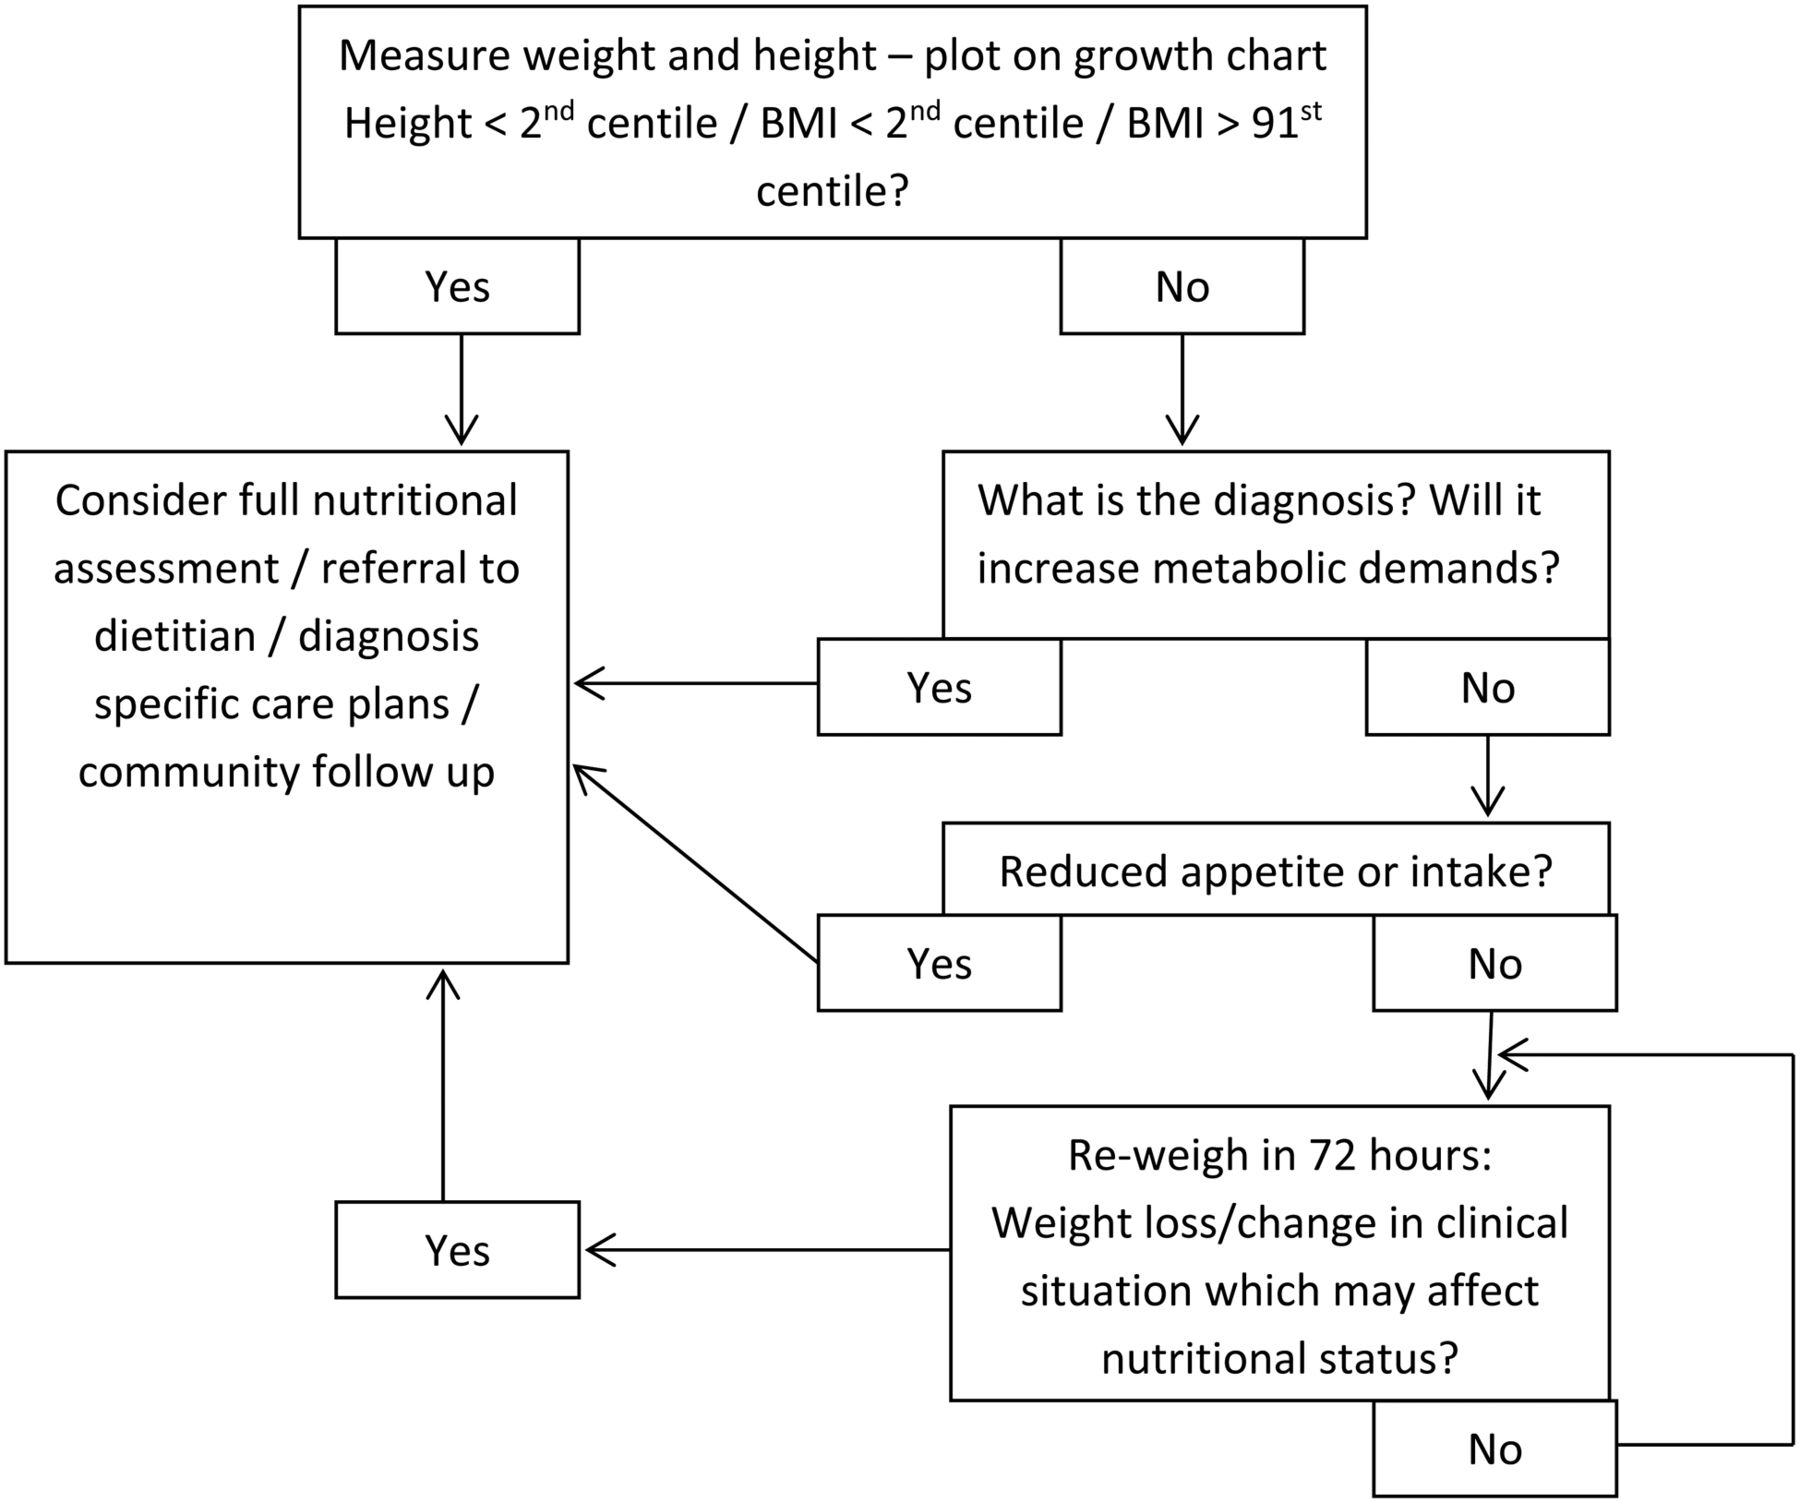
We recommend that in the acute setting, emphasis should be placed on the accurate assessment of weight and height in the context of the patient's current intake and clinical presentation as part of routine clinical assessment, as this may be more effective than the current screening tools available. We have proposed a strategy (figure 3) for the nutritional assessment and management of children who are unwell.
Proposed strategy for the nutritional assessment and management of children who are unwell. BMI, body mass index.
Acknowledgments
The authors wish to thank all the patients and their families for being part of this audit and the nursing staff for their assistance on PAU.
References
Footnotes
Contributors PCT, RMB, SAW and LVM participated in the design of the study. PCT carried out the data collection. PCT and LVM completed the data and statistical analyses and drafted the manuscript. All authors edited, read and approved the final manuscript.
Funding PCT was funded by the UK National Institute of Health Academic Foundation Programme. LVM funded by NIHR Health Education England (Wessex) Post Doctoral Fellowship.
Competing interests None declared.
Provenance and peer review Not commissioned; externally peer reviewed.