Article Text

Abstract
Objective To investigate trends in health inequality among children and young people between 1999 and 2009, using outcomes consistent with the current NHS reforms.
Design/data Secondary analysis of participants aged 0–24 in the Health Surveys for England (HSE) undertaken in 1999, 2004, 2006 and 2009.
Main outcome measures Changes in the absolute and relative risks of four health outcomes by deprivation tertiles, based on occupation of the head of household
▸ self/parent-reported general health,
▸ presence of a long-standing illness (LSI),
▸ obesity
▸ smoking.
Results No indicator showed a reduction in relative or absolute inequality between 1999 and 2009. For children (0–12 years), the relative risk comparing the most and least deprived tertiles increased significantly for poor general health (1999:1.6 (95% CI 1.2 to 2.2); 2009:3.9 (2.4 to 6.2), while the absolute difference in LSI prevalence(%) increased from 1.3 (−2.9 to 5.5) to 7.4 (3.6 to 11.4). Among young people (13–24 years), the absolute difference in LSI prevalence increased from −5.9 (−10.9 to −1.1) to 3.1 (−4.1 to 10.7). Absolute inequality in having tried smoking among children aged 8–15(%) increased significantly in the first half of the decade before decreasing in the second half (1999:3.3 (−1.1 to 7.7); 2004:14.1 (9.6 to 18.8); 2009:4.1 (0.1 to 8.8)). However, the increase in absolute inequality for smoking prevalence among young adults (16–24 years) was maintained throughout the decade (1999:−7.0 (−15.6 to 1.3); 2004:11.6 (3.7 to 20.0); 2009:8.2 (−0.3 to 16.9)).
Conclusions The national programme between 1999 and 2009 was not successful in reducing inequality in four key indicators of health status and future health risk among children and young people. Some inequality measures for general health, LSI prevalence and smoking increased over this time.
- Comm Child Health
- Epidemiology
This is an Open Access article distributed in accordance with the Creative Commons Attribution Non Commercial (CC BY-NC 3.0) license, which permits others to distribute, remix, adapt, build upon this work non-commercially, and license their derivative works on different terms, provided the original work is properly cited and the use is non-commercial. See: http://creativecommons.org/licenses/by-nc/3.0/
Statistics from Altmetric.com
What is already known on this topic?
-
Between 1999 and 2010, an ambitious government strategy aimed to reduce health inequalities. The gap in infant mortality rates between different socio-economic groups decreased slightly over this period.
-
The current government has introduced a statutory duty to reduce inequality, and a new monitoring framework focused on outcomes that matter most to children, young people and their families.
What this study adds
-
There was no reduction in absolute or relative inequality for general health, presence of a LSI, obesity or smoking among children and young people between 1999 and 2009.
-
All four outcomes showed a significant increase in inequality at some point during the strategy, although absolute inequality in smoking among children aged 8–15 increased between 1999 and 2004 before decreasing again by 2009.
-
We propose that expected increases in child poverty may exacerbate the challenge of reducing child health inequalities in the future and we call for a concerted policy response.
Background
Health inequalities may be defined as the gap in health outcomes between different groups in the society, for example, between people at different ends of the socio-economic spectrum. Between 1999 and 2010, the English Government pursued a programme to reduce health inequalities described as more ‘systematically developed, better resourced, more stringently implemented and more extensively monitored’ than anywhere else in Europe.1 The programme included increases to benefit payments; higher spending on health, education and housing; and a number of specific initiatives such as policies to reduce smoking and to establish ‘Sure Start’ centres for low-income families. This strategy of the English has influenced similar inequality strategies in other countries, notably The Netherlands, Sweden, Norway and Finland.1 More recently, the 2011 Rio Political Declaration committed all WHO member states to take action to reduce health inequalities.
Adoption of such strategies has been limited by the lack of evidence that they are effective. Recent research of the English population shows that the gap between affluent and more deprived groups increased between 2003 and 2008 for multiple adult health risks such as smoking, poor diet and lack of physical exercise.2 Much of the extra money in England was spent on children's services, and inequality did decrease for infant mortality and some other child health indicators over this period,3 including child road accidents and teenage conceptions.4 ,5 However, the improvements were small and the programme targets were not met; previous authors have suggested that this failure may reflect the narrowness of the chosen targets and unrealistic expectations that intergenerational cycles of poverty could be changed so quickly.1 ,6
Under the current health reforms, the Government has introduced a statutory duty to reduce health inequality,7 and a change towards using a wider range of health indicators that are more meaningful to people.8 Regarding children and young people, the previous Secretary of State for Health commissioned advice from a forum of experts, who recommended that future inequality monitoring should include a range of outcomes that promote the voice of young people and take a life course perspective.9
The aims of this paper are to investigate inequality trends between 1999 and 2009 among English children and young people, using measures that meet the above criteria. Drawing on health outcomes identified as important by children and young people themselves,10 we analyse data on two measures of current health (general health and presence of a long-standing illness), and two leading risk factors for future ill-health (smoking and obesity).
Methods
Data
Nationally-representative data were used from 4 years of the Health Survey for England (HSE) (1999, 2004, 2006, 2009) accessed via the UK Data Archive (UKDA) (http://www.data-archive.ac.uk). These represent the start, middle and finish of the main lifetime of the strategy, supplemented by 2006 in which a boost sample of participants under 16 was surveyed. We chose to analyse children, adolescents and young adults (0–24 years) because these represent the key developmental years in which social determinants influence adult life trajectories and future disease burden.11
Indicators
We selected four health indicators for which data were available in all four surveys, in a format that could be disaggregated by age and socio-economic status. Two reflected the parent's/carer's/young person's assessment of health, and the remainder were two of the top ten risk factors for poor health in later life as identified by the WHO Global Burden of Disease study.12
For self-assessed general health, a five-item Likert response was aggregated to create a binary outcome (very good/good vs fair/bad/very bad). The second indicator used the question, ‘Do you have a LSI?’ which had a binary response (yes/no). All three questions were addressed to young people starting from the age of 13. Parents/carers were asked to respond on behalf of children up to the age of 12.
For respondents aged 8–15, the smoking indicator asked whether they had ever smoked; for those aged 16+, we analysed whether they were current smokers. Obesity was assessed using body mass index (BMI), calculated from height and weight values measured at the time of the interview. Following previous literature, obesity in those aged 2–16 was defined as BMI greater than or equal to the 95% centile of the reference population. Children under the age of two were excluded. Above the age of 16, a BMI threshold of greater than or equal to 30 kg/m2 was used.
All analyses of HSE data defined socio-economic status by the occupation of the head of household (1999) or household reference person (2009). Approximate tertiles were created containing higher occupations (Classes I, II), intermediate occupations (III non manual and III manual), and lower occupations (IV, V). Where the household reference person was unemployed, they were classified by information about the previous occupation. Members of the armed forces, those who had never worked and those with insufficient information about occupation were excluded.
Analysis
All analyses were weighted for demographic and sampling factors to produce nationally representative results. The weighting procedure for 1999 differed from subsequent surveys in that no adjustment was made for non-response bias. Full details of these procedures have been published previously.13 The 2006 and 2009 surveys used a boosted sample of under 16s, and therefore, used separate weighting values for respondents up to this age.
Age bands for each indicator were determined by the survey protocol. For general health and LSI, responses by the young people themselves (13–24 years) were analysed separately and those by proxy reports by parents/carers for children 0–12 years. To allow comparison, only the core sample of 13–16s was used in 2006 and 2009, excluding the boost sample. For smoking, different questions were asked of respondents aged 8–15 and 16–24 in each survey year; thus we used these age bands in analysis. Smoking analyses again excluded 16-year-olds from the boost sample. As described above, obesity is defined differently at different ages.2–24 Full details of the HSE methodology have been published previously.13 ,14
The proportion of children and young people reporting each adverse health outcome was calculated by socio-economic status tertile and age band. Using the exact difference in proportion method, the mean and SE were calculated for the difference in each health outcome between the most and least deprived groups. T tests were then used to calculate whether the degree of absolute inequality changed significantly between each survey. To correct for multiple comparisons, the results tables report differences as significant when p<0.01 (two-tailed).
Secondly, the relative risk and 95% CIs for poor health between the most and least deprived tertiles were calculated for each health outcome. We assessed differences between surveys by calculating the z score of the ratio between relative risks.
Results
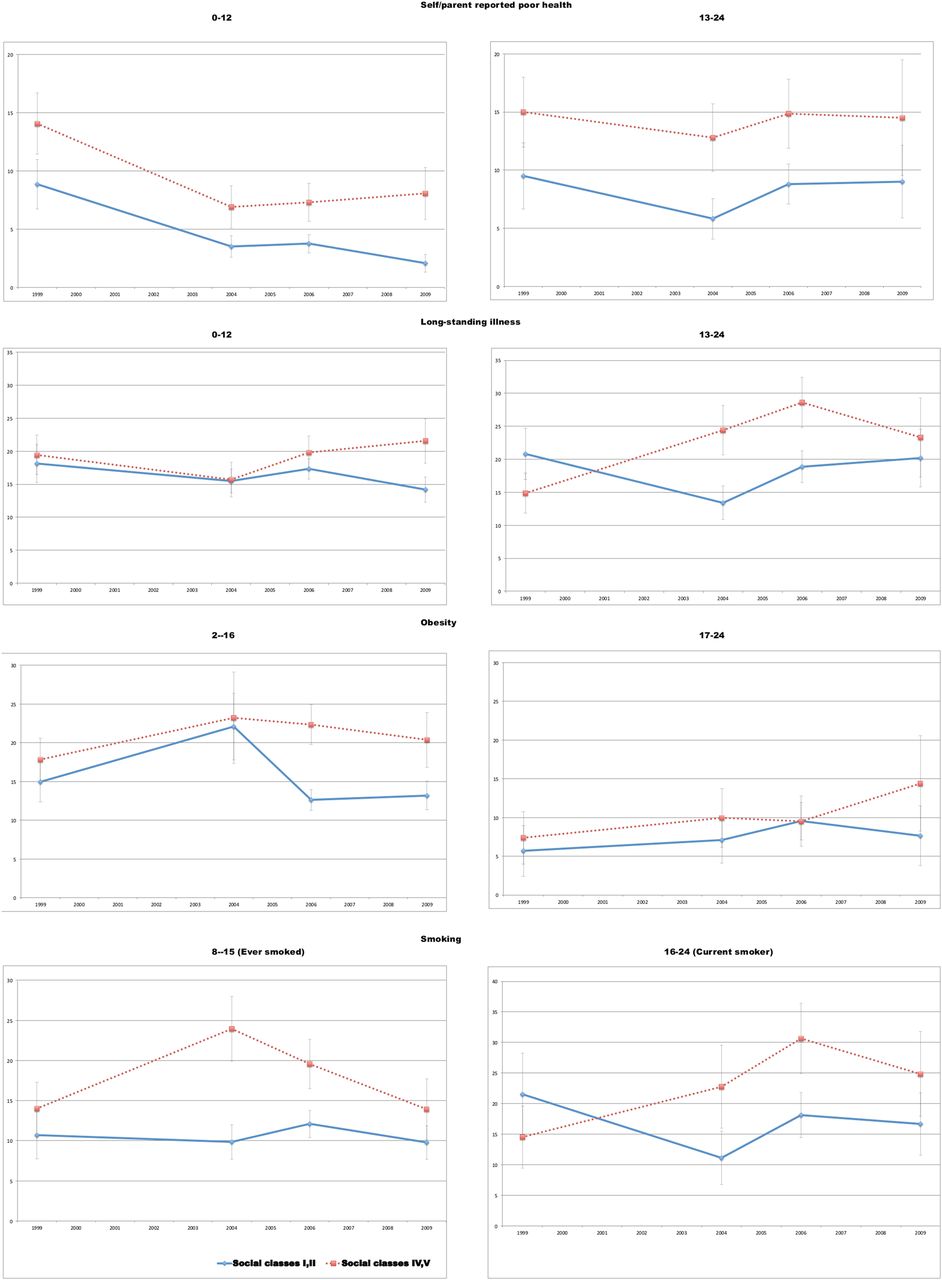
The number of respondents and proportion reporting each health outcome are presented by deprivation group in table 1; the proportions and 95% CIs are also shown in figure 1. The absolute differences between the most and least deprived groups are presented in table 2, followed by the relative differences in table 3.
Trends in selected health outcomes among children and young people by social class, England, 1999–2009
Absolute differences in selected health outcomes between most and least deprived groups, England, 1999–2009
Relative risk of selected health outcomes between most and least deprived groups, England, 1999–2009
Poor health/health risk by social class and age group, England, 1999–2009 (%)
In 1999, poor general health was reported by 8.8% of children aged under 12 in the least deprived tertile, compared to 14.1% of the most deprived children. By 2009, the prevalence of poor general health had fallen for both groups, to 2.1% and 8.1% respectively. Thus, the absolute difference between social groups changed minimally from 5.2% to 6.0%. However, the relative risk of poor general health related to greater deprivation increased significantly from 1.6 (95% CI 1.2 to 2.2) in 1999 to 3.9 (2.4 to 6.2) in 2009 (p=0.003). Relative inequality in 2009 was also marginally greater than in 2004 (RR 1.9 (1.4 to 2.6) p=0.02)) and 2006 (RR 2.0 (1.4 to 2.9) p=0.01).
Among children under 12, the absolute difference in prevalence of long-standing illness was higher in 2009 (7.4% (95% CI 3.6 to 11.4) than 1999 (1.3% (−2.9 to 5.5), p=0.04) and 2004 (0.2% (−2.9 to 3.5), p=0.009). The relative risk was higher in 2009 (1.5 (1.2 to 1.9) than all previous years (1999: RR=1.1 (0.9 to 1.3), p=0.02; 2004: RR=1.0 (0.8 to 1.2), p=0.005; 2006: RR=1.1 (1.0 to 1.3), p=0.03). Among adolescents (13–24 years), the absolute difference was lower in 1999 (−5.9% (−10.9 to −1.1)) than all other years (2004: 11.0% (6.5 to 15.6), p<0.001; 2006: 9.8% (5.3 to 14.3), p<0.001; 2009: 3.1% (−4.1 to 10.7), p=0.003). However, the difference in 2009 was slightly lower than in 2004 (p=0.04). Relative risk showed a similar pattern, with less inequality in 1999 (RR=0.7 (0.5 to 0.9)) than all other years (2004: RR=1.8 (1.1 to 3.0), p<0.001; 2006: RR=1.5 (1.1 to 2.0), p<0.001; 2009: RR=1.2 (0.8 to 1.6), p=0.03) but a small reduction between 2006 and 2009 (p=0.03).
Among young adults, no significant changes were seen in the effects of inequality on obesity. However, among children aged 2–16, the relative risk of obesity related to deprivation increased between both 1999 (RR=1.2 (0.9 to 1.5)) and 2004 (RR=1.1 (0.8 to 1.4)) and 2006 (RR=1.8 (1.5 to 2.1)) (p=0.005 in both cases). Absolute inequality in 2006 (9.7% (6.9 to 12.7) was significantly higher than in 1999 (2.9% (−0.9 to 6.7), p=0.005) and marginally higher than in 2004 (1.1% (−5.9 to 8.6), p=0.04).
Inequality in the proportion of 8–15-year-olds who had ever smoked increased sharply between 1999 and 2004 (Absolute difference 3.3% (−1.1 to 7.7) vs 14.1% (9.6 to 18.8), p=0.01; RR 1.3 (0.9 to 1.9) vs 2.4 (1.8 to 3.2), p=0.008). The relative risk decreased marginally after 2004 (2006: 1.6 (1.3 to 2.0), p=0.02; 2009: 1.4 (1.0 to 2.0), p=0.02)) and the absolute difference also decreased between 2004 and 2009 (to 4.1% (0.1 to 8.8), p=0.003)).
A more consistent trend was seen for smoking by young people16–24 where both absolute and relative inequality increased when comparing 1999 with all other years (all p<0.001). Absolute differences: 1999: −7.0%(−15.6 to 1.3); 2004: 11.6% (3.7 to 20.0); 2006: 12.5% (5.8 to 19.4); 2009: 8.2% (−0.3 to 16.9). Relative risks: 1999: 0.7 (0.4 to 1.1); 2004: 2.0 (1.2 to 3.4); 2006: 1.7 (1.3 to 2.2); 2009: 1.5 (1.0 to 2.3).
Discussion
Whereas inequality in infant mortality decreased over this period, we found that inequality in general health, long-standing illness, smoking and obesity among children and young people either remained unchanged or increased between 1999 and 2009. No outcome showed two significant, successive increases in inequality over time, but all showed a significant increase in at least one comparison between 1999/2004 and 2006/2009.
A strength of this study is the use of nationally-representative data collected in a consistent way across 10 years of the previous government's strategy. The outcome measures were chosen to reflect a broader view of health than the previous indicator, offering a new perspective on the impact of previous policies, with potential to inform future inequality strategies.
Limitations
The changes to the weighting procedures means that some caution should be used in comparing data from different surveys, particularly the 1999 survey, which did not adjust for non-response bias. However, each survey represents the most accurate national data available for that year, and it is unlikely that different weighting would materially change the overall findings.
A broader limitation of the study is the duration of only 10 years. Much of the policy focus was on very young children, where previous research has shown that the effect of interventions may be best seen when the subjects reach adolescence and adulthood.15 It is interesting to note that inequality in long-standing illness and smoking among adolescents increased in the first half of the decade studied before plateauing or decreasing in the second half of the decade. This is consistent with infant mortality trends, which showed a greater reduction in inequality in the second 5 years of the inequality strategy than the first 5 years.3 However, the period 2004–2009 did see a significant increase in inequality for general health, obesity and for smoking among young adults.
Policy implications
The importance of the early years for lifelong health is widely recognised by researchers and policy makers,7 ,15 ,16 suggesting that an increase in health inequalities in this group may have important consequences for future population health.
These data also highlight significant inequality in the health experienced by older children and adolescents, who are often less visible in national data.17 Behavioural risk factors are the leading cause of death in developed countries,18 and are largely acquired in this age group.19 Similarly, adolescence and young adulthood are a critical period for the emergence of lifelong health inequalities,20 which are particularly topical at a time of high youth unemployment in England and across Europe. The findings are very relevant to current policy, suggesting a way in which the statutory duty to reduce health inequalities can be monitored at national level, without the cost of establishing new data sources.
The increases in inequality shown by these data have occurred during a period of reduced child poverty21 and reduced inequalities in other indicators such as infant mortality.3 There is currently broad political consensus in the UK regarding the importance of tackling health inequalities, especially among children. Views differ about whether the focus should be on reducing relative or absolute inequality, but these data show a significant increase in both relative and absolute inequality in recent years.
The current financial climate increases both the urgency of tackling inequalities and the challenge of securing the necessary resources, leading UNICEF to predict a major increase in child poverty over the next decade if current policies continue.22 Proposed changes to NHS resource allocation are also expected to transfer healthcare funding away from younger, more deprived areas to older, more affluent ones.23 Part of the case for action is the moral argument discussed by Law et al6 who demonstrate that child health inequalities are avoidable and reflect greater injustice than adult inequalities, as children are not equally responsible for the determinants of their health. However, the case also rests on robust evidence and economic analysis, with Michael Marmot and others having demonstrated the costs of failing to address social determinants of health in the crucial early and adolescent years.16 International evidence over the last two decades shows that effective policies can lead to sustained reduction in social inequalities affecting children and young people.24 We believe a concerted policy response may be needed to achieve such a reduction in England in the future.
We do not believe these data should be interpreted as evidence that the previous Government's inequality strategy was misguided or misdirected. In contrast, it is to the credit of the Government that an ambitious programme was implemented and such an evaluation is possible. Inequality stabilised or decreased for some indicators over the second 5 years of the programme and it is possible that greater benefits of this investment will become apparent in the future. As noted by previous authors, it is also possible that a much greater increase in inequality would have occurred in the absence of such a strategy.1 Our hope is that this paper will contribute to a more informed international debate about the most effective interventions to reduce child health inequality and the most realistic time frames over which to evaluate their impact.
Conclusion
Despite a co-ordinated Government strategy to address health gaps between different socioeconomic groups, there was no reduction of inequality in health status and key risk factors in children and young people between 1999 and 2009; in fact, there was some evidence of increased inequality.
Previous studies have provided little information on many health inequalities that matter most for children, young people and their families outside of infancy. A broader view of health outcomes in this age group is essential for improving population health and is emphasised in current government policy.
We believe these findings are particularly relevant at a time when a substantial increase in child poverty is expected, and we propose that concerted action is likely to be needed to fulfil the statutory duty to reduce health inequalities in the future.
Acknowledgments
Correction notice This paper has been amended since it was published Online First. In table 3, in the row called Obesity, 17-24, the authors have noticed some small data errors in these numbers. These have now been corrected.
Acknowledgments
Acknowledgements We thank Steve Morris, Anna Pearce, and Jessica Sheringham for their advice on methodology.
References
Footnotes
-
Contributors All authors contributed to the planning and writing of the manuscript. DSH performed the statistical analyses and is the guarantor.
-
Competing interests None.
-
Provenance and peer review Not commissioned; externally peer reviewed.