Article Text

Abstract
Objectives In rheumatoid arthritis (RA), treat-to-target strategies require instruments for valid detection of joint inflammation. Therefore, imaging modalities are increasingly used in clinical practice. Optical spectral transmission (OST) measurements are non-invasive and fast and may therefore have benefits over existing imaging modalities. We tested whether OST could measure disease activity validly in patients with RA.
Methods In 59 patients with RA and 10 patients with arthralgia, OST, joint counts, Disease Activity Score (DAS) 28 and ultrasonography (US) were performed. Additionally, MRI was performed in patients with DAS28<2.6. We developed and validated within the same cohort an algorithm for detection of joint inflammation by OST with US as reference.
Results At the joint level, OST and US performed similarly inproximal interphalangeal-joints (area under the receiver-operating curve (AUC) of 0.79, p<0.0001) andmetacarpophalangeal joints (AUC 0.78, p<0.0001). Performance was less similar in wrists (AUC 0.62, p=0.006). On the patient level, OST correlated moderately with clinical examination (DAS28 r=0.42, p=0.001), and US scores (r=0.64, p<0.0001). Furthermore, in patients with subclinical and low disease activity, there was a correlation between OST and MRI synovitis score (RAMRIS (Rheumatoid Arthritis MRI Scoring) synovitis), r=0.52, p=0.005.
Conclusions In this pilot study, OST performed moderately in the detection of joint inflammation in patients with RA. Further studies are needed to determine the diagnostic performance in a new cohort of patients with RA.
- Rheumatoid Arthritis
- Ultrasonography
- Magnetic Resonance Imaging
- Synovitis
- Disease Activity
This is an Open Access article distributed in accordance with the Creative Commons Attribution Non Commercial (CC BY-NC 4.0) license, which permits others to distribute, remix, adapt, build upon this work non-commercially, and license their derivative works on different terms, provided the original work is properly cited and the use is non-commercial. See: http://creativecommons.org/licenses/by-nc/4.0/
Statistics from Altmetric.com
Introduction
The prognosis of rheumatoid arthritis (RA) has greatly improved with treatment targeting at remission.1 This requires instruments for valid detection of disease activity. Generally, the 28-joint Disease Activity Score (DAS28) is used for this. However, DAS28 has not been validated for use in individual patients, has considerable test–retest variability2 ,3 and is also influenced by several factors unrelated to joint inflammation.4 ,5 Imaging techniques such as ultrasonography (US) and MRI are more sensitive for the detection of synovitis than physical assessment,6 but they are not applied as standard assessments yet.7 There is an unmet need for objective, fast measurement of disease activity at low cost, applicable during outpatient visits.
Optical spectral transmission (OST) measures the transmission of light of specific wavelengths quantitatively. The same technique is used in pulse oximetry.8 In the presence of synovitis, the transmission of light decreases,9 ,10 which is due to vascular changes.11 There is one commercially available optical device which measures reflection of light on illumination, before and after intravenously administrated indocyanine green (fluorescence optical imaging (FOI)).12 ,13 OST measures the transmission of light before and after temporarily impeding the venous return of blood from the forearms. Using this approach, OST through a single joint (proximal interphalangeal (PIP)) has shown to correlate with the detection of synovitis by physical examination.14 A multijoint OST device (Full Hand Prototype (FHP)) has been developed, which was used in our current study. In this pilot study, we tested whether the FHP could measure disease activity accurately in patients with RA.
Methods
Subjects
Fifty-nine patients with RA and 10 controls with non-inflammatory arthralgia of unknown cause were recruited at the outpatient clinics of the departments of rheumatology at the University Medical Center Utrecht (UMCU) and Regional Rheumatology Center Eindhoven between November 2011 and June 2012. The aim was to include 20 patients for each category of disease activity, DAS28<2.6, 2.6≤DAS28≥5.1, DAS28>5.1. Preliminary stratification during recruitment was based on the DAS28 at the time of the screening visit at the outpatient clinic. Final stratification was based on the DAS28 measured at the day of examination, which resulted in 20 patients with DAS28<2.6, 26 with 2.6≤DAS28≥5.1 and 13 with DAS28>5.1. Time between recruitment and enrolment was less than 3 weeks. In all subjects clinical assessments, US and OST were performed. In order to be clinically useful, an imaging technique should be able to measure subclinical disease activity. To examine this in more detail, we performed in patients with DAS28<2.6 at recruitment, not only US but also MRI. Exclusion criteria were age less than 18 or over 90 years, significant deformities of the hand, wheelchair dependency, surgery of the wrist or hand in the preceding 3 months, light hypersensitivity, pregnancy and/or breastfeeding. In the MRI subgroup only, additional exclusion criteria were applied: allergy to gadolinium, presence of MRI-incompatible metal objects in any part of the body, renal insufficiency (defined as Modification of Diet in Renal Disease (MDRD) <30 mL/min/1.73 m2) and/or claustrophobia. All measurements were performed within a window of 4 h at the University Medical Center Utrecht. The study complied with the Declaration of Helsinki. The study protocol was approved by the ethics committees of the UMCU and Maxima Medical Center Eindhoven. All study participants gave written informed consent prior to study inclusion.
Clinical assessment
Comorbidities, current drug use, presence of Raynaud's phenomenon and the presence of visible wounds on hands or wrists were recorded. Subjects filled out a global assessment of disease activity on a Visual Analogue Scale (0–100). A swollen and tender joint count was performed by a physician (KLT) and a research nurse (AJLM) in all subjects, in random order. The examiners were blinded to the result of each other's assessments and other study measurements. The kappa for inter-rater agreement for tender joints was 0.50 and for swollen joints 0.52.
Ultrasonography
US was performed by one experienced examiner (DFTC (physician)) who was blinded to the results of other study measurements. A MyLab 60 system (Esaote, Genua, Italy) with an 18-6 MHz linear array transducer was used. Grey-scale US (GSUS) was performed of metacarpophalangeal (MCP) 1–5 (dorsal side), (P)IP 1–5 of hands (volar side), radiocarpal and mid-carpal joints (dorsal side) and flexor and extensor tendons of fingers and wrists. Patient and probe positioning were according to EULAR guidelines.15 Synovitis on GSUS and power Doppler US (PDUS) was classified using Outcome Measurements in Rheumatology Clinical Trials (OMERACT) definitions of ultrasonographic joint pathology and graded semi-quantitatively according to a modification of Szkudlarek's grading system,16 combining the criteria for joint effusion and synovial thickening. PDUS was performed only if the GSUS synovitis score was greater than 0. This study was designed well before the introduction of the OMERACT scoring system for tenosynovitis.17 At the time, no generally accepted criteria were available and the range of reference values for hypoechoic or anechoic rims around a tendon is very broad. Therefore, we chose to define GSUS tenosynovitis as a hypoechoic or anechoic rim around a tendon exceeding 2 mm.18 This was registered as being absent or present. PDUS of tendons was performed in case of (any) hypoechoic or anechoic thickened tissue with or without fluid within the tendon sheath seen in two perpendicular planes. This was registered as being absent or present.
Grade 1 GSUS synovitis has also been found in healthy subjects18 ,19 and is of limited prognostic value in RA.19 ,20 Therefore, US inflammation was defined as (GSUS synovitis >1 and/or PDUS synovitis >0 and/or GSUS/PDUS tenosynovitis >0). For individual subjects, the number of joints with inflammation was counted (US joint count). Also, the sum of GSUS synovitis, GSUS tenosynovitis, PDUS synovitis and PDUS tenosynovitis scores were calculated (US joint index).
MRI
Imaging was performed on a 1.5 Tesla MRI. (Philips Ingenia 1.5T, Philips Healthcare, Eindhoven, The Netherlands). The following sequences were acquired: Coronal T1-weighted turbo spin-echo images (TR/TE, 450/7.2; matrix size, 328×159; field of view, 18 cm; slice thickness, 2.5 mm), transversal T1-weighted turbo spin-echo images (TR/TE, 500/12; matrix size, 300×185; field of view, 12 cm; slice thickness, 2.5 mm), Coronal T2-weighted short-tau inversion recovery images (TR/TE, 3251/150; inversion time, 150; matrix size, 328×140; field of view, 18 cm; slice thickness, 2.5 mm). T1 images were acquired before and after intravenous gadolinium contrast administration. Images were scored by one experienced MRI reader and rheumatologist according to OMERACT Rheumatoid Arthritis MRI Scoring (RAMRIS) method, evaluating synovitis in MCP2-5 and the wrists. The reader was blinded to the results of other study measurements. The same image set was scored twice with at least a 2-week interval; results were averaged. The kappa for intrarater agreement was 0.25; if joints with synovitis grade 1 were excluded, kappa was 0.80. Similar to US, the number of joints with synovitis was counted (MRI joint count).
Optical transmission measurements
OST measurements were performed with the FHP in a standardised way operated by a rheumatology nurse (AJLM). Both hands were inserted through cylindrical openings that contained pressure cuffs. light-emitting diode (LED) lights (wavelengths of 660 and 810 nm) illuminated the (P)IP, MCP and wrist joints of both hands and reference areas from the palmar side. Light transmitted through the joints and reference areas was recorded continuously at the dorsal side by charge-coupled device (CCD) camera with a frame rate of at least six per second, alternatingly for the 660 nm wavelength, the 810 nm wavelength and without illumination (background image). A complete measurement was performed within 90 s: first, inflation of the cuff to 5 mm Hg (15 s); second, inflation of the cuff to 50 mm Hg (60 s) and finally deflation of the cuff (15 s).
Image analysis was performed by PBLM using in-house developed software (InFlame RA-120159, December 10, 2012), blinded to the results of other study measurements. Regions of interest (ROI) were traced manually for all joints (joint ROI) and automatically for a position distal to each joint (reference ROI) based on the pictures taken by the CCD camera. Landmarks for joint ROI were broadening of the phalanx and wrinkles of the skin for (P)IP-joints, web between the fingers for MCP joints and curvatures of distal radius and ulna. An ROI consisted of approximately 100 pixels. The recorded intensity of each pixel in a ROI versus the measurement time was fitted to a curve representing the response to inflation and deflation of the pressure cuff, separately for the 660 nm and the 810 nm wavelength (the optical transmission response curve, see online supplementary figure S1). The optical response curve of a pixel could be described by eight curve parameters per wavelength, that is, 16 curve parameters for both wavelengths combined. The average of a curve parameter over pixels in an ROI was calculated, giving 16 parameters per ROI. Reference ROIs allowed for correction for systemic effects unrelated to inflammation, such as body temperature and the use of vasoactive medication. This was done by subtracting reference ROI parameters from joint ROI parameters and then dividing this difference by the average of reference ROI parameters and joint ROI parameters. Thus, image analysis yielded 16 normalised parameters per joint for use in regression analyses.
Statistical analysis
We developed and internally validated an algorithm for detection of joint inflammation by OST with US as reference by multiple regression analysis. Data of all patients were used in the development and internal validation. The dependent variable was defined as the maximum of GSUS and PDUS scores for synovitis and tenosynovitis (range 0–3), and the normalised joint parameters as independent variables. A stepwise forward selection procedure with adjusted R2 testing was used to determine which variable to add. This was repeated until either R2 no longer increased (cut-off value of 0) or, to prevent overfitting of the model, a maximum of four parameters had been selected. This was done separately for each joint region, so separately for (P)IP, MCP and wrists. We tested whether individual observations exerting undue influence on the coefficients in the regression analysis (outliers) were present and if so they were removed from the development phase. The regression analysis with the four parameters as independent variables per joint region was then performed using leave-one-out cross validation to detect and prevent overfitting. In this analysis, the model is repeatedly refit, leaving out at each fit a different, single patient. The regression coefficients thus obtained are used to calculate OST values for the left-out observation. For individual subjects, an OST joint index over all joints ((P)IP 1–5, MCP 1–5 and wrists of both hands) was calculated. The diagnostic performance of OST was compared with clinical examination, DAS28, US and MRI by receiver operating curve analyses with 95% CI estimation, separately at the patient level (one score per patient) and individual joint level (one score per joint). Presence (yes/no) of (teno)synovitis on US was used as reference. Correlations were calculated using Spearman's rank correlation coefficient. Differences between group medians were tested for significance using either the Mann–Whitney U test for two groups or the Kruskal–Wallis one-way analysis of variance for three or more groups. p Values below 0.05 (two-sided tests) were considered to be statistically significant. Inter- and intrarater agreement was calculated by the kappa statistic. The multiple regression analyses were performed using Hemics in-house software (InFlame RA-120159), all other analyses by SPSS version 21.
Results
Subjects
Demographic and clinical data are reported in table 1. Table 2 depicts the number and severity of affected PIP, MCP and wrist joints per patient with clinical examinations, US and OST.
Patient demographics and clinical data
Involvement of wrists, MCP and PIP joints
Optical transmission
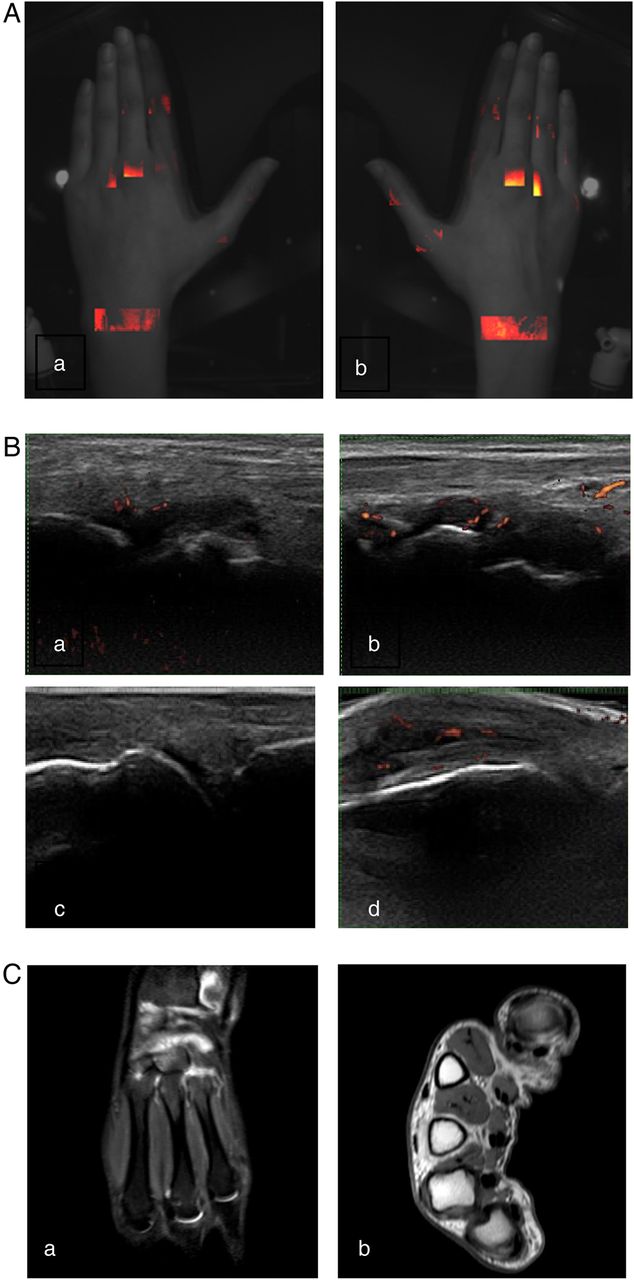
All subjects tolerated the OST measurements well; no adverse events or side effects were observed. Figure 1 depicts an example of the results of OST, US and MRI in a patient in clinical and DAS28 remission. One patient was identified as an outlier. We looked into reasons for this, such as presence of Raynaud's phenomenon or use of vasoactive drugs. We could not identify an explanation. This patient was therefore left out of the analyses for the development of the algorithm, but not of the validation. This was a patient with many active joints. The OST scores of the subjects with Raynaud's phenomenon and/or using drugs that may alter peripheral blood flow were not outliers.

Subclinical inflammation in a patient with rheumatoid arthritis in clinical remission. Representative images of a patient without clinically detectable arthritis. All imaging techniques show synovitis of both wrists and metacarpophalangeal (MCP)3 of the right hand. Both hands with (A) Full Hand Proto, (B) grey-scale and power Doppler ultrasonography of joints of left (a) and right wrist (b) and left and right MCP3 (c and d) (C) MRI of right wrist T2 short-tau inversion recovery (STIR) (a) and MCP joints of the right MCP (b, T1 with gadolinium enhancement).
Comparison of OST with clinical examination, US and MRI
Median OST was different between the four groups (p=0.001). The correlation coefficients between OST and US were higher than those between OST and clinical examination (figure 2). The correlation coefficients between OST and MRI and OST and clinical examination were about similar; however, they are difficult to compare since MRI was only performed in patients with remission or low disease activity and restricted to wrist and MCP joints of one hand.
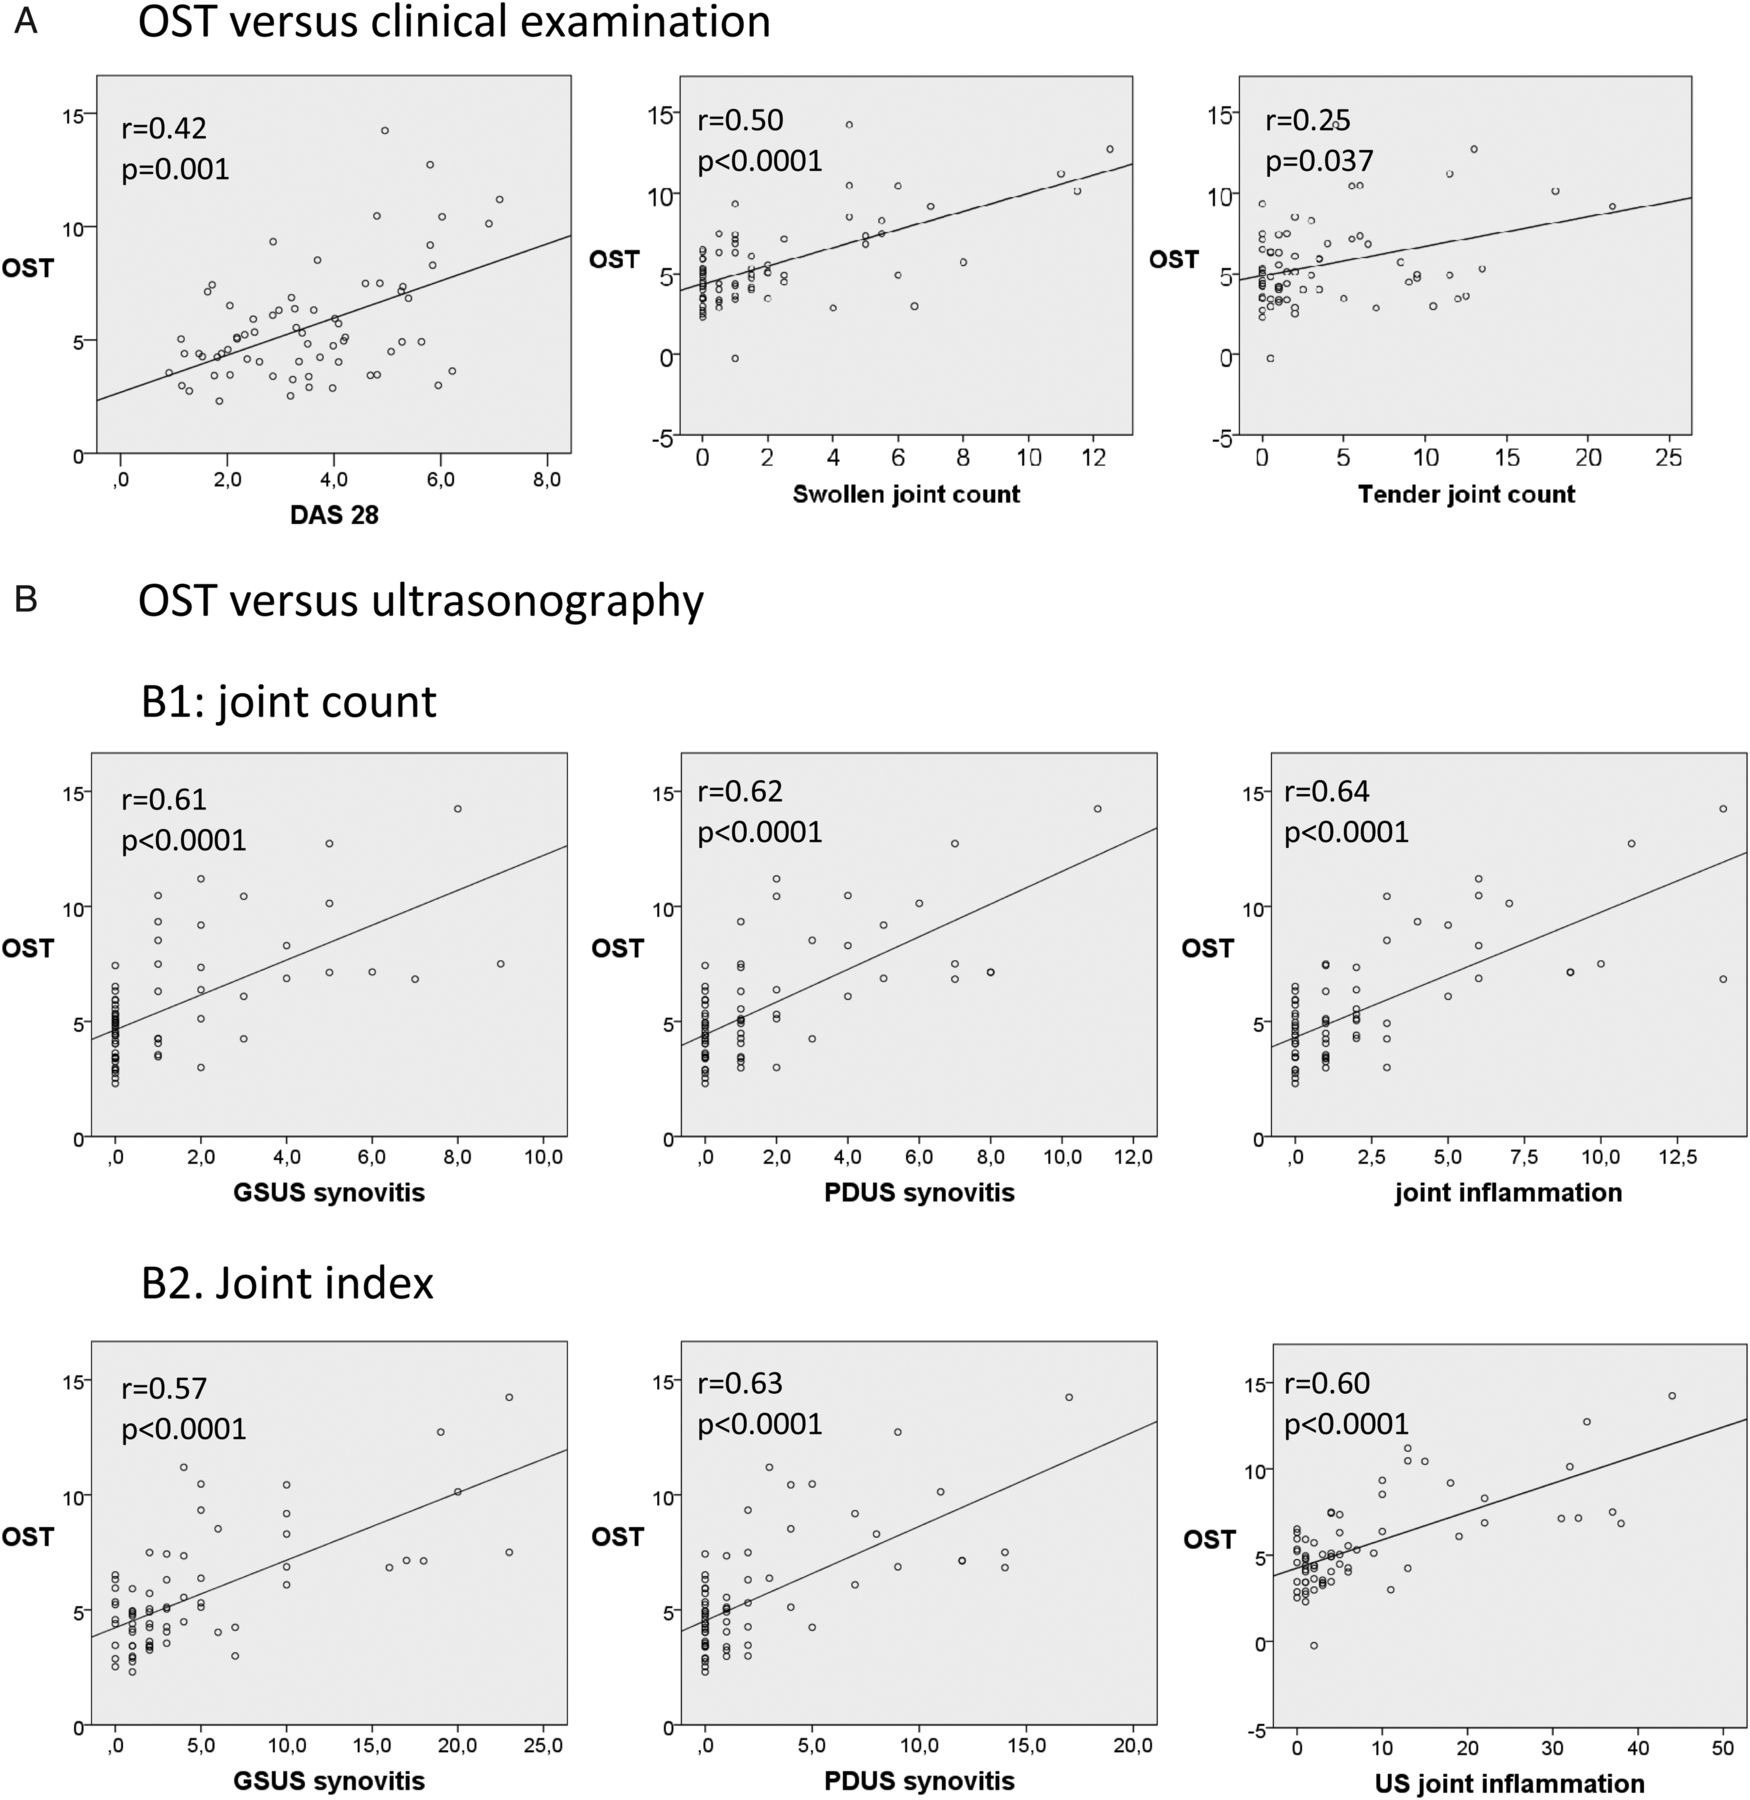

Patient level: relationship between optical spectral transmission (OST) and clinical examination, ultrasonography (US) and MRI. (A) Correlation between OST and clinical examination (DAS28, swollen joint count of 28 joints and tender joint count of 28 joints). (B) Correlation between OST and US, upper three panels with count of number of joints with grey-scale US (GSUS) synovitis (left panel), count of number of joints with power Doppler US (PDUS) synovitis (middle panel) and count of joints with inflammation with US (right panel). US inflammation was defined as (GSUS synovitis >1 or PDUS synovitis >0 and/or GSUS/PDUS tenosynovitis >0). Lower three panels show correlation of OST with joint indexes (sum of semi-quantitative US scores) of GSUS synovitis (left panel), PDUS synovitis (middle panel) and US inflammation (right panel). (C) Correlation between OST and MRI. Rheumatoid Arthritis MRI Scoring (RAMRIS) (left panel) and its components (RAMRIS synovitis (middle panel) and RAMRIS bone marrow oedema (right panel)).
Joint level: comparison of OST scores with those at US
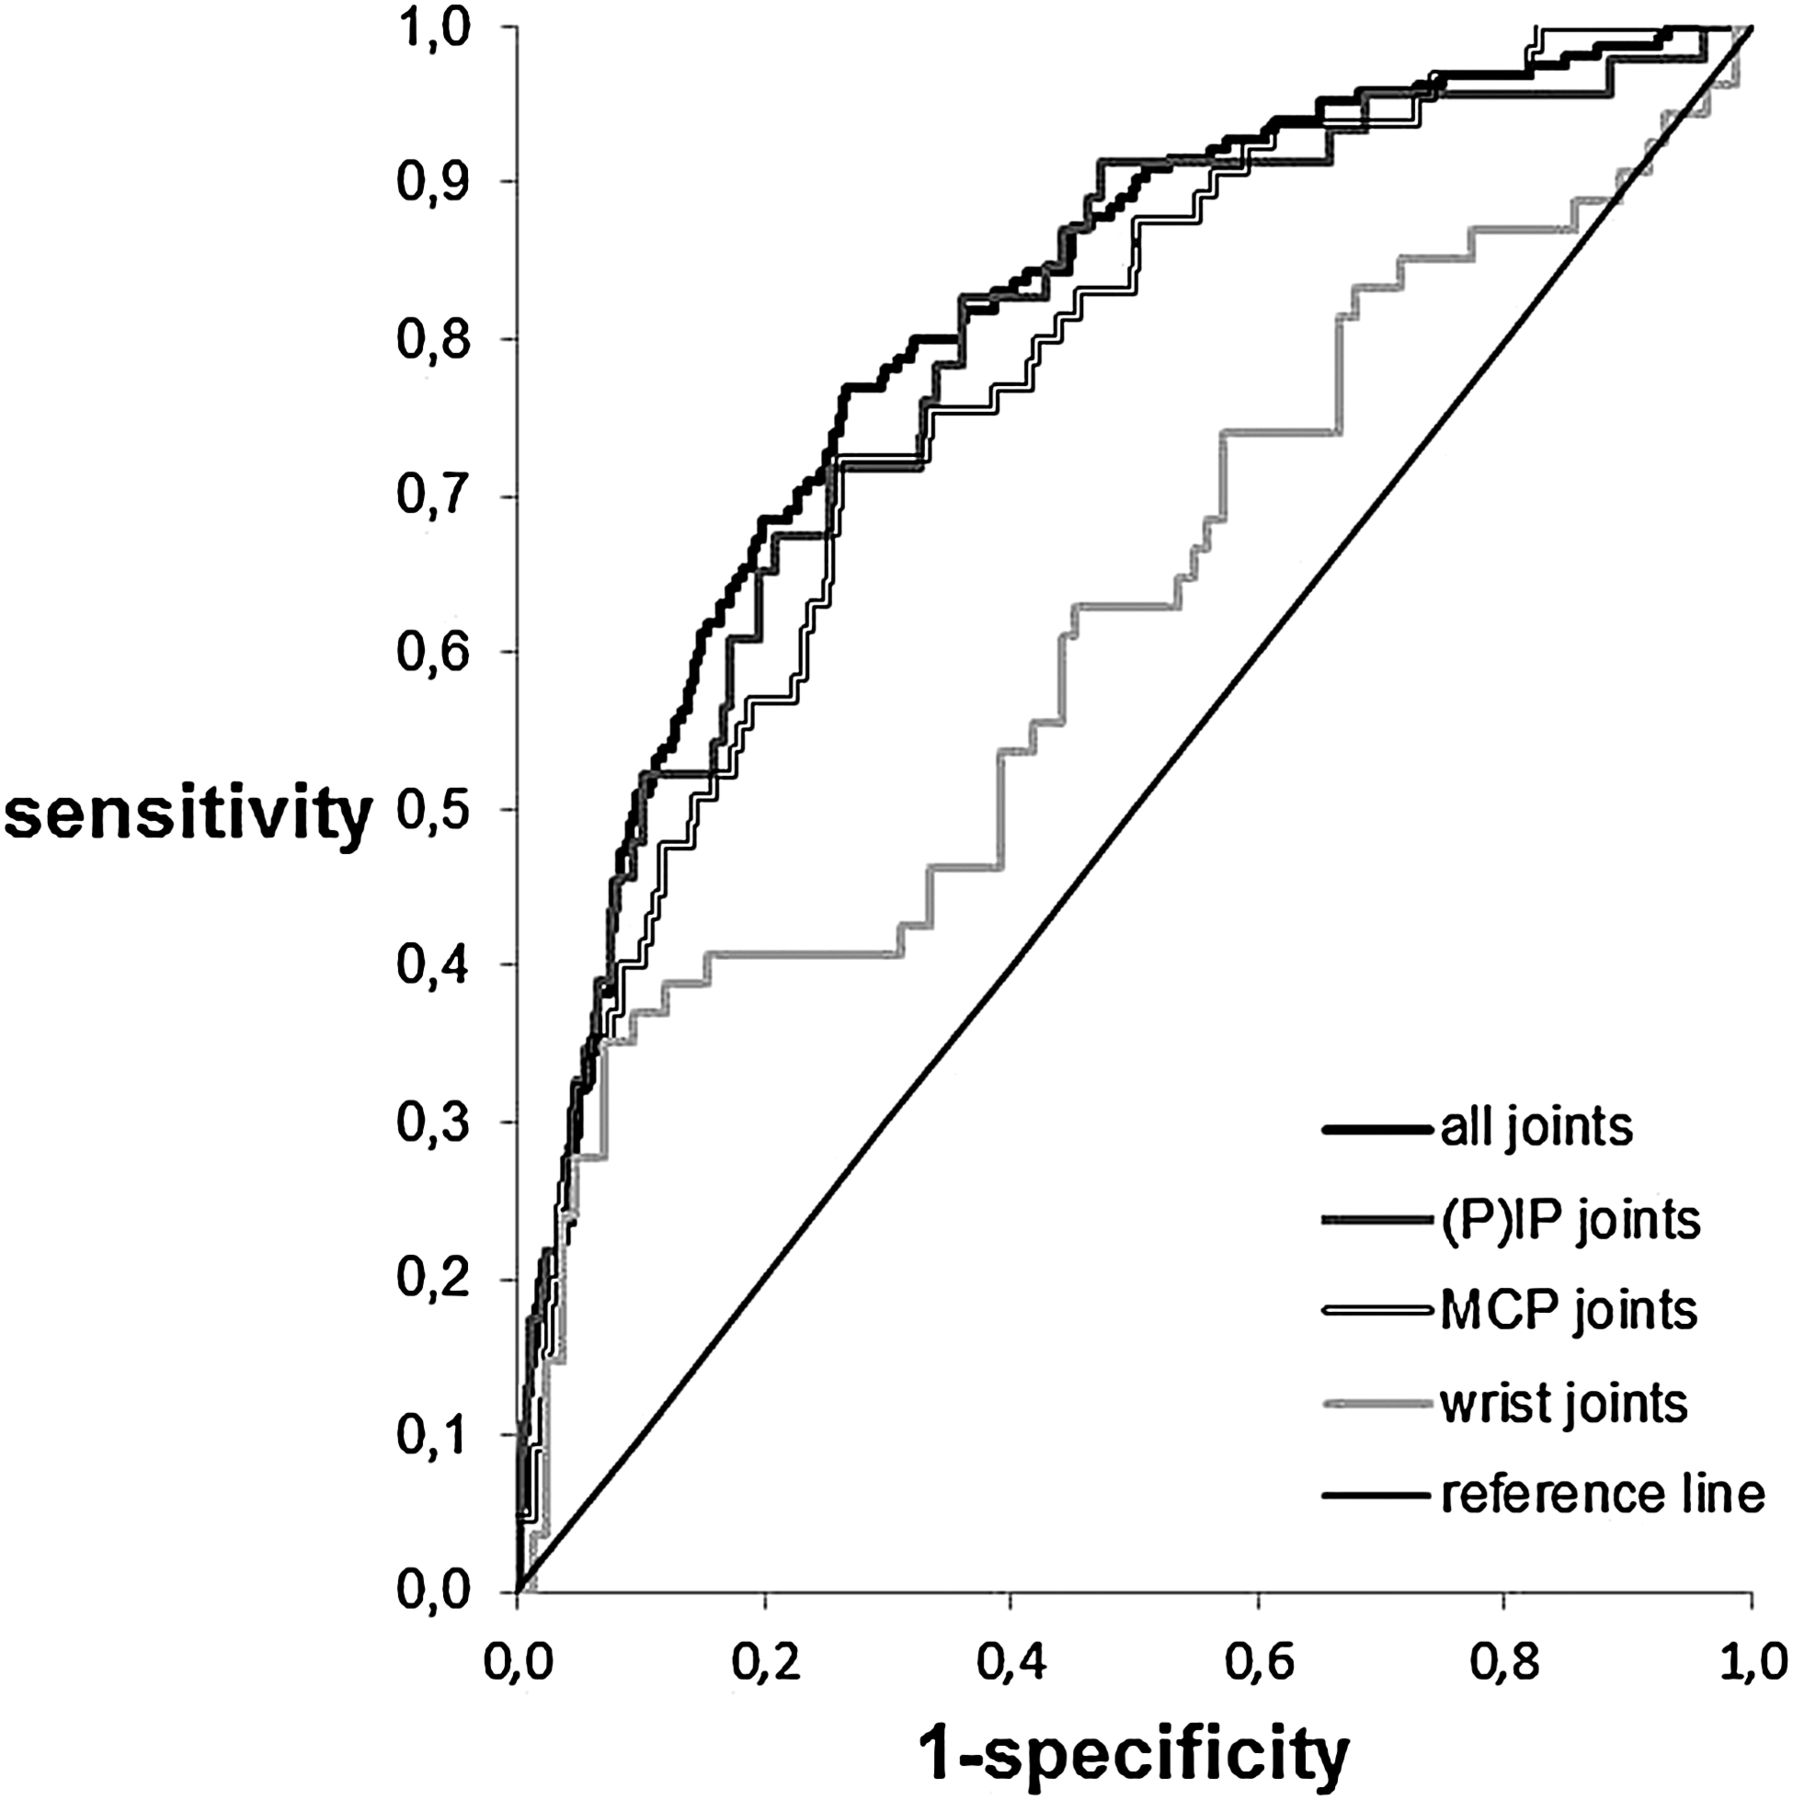
Diagnostic performance of OST was tested with inflammation as detected by US as reference standard (figure 3). Overall, OST had a good performance (AUC 0.81, 95% CI 0.77 to 0.84). When testing separately for the (P)IP, MCP and wrists joints, the OST of the (P)IP and MCP joints showed a good discrimination (AUC of 0.79, 95% CI 0.72 to 0.86, p<0.0001 and 0.78, 95% CI 0.71 to 0.83, p<0.0001, respectively). For the wrists it was poor (AUC 0.62, 95% CI 0.52 to 0.74, p=0.006). Since OST generates quantitative results, values for sensitivity and specificity of OST depend on the chosen cut-off value (figure 3). The values for inflammation as defined by OST with maximum sensitivity and specificity were 0.11 for the (P)IP joints (sensitivity of 83%, specificity of 64%), 0.26 for the MCP joints (sensitivity of 70%, specificity of 74%) and 1.0 for the wrists (sensitivity of 39%, specificity of 87%). In comparison, the test characteristics of clinical examination (of the two examiners combined) of swollen joints were sensitivity 59%, specificity 86% for the PIP joints, a sensitivity 42% and a specificity of 93% for the MCP joints and a sensitivity 37% and specificity of 89% for the wrists (figure 4).

Area under the curve (AUC) between optical spectral transmission (OST) and ultrasonography (US) at the joint level. Area under ROC of the OST in all joints (AUC 0.81, 0.77 to 0.84, p<0.0001), (P)IP joints (AUC 0.79, 0.72 to 0.86, p<0.0001), metacarpophalangeal (MCP) joints (AUC 0.78, 0.71 to 0.83, p<0.0001) and wrists (0.62, 0.52 to 0.72, p=0.018) (US as reference).

Example of diagnostic performance of optical spectral transmission (OST) versus ultrasonography (US) and clinical examination at a chosen cut-off. Since OST generates quantitative results, values for sensitivity and specificity of OST depend on the chosen cut-off value. The values for inflammation as defined by OST with maximum sensitivity and specificity were 0.26 for the metacarpophalangeal (MCP) joints (sensitivity of 70%, specificity of 74%), 0.11 for the proximal interphalangeal ((P)IP) joints (sensitivity of 83%, specificity of 64%) and 1.0 for the wrists (sensitivity of 39%, specificity of 87%). This figure shows the number of correctly classified joints with and without inflammation (US as reference) by OST (using the above-mentioned cut-off values) as the overlapping parts of the red and the blue circles per joint type. Similarly, the number of correctly classified joints by clinical examination (swollen joints) are shown as the overlapping parts of the blue and the green circles. Numbers denote the number of patients in a category.
Discussion
In this study, we found that OST measurements agreed moderately with clinical assessments, US and MRI. The level of agreement was highest with items (directly) reflecting synovial vascularity, such as PDUS. As light does not penetrate through bone, we found no agreement between OST and MRI bone marrow oedema. Diagnostic performance of OST was better in small hand joints (MCP and (P)IP joints) than in the wrists. The sensitivity (but not specificity) of detection of synovitis was higher than that of clinical examination for (P)IP (83% vs 59%) and MCP joints (70% vs 42%); it was similar for the wrists (39% vs 37%). The sensitivity and specificity are, however, lower than those for US and MRI,6 but regular use of these techniques is not feasible in most clinics. Our pilot study shows an increased detection rate which may be clinically relevant, provided that the results are replicated in new cohorts.
Studies on FOI, an invasive technique using light to detect inflammation, have been published earlier.12 ,13 ,21–23 It seems that in FOI as well as in OST, the diagnostic performance is inversely related to the size of the joint. The differences in design (such as investigated joints areas, diagnosis) and technique used in the FOI studies hamper the full comparison of these results with our own. However, our study shows at least equivalent, or even slightly higher, sensitivity and specificity at detecting synovitis at the joint level, than the commercially available device for FOI. Additional advantages of our technique are its non-invasiveness and the generation of quantitative results ruling out interobserver variability.
This study has some limitations. There was a risk of model overfitting because US was used both as reference standard in the development of the algorithm and in the evaluation of diagnostic performance. We have tried to reduce overfitting by using a relatively large development sample and leave-one-out cross validation. We think this strategy was successful because we also found a correlation between OST and MRI synovitis and MRI was not used in development of the algorithm. However, validation in a new cohort is still mandatory, especially since relatively few patients with severe synovitis were present in our study.24 ,25 Another possible limitation is that we used subjects with arthralgia as controls. In clinical practice, one wants to differentiate between arthritis and arthralgia. However, it is well known that in a subgroup of subjects, arthralgia may evolve in inflammatory arthritis and subclinical inflammation may already be present.26 None of the subjects in our study developed inflammatory arthritis (>1 year after study completion). The diagnostic performance of OST in the wrists was rather poor, which may be related to the limited tissue penetration of light through larger structures. In addition, there was a low number of subjects with GSUS tenosynovitis. This may have been related to the rather strict definition. Low-grade PDUS negative tenosynovitis may have been missed. Further, US and OST were performed each by a single examiner (DFTC and AJLM, respectively). Therefore, interobserver variability could not be calculated. Intraobserver agreement for MRI was low; the agreement was good if joints with low-grade synovitis (grade 1) were excluded. Further, it has been shown that the interobserver reliability of US of the wrists is only moderate,27 ,28 which may be related to the (more) complex anatomy of the wrist in comparison with PIP and MCP joints. It is subject of further studies whether technical adjustments leading to more light penetration through the wrists are able to improve the accuracy of OST measurements of the wrists. Also, in the adjusted FHP, image analysis will be automated; OST will then be an operator-independent technique. Finally, and similar to other imaging techniques, before OST can be used to monitor patients with RA, its sensitivity to change should be investigated. New studies to evaluate diagnostic performance and sensitivity to change in a new cohort of patients with RA are planned.
In conclusion, OST is a new imaging technique that generates fast and quantitative results. In this pilot study, OST performed moderately in the detection of joint inflammation in patients with RA. Further studies are needed to determine the diagnostic performance in a new cohort of patients with RA.
Acknowledgments
We thank Professor Dr P Conaghan for scoring the MRI's.
References
Supplementary materials
Supplementary Data
This web only file has been produced by the BMJ Publishing Group from an electronic file supplied by the author(s) and has not been edited for content.
- Data supplement 1 - Online figure
Lay summary
This web only file has been produced by the BMJ Publishing Group from an electronic file supplied by the author(s) and has not been edited for content.
Footnotes
Handling editor Tore K Kvien
Contributors MvO, JWGJ, AAAW, MCvB, WHJR and JWJB conceived and designed the study. DFTC, KLT, AJLM and AAAW acquired the data. MvO, JWGJ and PBLM analysed the data. MvO, DFTC, JWGJ and JWJB interpreted the results. MvO drafted the manuscript. All authors revised, critically commented and approved the final version of the manuscript.
Funding Hemics, Eindhoven, The Netherlands.
Competing interests MCvB and WHJR are cofounders of Hemics. PBLM, MCvB and WHJR own stock in the company. Hemics has filed a patent application for the optical spectral transmission imaging technology. JWJB received a Research Grant from Hemics.
Patient consent Obtained.
Ethics approval The study protocol was approved by the Ethics Committees of the UMCU and Maxima Medical Center Eindhoven. All study participants gave written informed consent prior to study inclusion.
Provenance and peer review Not commissioned; externally peer reviewed.
Linked Articles
- Editorial
- Clinical and epidemiological research
- Letter