Article Text

Abstract
Objective To estimate the costs related to hospital care, drug use and work loss in prevalent and incident patients with rheumatoid arthritis (RA), and to describe their distribution.
Methods A cohort of prevalent patients with RA ≥18 years on Jan 1, 2010, was identified from the Swedish National Patient Register (requiring ≥2 visits listing RA) and the Swedish Rheumatology Quality Register, and followed until 31 December 2010. From the same registers, patients with the 1st visit listing RA in 2009, with a 2nd visit within 1 year, were identified to the incident cohort, and were followed for 1 year. Five sex-matched, age-matched, education-matched and county-matched general population comparators were sampled per patient with RA. Costs were retrieved from national registers.
Results The mean annual cost, including productivity losses per patients with RA (n=49 829) aged 18–64 years was €23 147 versus €8364 (median €15 059 vs €277) per comparator. In patients with RA ≥65 years, the mean healthcare cost was €6438 versus €2773 (median €2458 vs €677) per comparator. 13% of the patients accounted for 50% of the cost.
For the incident patients with RA (n=2695), the mean monthly cost increased from a level close to the comparators 1 year before register identification (18–64 years: €736 vs €644; ≥65 years: €192 vs €178), peaked the month following the identification date, and decreased to twice the cost of the comparators 1 year after diagnosis (18–64 years: €1252 vs €628; ≥65 years: €487 vs €230).
Conclusions The mean annual cost in patients with established RA, and mean monthly cost in newly diagnosed patients with RA, were 2–3 times higher than in the general population.
Statistics from Altmetric.com
Introduction
Rheumatoid arthritis (RA) has been associated with increased healthcare use, reduced employment opportunities, and overall reduction in quality of life, resulting in substantial individual and societal costs.1–4
In the last decade, the introduction of biologic drugs has resulted in better control of the disease progression in RA.5 Similarly, treat-to-target strategies and careful monitoring already from clinical disease onset have been shown to result in clinical benefits compared to routine care in early RA.6 To evaluate the value of therapeutic interventions from a cost perspective and on a societal level, a comprehensive nationwide assessment of the economic burdens related to RA is necessary, as is an available benchmark in terms of corresponding cost components in the general population. Several studies have estimated various aspects of the economic burden of RA, such as productivity losses7 ,8 and drug costs9 in defined cohorts of patients. Few studies from the biologic era have simultaneously assessed several cost components using nationwide data,1 ,10 ,11 and no study has performed a comprehensive cost analysis study on individual-level data with a matched general population comparison cohort without RA.
The overall population cost, as well as the arithmetic mean, describes the economic burden to society. However, costs often display a skewed distribution where a small proportion of patients contribute most of the total cost. Previous cost-of-illness studies in RA have reported mean annual costs in a wide range,12 particularly regarding productivity losses, where a recent review, based on studies from the USA and Europe, reported an IQR of €4100–€11 600.13 These costs were not related to a relevant baseline population cost, and the underlying distribution was not further described.
The aim of this study was, therefore, to estimate the annual and monthly costs related to work loss, hospital care and drug use in register-identified prevalent and incident patients with RA, to describe their distribution, and to put these costs in relation to the corresponding costs in the general population.
Methods
Setting: The Swedish National Health Service
The Swedish healthcare system is tax-funded and offers universal access, while prescription drugs are provided free of charge above a threshold of Swedish kroner 1800 annually (≈€200). In Sweden, patients with RA are typically diagnosed and treated by rheumatologists rather than by general practitioners. Care for RA represents a mix of combined outpatient and inpatient facilities with the vast majority of rheumatologists working at hospitals rather than as private practitioners.
Register sources
The register sources used for identification of the prevalent as well as the incident RA cohort were the National Patient Register (1969–2011),14 the Swedish Rheumatology Quality Register (1995–2011),15 and the Prescribed Drug Register (2005–2011), and have been described elsewhere.16 Sick leave and disability pension data were retrieved from the Social Insurance Agency, while hospital care, non-infusion drug use, and mortality data were retrieved from the National Patient Register, Prescribed Drug Register and Causes of Death Register, respectively. Biologic drug use given by infusion was calculated based on data from the Swedish Rheumatology Quality Register.
From the Register of the Total Population we sampled five sex-matched, age-matched, education-matched, and county-matched general population comparators per patient with RA. Linkage of these register sources was performed using each individual's personal identity number, a unique identifier carried by each Swedish resident.
Source populations
Prevalent patients with RA
Patients with RA, ≥18 years on 1 January 2010, with ≥2 visits listing RA, were identified from the Swedish National Patient Register and the Swedish Rheumatology Quality Register. Costs in patients identified with stricter criteria of the register-based definition of prevalent RA were investigated in sensitivity analysis (see online supplementary table S1).
Incident patients with RA
The register-based definition of incident adult onset RA required fulfilment of three criteria16:
-
Primary identification of patients ≥18 years with a first-ever inpatient or non-primary outpatient care visit listing a main or contributory diagnosis for RA, or registered in the Swedish Rheumatology Quality Register with an incident RA diagnosis, in 2009.
-
A second discharge or non-primary outpatient care visit for RA within 1 year of the first visit.
-
Patients with disease-modifying anti-rheumatic drugs (DMARDs; see online supplementary table S2) treatment >6 months before the first RA visit were regarded as prevalent, and excluded from the incident RA cohort.
Interim results from a validation study of the register-based definition of RA in 100 patients, indicate that 90% of the patients in the prevalent and the incident group fulfilled either the ACR1987 or the ACR/EULAR2010 classification criteria for RA.17 ,18 Of these 90% in the incident cohort, 90% had a register identification date <2 years from date of first symptom, indicating a high validity also in terms of incidence (personal communication Dr Kristin Widén).
Subgroups
The retirement age in Sweden is 65 years. For this reason, we divided the prevalent and the incident RA cohorts into 18–64 years and ≥65 years, and costs associated with work loss were assessed only in patients aged 18–64 years. In the prevalent RA cohort, we further divided these two subgroups into biologics users and biologics non-users. Biologics use was defined as ≥1 of non-infusion biologics (etanercept, adalimumab, certolizumab pegol, golimumab or anakinra) dispensing in 2009, or an ongoing treatment with infusion biologics (infliximab, rituximab, abatacept, or tocilizumab) on 1 January 2010, registered in the Prescribed Drug Register or in the Swedish Rheumatology Quality Register, respectively.
Follow-up
Prevalent RA patients were followed from 1 January 2010 until 31 December 2010. The incident RA cohort was followed for 1 year from the first date of register identification in 2009 (ie, the first-ever visit listing RA). For comparison of the incident cohort with general population comparators, we also retrieved monthly costs 1 year back in time from the register identification date for the patients with RA and their comparators.
Costs
Costs were assessed during follow-up and were converted to 2010 euros (€1=SKr9.54 in 2010).
Healthcare costs
Costs for non-primary outpatient care visits and hospital admissions were calculated by using the diagnostic related group coding system, which is a weighted average of costs per diagnostic related group (http://www.socialstyrelsen.se). Biologic infusion drug use was collected from the Swedish Rheumatology Quality Register and turned into costs by using the 2010 drug costs in Sweden (http://www.tlv.se), while costs for non-infusion drug use were collected directly from the Prescribed Dug Register.
Productivity losses
Work loss was valued by using the human capital approach (HCA) with all the accumulated days during follow-up of sick leave and disability pension included. The productivity loss was then estimated by multiplying the accumulated work-loss days with the average Swedish salary (€2990/month), including social fees (31%), in 2010 (http://www.scb.se). In sensitivity analysis, the friction cost approach (FCA) was used, with a friction time of 6 months for individuals to be replaced.19
Statistics
Although cost distributions were non-normal (see online supplementary figure S1), we report the results using the arithmetic mean, which has been described as the most informative measure for cost and resource use data.20 We also report medians and percentage of patients by cost categories as a complement.
Data were analysed using SAS (V.9.2, SAS Institute, Cary, North Carolina, USA). CIs for cost differences between patients and general population comparators were estimated using non-parametric bootstrapping.20
Results
A total of 50 091 prevalent patients with RA ≥18 years were identified in Sweden as at 1 January 2010 (estimated point prevalence 0.7%), of whom 49 829 (99%) were matched with five general population comparators. The mortality rate during follow-up was 3.7% in the patients with RA, and 2.3% in their comparators. Of the prevalent patients with RA, 9139 (18%) were treated with biologics during the study year or the year before. The sex distribution and time since register identification were similar for the overall prevalent RA cohort and the subgroup treated with biologics, while the proportion of working age patients was 43% (n=21 551) in the overall RA cohort, and 64% (n=5835) in the biologics users subgroup (table 1).
Characteristics of the register-identified prevalent and incident patients with RA
A total of 2735 patients were identified as incident patients with RA in 2009 (estimated incidence 36 per 100 000); 2695 (99%) patients could be matched with five comparator subjects, of whom 69% were women and 50% (n=1353) were of working age (table 1). The mortality rate during follow-up was 2.7% in the patients with incident RA and 2.0% in their comparators.
Costs
Prevalent patients with RA
Healthcare costs: 28% of the prevalent patients with RA aged 18–64 years, had ≥1 dispensing or infusion of any biologic drug during follow-up, resulting in a higher mean drug cost in working-age patients (€3761) than the ≥65 years age group (€2167), where the corresponding fraction was 12% (table 2). Patients in both age groups had a mean of four non-primary outpatient care visits per year, of which two were to a rheumatologist/internist. Older patients had more inpatient days, resulting in a higher mean cost for hospital care (€4271) than in the 18–64 years age group (€2477). The overall annual healthcare cost, including drugs, in prevalent RA was €6352.
Accumulated resource use and mean costs during 1 year follow-up by cost components of the prevalent and the incident RA cohorts
Productivity losses: in working-age patients, the greatest part (118 days, 90%) of the 131 annual work-loss days was due to disability pension. The annual productivity loss in this group was estimated at €16 907 (table 2).
Total societal cost: adding the cost components together, the societal cost was €23 147 (median €15 059; FCA €16 712) for the 18–64 year-old patients with RA, €6438 (median €2458) among the ≥65 year-old patients with RA (table 2 and figure 1) and €13 665 (median €4452) in the overall prevalent RA cohort.

Mean and median costs in prevalent rheumatoid arthritis (RA), prevalent RA treated with biologics, and matched general population comparators. RA treated with biologics: patients with RA, with any dispensed non-infusion biologics in 2009, or with an ongoing treatment of infusion biologics on 1 January 2010. Comparators: general population comparators matched 5:1 by age, sex, education level and place of residence.
Relation to costs in the general population: in relation to general population comparators, the mean incremental cost per prevalent patients with RA aged 18–64 years, was €14 783 (95% CI 14 456 to 15 123; figure 1). In prevalent patients with RA and the comparators, disability pension (€15 160 vs €6169) contributed the most to the total cost (65% and 74%, respectively), followed by biologic drug use (€3013; 13%) in patients with RA and sick leave in the comparators (€915; 11%).
In patients with RA ≥65 years, the mean increment in healthcare costs was €3666 (95% CI 3547 to 3777; figure 1) in relation to matched comparators. Inpatient care dominated total costs in patients with RA and comparators (€3221 (50%) vs €1740 (63%)), followed by biologic drug use (€1239, 19%) in patients with RA and non-biologic drug use in the comparators (€569, 21%).
In biologics users of the prevalent patients with RA, the annual mean total cost in 18–64 years was €32 626 compared to €7803 in their matched comparators (mean difference €24 822; 95% CI 24 216 to 25 392). In biologics users ≥65 years, the mean total cost was €15 235 compared to €2395 in their comparators (mean difference €12 840; 95% CI 12 524 to 13 200). The mean total costs in non-biologic users aged 18–64 years and ≥65 years were €19 628 and €5275, respectively (see online supplementary figure S2).
Incident patients with RA
Healthcare costs: also in incident patients with RA, a greater proportion among working age patients had biologic drug dispensing or infusion during the 1-year follow-up from the register-based date of RA onset than among older patients (12% vs 4%), resulting in higher drug costs (€1557 vs €1200; table 2). The number of non-primary outpatient care visits was similar between the age groups (6 visits per year), but, as in prevalent patients, the ≥65 years group had more inpatient days. The hospital care cost was €3066 in the working age group, and €6583 in patients aged ≥65 years.
Productivity losses: among the working age incident patients with RA, the number of annual days of sick leave (47 days) and disability pension (48 days) was similar, resulting in an annual productivity loss of €12 298 (table 2).
Total societal cost: the societal cost during the first year after the register-based identification of incident RA patients was €16 921 (median €5891; FCA €12 647) in working age patients, €7784 (median €3992) in the ≥65 years group, and €12 372 (median €4588) in the overall incident RA cohort.
Relation to costs in the general population: the mean monthly cost increased from a level close to the comparators 1 year before register identification (18–64 years: €736 vs €644; mean difference €91; 95% CI 10 to 176; ≥65 years: €192 vs €178; mean difference €14; 95% CI −26 to 64), peaked the month following the identification date, and decreased to around twice the cost of the comparators thereafter (figure 2). One year after the register identification, the monthly societal cost in patients aged 18–64 years was €1252 versus €628 in the comparators (mean difference €624; 95% CI 517 to 740), and in the ≥65 years group the monthly healthcare cost was €487 versus €230 in the comparators (mean difference €258; 95% CI 181 to 350).

Mean monthly specific and mean (bars) and median (dots) monthly total costs in incident rheumatoid arthritis (RA) 18–64 years (upper panel) and ≥65 years (lower panel), and mean monthly cost in comparators (diamonds), in relation to register identification date (first-ever visit listing RA). Comparators: general population comparators matched 5:1 by age, sex, education level and place of residence.
Distributions
The cost distributions in the prevalent and the incident RA cohorts were heavily right-skewed, with a bimodal pattern in working age patients, mostly due to full-time disability pension (see online supplementary figure S1).
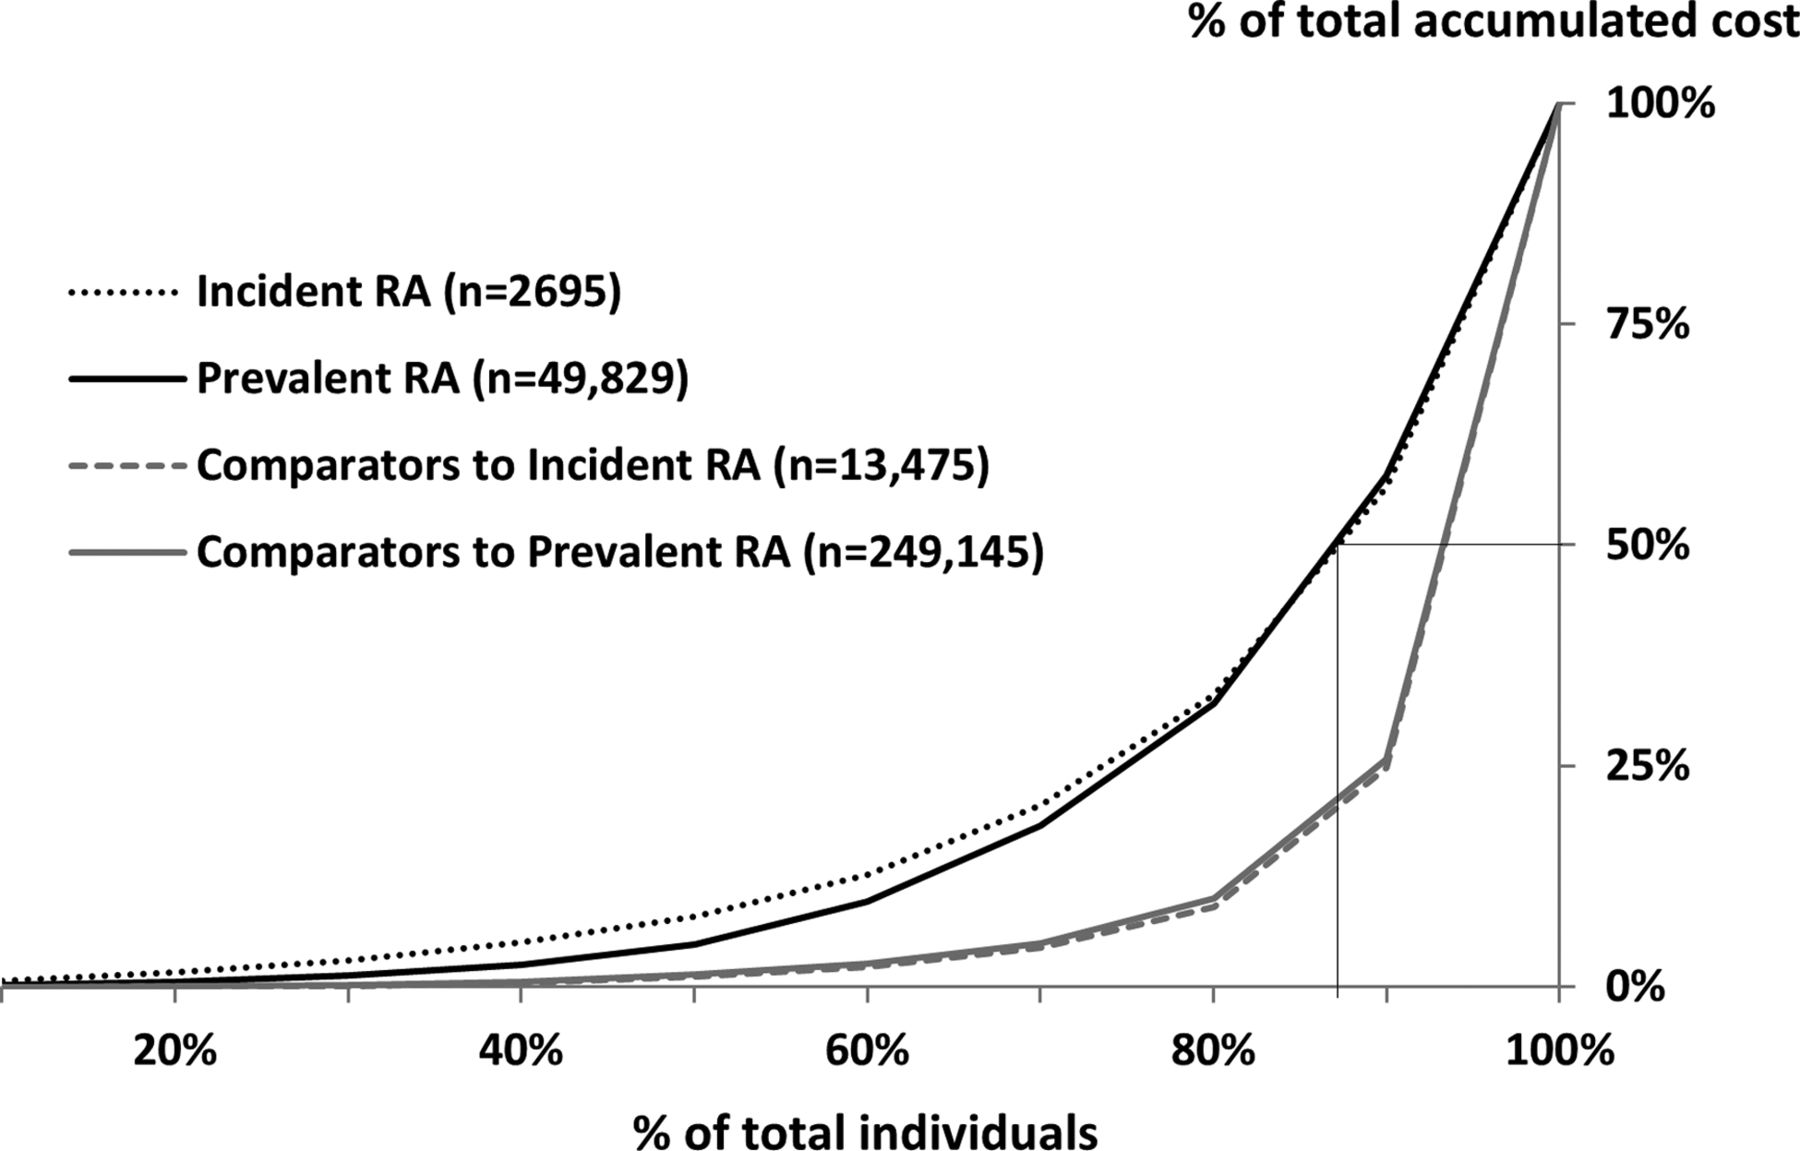
In figure 3, the skewed distributions are illustrated by the contribution to the total cost in each decile of individuals, with the individuals sorted by incurred cost. Approximately 13% of the patients with RA accounted for 50% of the annual total cost for the entire population in the prevalent and the incident RA cohorts. These patients were included in the proportion having an annual cost of >€50 000 (>€4000/month in incident RA; see online supplementary figures S3 and S4). The cost distribution was even more skewed in the general population comparators, where 5% accounted for 50% of the costs.
Cost distributions in prevalent and incident rheumatoid arthritis (RA), and their comparators, illustrated by percentage of patients on the x-axis and the percentage of total cost during follow-up on the y-axis. Individuals are sorted by ascending cost from left to right (the lowest cost individuals to the left and the highest cost individuals to the right). The thin lines illustrate that the 13% of patients with RA with the highest cost accounts for 50% of the total accumulated cost. Comparators: general population comparators matched 5:1 by age, sex, education level and place of residence.
Discussion
Main findings
The annual cost for hospital care, drugs and productivity losses in prevalent working age patients with RA, was estimated to be €23 000, of which only one quarter was accounted for by healthcare costs, and three quarters by productivity losses. These costs were 2–3 times higher than in the general population, corresponding to an annual cost of €15 000 attributable to RA. In patients treated with biologic drugs, the cost in the 18–64 years group and the ≥65 years group were 4 and 6–7 times, respectively, the corresponding costs in the general population. Patients who developed RA increased their mean monthly cost from a level close to that of the general population the year before first register identification with RA, peaking the month after RA diagnosis, but then decreased to twice the cost in the general population 12 months thereafter.
Previous research
In a recent review of economic implications in RA, reporting a comprehensive overview of direct and indirect costs as well as predictors of cost, the difficulties of homogenous comparisons between studies due to different methodological approaches and primary objectives are discussed.12 In another review, and in an attempt to circumvent comparison difficulties, Franke and colleagues assessed a weighted average based on data from 26 cost-of-illness studies in RA.13 They reported a weighted mean annual cost per patient with established RA of €4170 in healthcare costs, and €8452 in productivity losses. Our results (€6352 in healthcare costs and €16 907 in productivity losses) are substantially higher. One reason for the discrepancy may be the inclusion of studies before or in the beginning of the biologic era in the review (8 studies published before 2003). However, when reducing these costs with that of the comparators to get an estimate of the cost attributable to RA, the results are more similar (excess healthcare cost €4228; excess work-loss cost €9816), illustrating the importance of including general population benchmarks in outcomes research.
A study of costs in recent-onset RA (≤12 months; n=211) in Sweden from 2004 reported a total cost during the first year after diagnosis of approximately €13 000, where productivity losses accounted for 69%.3 Although the study was conducted in the early biologic era and in a regional patient sample, the results are largely in keeping with ours.
A sub-study of the FIN-RACo trial from Finland, a country with a social security system similar to Sweden's, reported a mean annual cost due to sick leave and disability pension during the first year in recent onset active RA (n=162; age 18–65 years) of €8320 in 2002.8 In their study, only RA-related disability pensions were included, while sick leave could be due to any reason. No general population benchmark was presented, so the cost related to RA could not be deduced. When, in our study, we reduced the annual disability pension cost in the incident RA cohort with the corresponding cost in the comparators, the resulting work-loss cost attributable to RA was €6560. The discrepancy may possibly be explained by more aggressive treatment alternatives in the incident patients in our study and a change toward stricter regulations in the welfare system in Sweden during recent years.
Mechanisms
In this study, we report the cost of the nationwide register-based cohorts of prevalent and incident patients with RA, and their comparators. Despite skewed cost distributions, the arithmetic mean describes the overall burden of a disease per patient in a defined population. However, the distributions are important: a minority of the patients with RA contributed the majority of the total costs, a pattern that was even more apparent in the general population comparators. A thorough understanding of costs in RA thus calls for a detailed study of the characteristics of low, moderate and high-cost patient segments.
Despite the expensive biologic drugs as a treatment alternative in RA, work loss remains the largest cost contributor to the societal cost in working-age patients with RA, overall, but also in the biologics-treated patient group. Among retired patients, biologic drugs contributed with two-thirds of the total cost. With respect to the work-loss outcome, the Swedish welfare system may not be directly comparable to other countries, limiting the generalisability of the study results, although a recent review found similar work disability rates in USA and northern European studies.21
Starting from a level close to the general population, the mean monthly cost in the incident RA cohort began to increase 1 year from the date of register identification, and peaked the month after identification. With a decrease in sick leave cost in working-age patients, but with an increase in biologic drug cost, the monthly cost stabilised 6 months after the identification date (figure 2). During the 1-year follow-up, no change in cost related to the largest cost contributor (disability pension) was observed. This is unsurprising, as the average number of days of disability pension was only somewhat higher in the incident patients with RA than the general population comparators during 12 months before to 12 months after the identification date. Furthermore, considering the short follow-up period, disability pension may not yet have been granted but start to increase beyond the first year after diagnosis. This is supported by our findings regarding work loss over 4 years in register-identified early patients with RA (n=3029), where we found a reciprocity between disability pension and sick leave, with increasing disability pension days, but decreasing days of sick leave, per year in relation to RA diagnosis.7
Strengths and limitations
Strengths of this study include the access to prospectively recorded, routinely collected nationwide data on inpatient and non-primary outpatient care, as well as prescription drug dispensings and objective register data on work loss. Day-level data were available for patients with RA and their matched comparators, enabling cost comparison with the general population. By introducing a general population comparator, we circumvented issues related to difficulties in attributing costs specifically to RA versus other reasons.
The main limitation was that we did not have access to all societal cost components, for example, costs related to primary care, physiotherapist visits, stays in rehabilitation units, presenteeism, unpaid work, and patient and family costs, probably leading to underestimation of the true cost. In the cost-of-illness review by Franke et al,13 the mean cost associated with patient and family based on 19 studies was assessed at €2284, indicating a non-negligible cost. Also, in a recent report from Norway in patients with RA treated with first-line DMARDs, costs associated with visits to primary care and physiotherapists, and stays in rehabilitation units were estimated to make up 4.1% of the total cost.22
Another limitation was that we did not adjudicate all the 50 091 prevalent nor the 2735 incident patients with RA diagnoses through clinical examinations. Interim results of a validation analysis show high validity, while sensitivity analysis with stricter register-based criteria for prevalent RA showed similar results as the main analyses (see online supplementary table S1). Furthermore, the estimated prevalence and incidence are in line with what has been previously reported from North America and Northern Europe.23
Summary/conclusion
The annual societal cost in prevalent as well as monthly societal cost in newly diagnosed patients with RA is substantial, and 2–3 times higher than in the general population. The cost distribution was skewed, indicating that predicting and intervening for reducing costs in RA may be very different in different patient segments, highlighting the importance of identifying predictors of costs in patients included in the high cost extreme of the skewed distribution.
References
Supplementary materials
Supplementary Data
This web only file has been produced by the BMJ Publishing Group from an electronic file supplied by the author(s) and has not been edited for content.
Files in this Data Supplement:
- Data supplement 1 - Online supplement
Footnotes
Handling editor Tore K Kvien
-
Contributors JKE had full access to all the data in the study and takes responsibility for the accuracy of the data analysis. Trial design and critical revision of the manuscript for important intellectual content: all authors. Quality control of data and drafting of the manuscript: JKE. Analysis and interpretation of data: JKE and MN. Study supervision: JA and MN.
-
Funding The ARTIS Study Group conducts scientific analyses using data from the Swedish Biologics Register ARTIS run by the Swedish Society for Rheumatology. For the maintenance of this register, the Swedish Society for Rheumatology has received funding, independent of the conduct of these scientific analyses, from Schering-Plough, BMS, Wyeth, Abbott Laboratories and Roche. This study has also received funding from COMBINE Sweden and the Swedish Foundation for Strategic Research.
-
Competing interests JA has received research grants from Pfizer and AstraZeneca. JKE reported participating in research projects fully or partly funded by Novo Nordisk and COMBINE Sweden. MN reported participating in advisory boards for Pfizer (rheumatology) and Abbott (non-rheumatology) and participating in research projects fully or partly funded by Schering-Plough, AstraZeneca, Novo Nordisk, Pfizer and Roche (unrelated to the current work).
-
Ethics approval Ethics approval was granted by the Regional Ethics Committee, Karolinska Institutet, Stockholm, Sweden.
-
Provenance and peer review Not commissioned; externally peer reviewed.