Article Text

Abstract
Objective To develop and validate a prognostic model for incident knee osteoarthritis (KOA) in a general population and determine the value of different risk factor groups to prediction.
Methods The prognostic model was developed in 2628 individuals from the Rotterdam Study-I (RS-I). Univariate and multivariate analyses were performed for questionnaire/easily obtainable variables, imaging variables, genetic and biochemical markers. The extended multivariate model was tested on discrimination (receiver operating characteristic curve and area under the curve (AUC)) in two other population-based cohorts: Rotterdam Study-II and Chingford Study.
Results In RS-I, there was moderate predictive value for incident KOA based on the genetic score alone in subjects aged <65 years (AUC 0.65), while it was only 0.55 for subjects aged ≥65 years. The AUC for gender, age and body mass index (BMI) in prediction for KOA was 0.66. Addition of the questionnaire variables, genetic score or biochemical marker urinary C-terminal cross-linked telopeptide of type II collagen to the model did not change the AUC. However, when adding the knee baseline KL score to the model the AUC increased to 0.79. Applying external validation, similar results were observed in the Rotterdam Study-II and the Chingford Study.
Conclusions Easy obtainable ‘Questionnaire’ variables, genetic markers, OA at other joint sites and biochemical markers add only modestly to the prediction of KOA incidence using age, gender and BMI in an elderly population. Doubtful minor radiographic degenerative features in the knee, however, are a very strong predictor of future KOA. This is an important finding, as many radiologists do not report minor degenerative changes in the knee.
- Osteoarthritis
- Knee Osteoarthritis
- Epidemiology
Statistics from Altmetric.com
Introduction
Osteoarthritis (OA), the most common joint disorder worldwide,1 is a chronic arthropathy in which cartilage loss, osteophyte formation and subchondral bone sclerosis lead to pain, disability and a reduction in quality of life.2 The burden of OA is increasing due to a higher life expectancy and the aging population, while there are no curative treatment options for the disease. The current treatment options are scarce; symptom relief by using analgesics and physical therapy are the most often used therapies. Eventually, arthroplasty or an osteotomy might be inevitable, but a cure remains to be found for OA.
Identification of subjects at a high risk of OA is necessary for two main reasons. First, if subjects at a high risk of developing OA can be identified, preventive strategies (and monitoring of that person) could be applied by, for example, the family doctor. Second, in clinical and biochemical research it is most cost-effective to include subjects in a study who are at a high risk of developing OA on a short term. This would make it feasible to efficiently test preventive interventions or new biomarkers in OA patients.
Recently, the first risk prediction model for incident knee osteoarthritis (KOA) was presented in a small high-risk cohort of 99 cases and 179 controls with 12 years of follow-up.3 In this study, three different models were evaluated for incident and progressive radiographic KOA and symptomatic KOA using conventional risk factors such as age, gender, body mass index (BMI), family history of OA, occupational risk and joint injury. External validation of these models in the Osteoarthritis Initiative showed poor discrimination with an area under the curve (AUC) of 0.52 for progression of KOA and 0.60 for radiographic and symptomatic KOA. Limitations of this study were the small size of the internal cohort and the fact that only basic clinical/questionnaire-based variables are included in the models, ignoring other risk factors such as genetic and biochemical risk factors.
The objective of this study was to develop and validate a prediction model for incident radiographic KOA in a large, general, elderly population (Rotterdam Study-I (RS-I), a population-based cohort study) and determine the value of different risk factor groups to prediction. Validation of the model is assessed in two independent population-based studies. This is the first risk prediction model for incident KOA that evaluates and compares predictive values of different risk factor groups (clinical, genetic and biochemical).
Materials and methods
Study design
This study was conducted using a two-stage design. In stage 1, the risk prediction model was created in the RS-I. Validation of this model was assessed in stage 2; calibration and discriminatory power were determined in two independent cohort studies with similar population characteristics, the Rotterdam Study II (RS-II) and the Chingford Study.
Study populations
The Rotterdam Study (RS) is a large prospective population-based cohort study of men and women aged 55 years and older. The study design and rationale are described in detail elsewhere.4 In summary, the objective of the study is to investigate the determinants, incidence and progression of chronic disabling diseases in the elderly. The RS-I is the first subcohort of 7983 persons, aged 55 years and over living in Rotterdam in the Netherlands. Since the start of the study, there have been several follow-up visits to the research centre. All participants were examined in detail at baseline.5 In summary, a home interview was conducted (∼2 h) and subjects underwent an extensive set of examinations at the research centre (∼5 h). RS-I was extended in 1999 with 3011 participants using the same inclusion criteria (the RS-II). The medical ethics committee of Erasmus University Medical School approved the study and written informed consent was obtained from each participant.
The Chingford Study is a prospective population-based longitudinal cohort, which includes women derived from the age/sex register of a large general practice in North London. The study design and rationale have been described elsewhere in detail.6 The Guy's St Thomas’ Trust and the Waltham Forest Trust ethics committees approved the study protocol. After study procedures were explained to participants, written informed consent was given by each participant.
Risk factor assessment in RS-I and RS-II
Age, gender and BMI: Age and gender were assessed during the home interview. Height and weight were measured at baseline examination with the subject in a standing position with indoor clothing without shoes and the BMI was calculated (kg/m2).
Questionnaire-based risk factors: A detailed questionnaire on joint complaints and disability was performed on all participants by trained interviewers.7 Knee pain was defined as pain during the last month during most of the days. Details are given in online supplemental methods. In addition, smoking (never vs former or current smokers) and educational level (primary education to university) were recorded.
Genetic risk score: The single nucleotide variants (SNPs) selected for the genetic risk score are all SNPs with a p value <1×10⁻⁷ in meta-analyses of KOA in Caucasian populations. This p value was chosen, because of the proven robustness of genetic signals reaching p values <10−7. Choosing a less stringent p value would increase the number of false positives. The genetic risk score was calculated as Σ risk allele (non-weighted) or Σ risk allele × (log) ORmeta-analysis (weighted) (see online supplement table S1).
Biochemical marker: Urinary C-terminal cross-linked telopeptide of type II collagen (uCTX-II) was measured as described elsewhere.8 The concentration of uCTX-II (ng/L) was standardised to the total urine creatinine (mmol/L).
Radiographic risk factors: Variables included in the prediction model were the baseline knee Kellgren & Lawrence (KL) score, where a score of 1 was considered a risk factor and 0 the reference. A KL score of 1 was defined as doubtful osteophytes and/or doubtful joint space narrowing or definite osteophytic lipping or one definite osteophyte. Hand OA was defined as two out of three joint groups (distal interphalangeal joint, proximal interphalangeal joint and carpometacarpal joint or scaphotrapezotrapezoidal joint) affected by at least one definite osteophyte (=KL≥2)9 and hip OA was defined as at least definite joint space narrowing.10
Risk factor assessment in the Chingford Study
Age, gender and BMI: Age, gender, height and weight were measured at each examination with the subject in a standing position with indoor clothing without shoes and the BMI was calculated (kg/m2).
Questionnaire-based risk factors: All study participants filled a detailed medical questionnaire; details are given in the online supplemental methods. Knee pain was defined as pain during the last month during most of the days.
Genetic risk variable: Genotyping of the selected was performed by Kbiosciences Ltd. The genetic risk score was computed as for RS-I.
Biochemical marker/radiographic risk factors: uCTX-II levels and hip and hand OA were defined and analysed in the same way as for RS-I.
Outcome assessment: incident KOA
In all studies, knee ROA was defined as a KL score ≥2 (= at least two definite osteophytes and possible joint space narrowing) of one or both joints. Incidence of knee ROA is defined as a KL score <2 at baseline and a KL≥2 at follow-up (mean follow-up time is specified in table 1) of the same knee. We included individuals with unilateral KOA, since they were at risk of developing incident OA at the other knee.
Baseline characteristics of RS-I, RS-II and the Chingford Study
Rotterdam Study: Weight-bearing knee radiographs were scored by six trained readers for the presence of radiographic OA of the knee according to the KL score.11 ,12 A random selection of 10% of X-rays were read by all of the six readers. This was done at regular time points during the reading of the X-rays, to be sure that the readers were reading the X-rays similarly during the whole period. Interobserver agreement expressed as correlation statistics intraclass correlation were 0.71 for RS-I and 0.68 for RS-II.
Radiographs were read sequentially, meaning that previous X-rays were also read when reading follow-up and as these studies were very large there was a good representation of all five KL grades.
Chingford Study: Grading assessments of baseline knee, hip and hand radiographs and follow-up knee radiographs were performed as follows. OA was graded according to the KL Scale, using the figures and legends of the original atlas.13–16 A single trained observer read all films. The within-observer reproducibility of radiographic assessment at these joints has been shown to be sufficient for epidemiologic use (within-observer κ >0.75).17
Statistical analysis
Development of the risk prediction model: Imputation of missing data was performed for continuous variables with less than 10% missing data based on the correlation with all other risk factors. We imputed data on the basis of correlation with the other variables assessed in this study. Only those subjects were selected who had data available for all variables after imputation. Standardised scores ((x-mean)/SD) were made for continuous variables, such that the OR in the multivariate models was expressed as percentage of increased or decreased risk per SD. Continuous variables were tested for normality and in the case of uCTX-II levels a log-transformed variable was used to ensure a variable with a normal distribution.
We have performed the analysis using the subject as the unit of analysis. First, univariate analyses analysis of variance were performed in RS-I to assess the relationship between risk factors and incident knee ROA. Subsequently multivariate logistic regression models were created with first gender, age, BMI and questionnaire-based variables (MV1), followed by the addition of the genetic risk score (MV2) and finally addition of the radiographic risk factors (MV3).
To estimate the predictive value of the genetic risk score alone, but also for questionnaire-based variables, X-ray variables and uCTX-II alone, we created risk prediction models in RS-I, RS-II and the Chingford Study for these groups separately.
In a large twin study for hip fracture (n=1055 hip fractures), it was shown that the heritability decreases with age from 68% at the age of 69 years to 3% above the age of 79 years.18 We hypothesised therefore that the predictive value of genetic markers may be larger when assessing the discriminative value at younger age. The analysis for the relationship between the genetic risk score and incident radiographic KOA was therefore stratified according to age (≥65 years).
All analyses were performed using SPSS V.17 and all analyses were adjusted for follow-up time.
In a random subset of RS-I data (135 incident KOA cases and 794 controls), data on uCTX-II levels were available. Risk prediction models were also created in this subset.
Validation of the risk prediction model: Calibration indicates how close the risks predicted by the model are to the actual observed risks and the Hosmer–Lemeshow χ2 statistics for goodness of fit were used to compare observed and predicted risks. Small χ2 values and large p values indicate good calibration. Calibration was assessed in the independent cohort study (RS-II). Discrimination examines the probability that an individual with the disease will be assigned a higher risk than an individual without disease. Therefore, it is indicative of the ability to correctly classify cases and controls. The area under the receiver operating characteristic (ROC) curve (AUC) was used to assess discrimination in RS-I, RS-II and the Chingford Study, where the predicted risks in the validation cohorts were based on the coefficient estimates from the model in the RS-1 cohort.
Results
Population characteristics
In total, 474 incident KOA cases and 2154 controls had data available for all risk factors in RS-I. The baseline characteristics of all three studies are shown in table 1.
Risk prediction models
The genetic risk score was normally distributed (see online supplement figure S1). As the ORs for all SNPs were within a small range (1.11–1.21), we observed the same results for the weighted and non-weighted risk scores and therefore only results of the non-weighted risk scores are shown.
The results of the univariate analysis for the relationship between risk factors and incident KOA in RS-I and the multivariate analyses are shown in table 2. As can be seen in the full multivariate model, the strongest associations were observed for the baseline KL score of 1 (OR 6.97), gender (OR 1.66), BMI (OR per SD 1.28), knee pain (OR 1.62) and hand OA (1.44). This means, for example, that a subject with hand OA has a 44% increased risk of developing radiographic KOA in the next ∼9 years compared with subjects without hand OA.
Univariate and multivariate association models to assess the relationship between risk factors and incident KOA in RS-I
Validation of the risk prediction models
The Hosmer–Lemeshow χ2 statistics for goodness of fit showed a good calibration for all risk prediction models (table 3). AUCs of the separate risk factor groups are depicted in table 4. The area under the curve was higher in RS-I than RS-II or Chingford for all models. This is to be expected because the risk prediction model was created in RS-I. A model including only age, gender and BMI resulted in an AUC of 0.66 in RS-I (table 3). The addition of questionnaire-based predictors did not add predictive value. Subsequently adding the genetic risk score to the model also did not improve the model much (AUC of 0.67), while the addition of radiographic variables increased the AUC up to 0.79 in RS-I. This increase in AUC is explained by the baseline KL score, not by the risk factors for hand and/or hip OA. We then tested a ‘minimal model’, including age, gender, BMI, knee pain and baseline KL score 0/1, for its predictive value. We found that this model was very similar to the full model (including the 13 tested variables), with an AUC of 0.79 in RS-I.
Validation of the risk prediction models: calibration and discrimination
Discriminative ability for incident KOA based on separate groups of risk factors in RS-I, RS-II and the Chingford Study
In RS-II and the Chingford Study, similar trends in AUCs were observed as in RS-I, with the AUCs being smaller compared with the AUCs in RS-I. The minimal model performed well in the two validation cohorts, with an AUC of 0.86 and 0.76 (RS-II and Chingford ,respectively). In figure 1 the ROC curves are shown for RS-I for the first four multivariate models as specified in table 3.
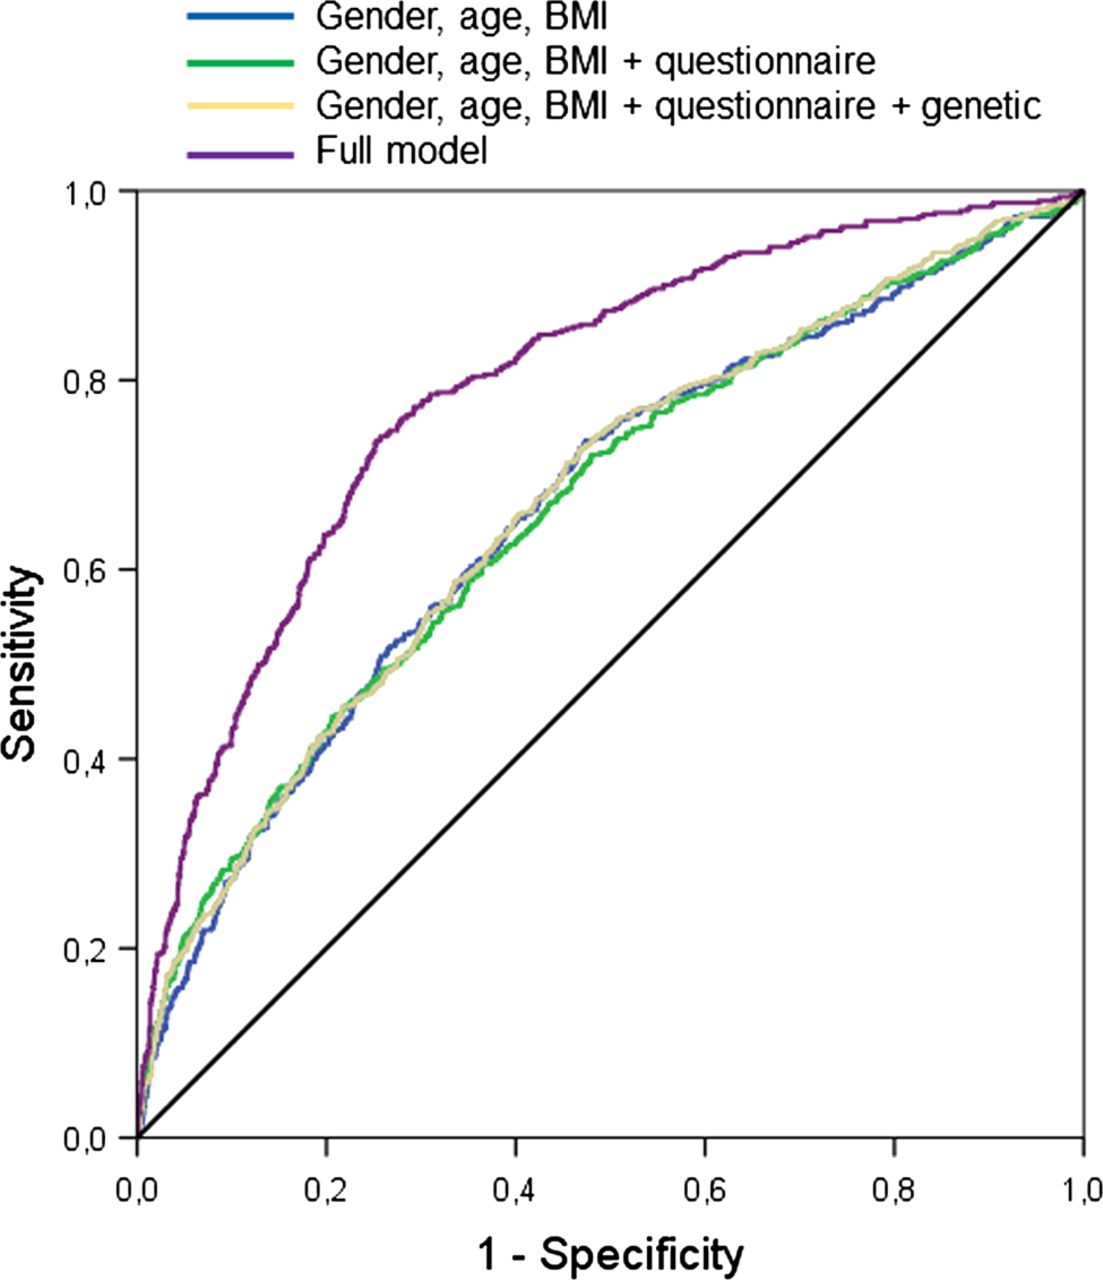
Receiver operating characteristic curves for the four risk prediction models as specified in table 1 for Rotterdam Study I. The fourth model includes also the radiographic variables. BMI, body mass index.
In a subset of RS-I (135 cases, 794 controls), data were available on a biochemical marker, uCTX-II levels. Risk prediction models were created in the same way as mentioned before in RS-I and were tested for discrimination in RS-I, RS-II and the Chingford Study. In online supplement figure S2, the ROC curves are shown for four models as specified in online supplement table S2. Comparing the genetic risk score with uCTX-II levels, the same results were obtained, namely no significant increase in AUC compared with MV2.
The AUC for the genetic risk score only was 0.65 (95%CI 0.62 to 0.70) in subjects aged <65 years (figure 2A), while it was only 0.55 (95%CI 0.51 to 0.59) in subjects aged ≥65 years (figure 2B). Subjects aged <65 years of age were similar to subjects aged ≥ 65 years in terms of gender (p=0.70) and BMI (p=0.88), but had on an average 1.0 years longer follow-up time (p=4.4×10⁻³³) and less frequent a baseline KL score of 1 (35% vs 42%, p=1.9×10⁻⁴) (data not shown).

Receiver operating characteristic (ROC) curves for the genetic risk score alone in Rotterdam Study I (RS-I) stratified according to age 65 years. (A) ROC curve for incident knee osteoarthritis (KOA) according to genetic risk score only in subjects <65 years of age (RS-I). (B) ROC curve for incident KOA according to genetic risk score only in subjects ≥65 years (RS-I). AUC, area under the curve.
Discussion
We developed different types of risk prediction models to obtain an estimate of the discriminative power of very basic risk factors such as age, gender and BMI and the additive value of less conventional risk factors such as a genetic risk score and uCTX-II levels. We showed that all risk factor groups by themselves have limited and rather similar predictive value. Addition of either clinical/questionnaire-based variables, a genetic risk score or a biochemical marker, uCTX-II level to age, gender and BMI added little to none predictive value to the model. When adding knee pain and the baseline KL score (KL score of 1 as risk factor compared with 0 as reference) for the knee to the model, the AUC increased dramatically up to 0.86 in the independent validation study RS-II and to 0.76 in the Chingford Study.
The only model that achieves possible usefulness in daily practice is the one that incorporates X-ray information at baseline, ranging from AUC=0.76 in the Chingford Study to AUC=0.86 in RS-II. Although it does not yet represent a ‘high accuracy test’, this finding does have direct clinical implications, as it means that doubtful mild degenerative changes (as expressed in a KL score 1) are important predictors of future incident KOA. The association between a KL score of 1 and incident KOA is not new,19 but this study demonstrates for the first time the predictive value of this risk factor. Although the exact risk prediction for each individual may first need to be calibrated in different population settings, we believe that radiologist should be aware of the predictive value of this KL score of 1 for future incident KOA and should consider this in their reporting to general practitioners20 while keeping in mind that the outcome of this study was radiographic incident KOA.
The most likely explanation for the strong predictive value of these minor radiographic changes is that this score is an early stage of OA in which some structural damage has already occurred and can therefore be seen as a pre-OA stage; therefore, the probability of progression to a definite KOA (KL≥2) is higher compared with people without any signs of OA on a radiograph. In the Netherlands and the UK, it is not common practice for radiologists to report minor OA-like features such as enclosed in a KL score of 1. However, we showed that a KL score of 1 is by far the best predictor of future KOA even stronger than age, gender and BMI alone. Therefore, this finding can be relevant for the general practitioner who requested this radiograph and we would recommend all radiologists to report such minor findings. This knowledge may be used by the practitioner and the patient for making decisions regarding preventative measures (ie, weight loss, avoidance of trauma), enrolment in clinical trials for early OA and monitoring of disease progression.
We have to note that there are a few potentially important risk factors for KOA for which data were not available in our study that were not included in this study. These are injury and physical activity. However as noted above, reviews showed that physical activity has moderate effect sizes (OR<2)21 ,22 and therefore not much additive predictive value is to be expected from these risk factors on top of the baseline variables as shown also for other risk variables in the current model (like for hand OA), although this should be formally tested. The presented risk score needs to be validated for selecting participants for preventive intervention research. Although such research is advocated,23 so far only one preventive trial has been performed.24
We also report that a genetic risk score is not a very good predictor of future radiographic KOA in an elderly population. This is not surprising considering that many other diseases (eg, diabetes mellitus type I) where the same results are observed (for review, see ref. 25). There are several reasons why discrimination between future OA cases and controls based on a genetic risk score is still difficult. Perhaps most importantly, there are only a few genetic variants known that alter the risk of KOA. In the genetic risk score 9 SNPs were included, which all have relatively small effects and therefore high predictive value is not to be expected. The heritability of KOA itself is known to be of moderate significance with an estimated heritability of 40–60%.26 Notably, several studies have illustrated that the ability of genetic risk factors to predict future disease improved with increasing duration of follow-up time.27 We here also demonstrate an improved genetic predictive value for individuals at young age. This suggests a possible clinical application for genetic risk factor prediction when they are measured earlier in life.
uCTX-II levels were sampled at the baseline visit and therefore the predictive value is assessed at the start of the study. It could be that uCTX-II levels will have a higher predictive value for KOA when it would be assessed later in the study and therefore closer by to the event (KOA). However, this is true for most risk factors as often the predictive value increases when the time to the event becomes smaller.
In conclusion, age/gender/BMI or ‘questionnaire-based’ risk factors or a genetic risk score or uCTX-II levels alone are not good predictors of incident radiographic KOA. Also, these risk factors combined had a relatively low predictive value for KOA. In contrast, a model including doubtful minor radiographic degenerative features reached a good predictive value and is applicable in clinical practice.
Acknowledgments
We thank Dr E Odding, Dr A P Bergink, Dr M Reijman, Dr S Dahaghin†, Dr A van Vaalen, Dr J Dekkers, Dr V Kahlmann, Dr M Kool, Dr ES Stille, Dr DAC Sluiter and Dr J Torres Rivas for scoring the radiographs. We thank Dr S C E Schuit and F Imani for help with the collection of urine samples. The authors are grateful to the study participants, the staff from the RS and the participating general practitioners and pharmacists.
References
Supplementary materials
Supplementary Data
This web only file has been produced by the BMJ Publishing Group from an electronic file supplied by the author(s) and has not been edited for content.
Files in this Data Supplement:
- Data supplement 1 - Online supplement
Footnotes
-
Handling editor Tore K Kvien
-
AMV and JBJvM contributed equally.
-
Contributors All authors were involved in drafting the manuscript and critical revision of the manuscript for important intellectual content. They are all guarantors.
-
Funding The RS is supported by the Netherlands Organisation of Scientific Research NWO Investments (nr. 175.010.2005.011, 911-03-012), the Research Institute for Diseases in the Elderly (014-93-015; RIDE2), the Netherlands Genomics Initiative (NGI)/Netherlands Organisation for Scientific Research (NWO) (project nr. 050-060-810) and the Erasmus Medical Center and Erasmus University, Rotterdam. This study is funded by the European Commission framework 7 programme TREAT-OA (grant 200800) and The Netherlands Society for Scientific Research (NWO) VIDI Grant 917103521.
-
Competing interests HJMK is employed at Pfizer as medical advisor since May 2012. This study was part of her PhD thesis at the Erasmus Medical Center Rotterdam from 2008 to 2012. The authors declare that they have no competing interests. None of the funders had any influence in the design of study, collection, analysis and interpretation of the data or approval of the manuscript.
-
Patient consent Obtained.
-
Ethics approval Medical ethnic commission ErasmusMC.
-
Provenance and peer review Not commissioned; externally peer reviewed.