Article Text

Abstract
Background and purpose Blood pressure variability has been found to contribute to worse outcomes after intravenous tissue plasminogen activator, but the association has not been established after intra-arterial therapies.
Methods We retrospectively reviewed patients with an ischemic stroke treated with intra-arterial therapies from 2005 to 2015. Blood pressure variability was measured as standard deviation (SD), coefficient of variation (CV), and successive variation (SV). Ordinal logistic regression models were fitted to the outcome of the modified Rankin Scale (mRS) with univariable predictors of systolic blood pressure variability. Multivariable ordinal logistic regression models were fitted to the outcome of mRS with covariates that showed independent predictive ability (P<0.1).
Results There were 182 patients of mean age 63.2 years and 51.7% were female. The median admission National Institutes of Health Stroke Scalescore was 16 and 47.3% were treated with intravenous tissue plasminogen activator. In a univariable ordinal logistic regression analysis, systolic SD, CV, and SV were all significantly associated with a 1-point increase in the follow-up mRS (OR 2.30–4.38, all P<0.002). After adjusting for potential confounders, systolic SV was the best predictor of a 1-point increase in mRS at follow-up (OR 2.63–3.23, all P<0.007).
Conclusions Increased blood pressure variability as measured by the SD, CV, and SV consistently predict worse neurologic outcomes as measured by follow-up mRS in patients with ischemic stroke treated with intra-arterial therapies. The SV is the strongest and most consistent predictor of worse outcomes at all time intervals.
- stroke
- blood pressure
- thrombectomy
Statistics from Altmetric.com
Introduction
Neurologic outcome after ischemic stroke is affected by age, stroke severity, initial glucose, time to and success of recanalization, among other factors.1–4 Symptomatic intracerebral hemorrhage (sICH) is a feared complication of stroke and is associated with worse outcomes.5 Blood pressure management and its effects on neurologic outcome after acute ischemic stroke has remained a controversial area within stroke care. Mean blood pressure in the first 48 hours after stroke has a U-shaped relationship with clinical outcome, such that extreme lows and highs are associated with poor outcomes.6 Elevated mean arterial blood pressure has been found to contribute to the risk of sICH after intravenous tissue plasminogen activator (IV tPA) administration7 8; however, the relationship after intra-arterial therapies (IAT) has not been determined.
Cerebral autoregulation is globally impaired in ischemic stroke patients,9 particularly in those with larger strokes.10 This impairment in autoregulation may leave the ischemic tissue susceptible to fluctuations in blood pressure. While mean blood pressure has fallen out of favor as being a main contributor to stroke outcome, blood pressure variability (BPV) after stroke has become an area of increasing interest.11 A recent systematic review summarized the available data and concluded that increased BPV after stroke is associated with higher rates of death and disability.11 Infarct growth with increased BPV has been found in some studies and may explain the observed association with worse outcomes.12 13 The association was strongest in those who were treated with antihypertensive medications prior to receiving IV tPA. To date there have been no studies evaluating the effects of BPV in patients with stroke treated with IAT. We hypothesized that, in acute stroke patients treated with IAT, increased BPV is associated with a higher rate of sICH and worse neurologic outcome as measured by a follow-up modified Rankin Scale (mRS) compared with patients with lower BPV.
Materials and methods
Patient identification and characterization
Patients were retrospectively identified by searching the electronic medical record of an academic medical center for ICD-9 codes related to ischemic stroke between 2005 and 2015. The ICD-9 codes for ‘Occlusion of cerebral arteries’ (434.X1) and ‘Acute but ill-defined cerebrovascular disease’ (436.X1) were used with all possible modifiers, an approach that misses <2% of acute ischemic stroke.14 All cases were reviewed by a vascular neurologist to confirm the clinical diagnosis of acute ischemic stroke; confirmatory neuroimaging was required. Additional inclusion criteria included acute treatment with IAT (including mechanical thrombectomy, intra-arterial tPA, intra-arterial abciximab, angioplasty, and/or stenting) and an mRS that could be abstracted from the chart 30–365 days after stroke onset. Patients were excluded if they were younger than 18 years of age, had venous ischemia, had primary ICH, or had a left ventricular assist device in place at the time of the stroke, as such patients have inaccurate blood pressure readings.15
Clinical information was obtained from the chart, including patient demographics, medical comorbidities, admission laboratory values, data from imaging, administration of IV tPA, the type of treatment received in the interventional radiology suite, degree of recanalization as measured by the Thrombolysis in Cerebral Infarction (TICI)16 score, and all hemodynamic data from the entire inpatient admission. TICI scores were taken from procedure reports as documented by the interventional radiologist at the time of the procedure. All patients treated with IAT are admitted to the neurologic intensive care unit at our institution and have standardized blood pressure time interval recordings for the first 24 hours at minimum. This includes a blood pressure every 15 min for the first 2 hours, every 30 min for the next 6 hours, and then hourly for at least 24 hours after treatment until transfer out of the intensive care unit. If hemodynamic data were available from both a blood pressure cuff and arterial line, the arterial line values were prioritized. The majority of patients had arterial line monitoring for at least the first 24 hours in our intensive care unit. We censured hemodynamic data that was considered non-physiologic, although it was <0.05% of all the data. Initial stroke severity as documented by the National Institute of Health Stroke Scale (NIHSS) was recorded. If an NIHSS score was not documented in the medical record, it was extrapolated from the documented neurologic examination using a validated method.17 The Alberta Stroke Program Early CT Score (ASPECTS) was calculated for those patients with a middle cerebral artery stroke by an experienced neuroradiologist.
Blood pressure variability (BPV) characterization
BPV was calculated over three time intervals: 0–24, 0–72, and 0–120 hours. Based on literature supporting the use of multiple approaches to measure BPV,18 11 we represent BPV by three separate measurements: (1) SD of mean blood pressure: (2) coefficient of variation (CV) [%]: SD/BPmean x 100); and (3) successive variation (SV), which is the square root of the average difference in blood pressure between successive measurements:
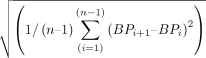 .12 When measuring BPV, it is recommended that multiple methods are used to evaluate associations with outcomes, of which SD, CV, and SV are the most validated statistical methods to represent BPV.11 SD, CV, and SV were calculated separately for systolic blood pressure (SBP) and diastolic blood pressure (DBP).
Outcomes
The mRS closest to 90 days after stroke onset was used and, if the mRS was 0 or 6 at hospital discharge, we carried it forward as a follow-up mRS. The mRS was abstracted from the neurologist’s physical examination if specific documentation of the mRS was not available. sICH was defined according to the European Cooperative Acute Stroke Study 2 definition.19 The TICI score was reported both pre- and post-procedurally and was dichotomized into insufficient (TICI 0–2a) and sufficient recanalization (TICI 2b–3).
Statistical analysis
The χ2 test, Mann–Whitney U test, and Student’s t-test were used to test for intergroup differences of baseline variables. The direct relationship between BPV parameters and mRS was assessed using the Spearman’s rank correlation coefficient. Historically, the primary outcome in stroke trials has been a binary dichotomization of mRS. There has been a trend towards using statistical methods that measure shift in mRS, which typically requires a smaller sample size and is particularly beneficial when the effect of the intervention or clinical factor (BPV) is spread across the entire range of ordinal values.20–22 As such, we measured shift with an ordinal logistic regression model fitted to the outcome of mRS with univariable predictors of systolic BPV. Multivariable ordinal logistic regression models were fitted to the outcome of mRS with covariates that showed independent predictive ability (P<0.1) and systolic BPV parameters. Odds ratios (ORs) and 95% confidence intervals (CIs) were reported per 10-point increase in BPV parameters (mm Hg for SD and SV and percentage increase for CV).11 A Cox proportional HR model was used to assess the effect of BPV (as measured by SD) on sICH within 48 hours of admission. For patients with sICH, SD was calculated only from admission until the sICH. This was compared with the remainder of the cohort without sICH, who contributed 48 hours of BPV. This length of time was chosen because the majority of patients had follow-up imaging to diagnose sICH by 48 hours. Because the interaction between SBPV and TICI score was significant, the result is reported in a stratified analysis fashion by showing a separate ordinal logistic regression model fitted to each category of a dichotomized TICI score: sufficient versus insufficient recanalization.
Results
A total of 182 patients met the inclusion criteria. The number of patients in sequential time intervals decreased secondary to patient discharge or death. Patient demographics and baseline characteristics are shown in table 1. The mean age was 63.2 years and 51.7% were female. Hemodynamic data began at a mean±SD of 223±327 min from the time last seen normal. The median admission NIHSS score was 16 and the median ASPECTS was 6. Prior to IAT, 60.3% of patients had an ASPECTS ≥6 and 47.3% were treated with IV tPA. A second-generation stentriever (Solitaire device) was used in 18% of the cohort, with a variety of techniques used in the remainder: 17% Penumbra device, 31% first-generation stentriever (Merci or Trevo), 8% angioplasty, 8% angioplasty plus stenting, 15% IA tPA alone, and 4% had no recorded intervention due to spontaneous recanalization. Table 2 shows a consistent association between higher systolic BPV and higher mRS at all time intervals. As has been demonstrated previously, this correlation did not consistently hold true for diastolic BPV.11
Patient demographics and clinical characteristics: data shown for entire cohort and by recanalization status
Spearman rank correlation coefficient at three time intervals
In univariable ordinal logistic regression models, all three measures of variability were significantly associated with a 1-point increase in the follow-up mRS (table 3). The strongest correlation was seen in the first 120 hours for all variables measured: systolic SD (OR 3.36, P<0.001), systolic CV (OR 3.71, p 0.002), and systolic SV (OR 4.38, P<0.001) (table 3). After adjusting for covariates significant in univariable analysis, systolic SV was the best predictor of a 1-point increase in mRS at follow-up at all three time intervals (ORs 2.63, 2.68, and 3.23, all P<0.007) (table 3). Although mean SBP was associated with a worse outcome in the univariable ordinal logistic regression analysis (OR 1.02, P<0.013), it was not significant in the multivariable adjusted model (table 3).
OR for a 1-point increase in modified Rankin Scale score at three different time intervals
Of the 182 patients in the cohort, 25 (14%) had sICH in the first 48 hours. sICH rates broken down by modality were: Penumbra (n=8), first-generation stentriever (n=7), second-generation stentriever (n=6), intra-arterial rt-PA (n=1), angioplasty (n=1), and angioplasty plus stent (n=2). When comparing those who had sICH with those who did not, BPV was not statistically different between groups by comparison of intergroup means. The Cox proportional HR for sICH at 48 hours was not significant for systolic SD, SV, or CV.
When comparing the 100 patients with post-IAT sufficient recanalization with the 82 with insufficient recanalization, those who had recanalization had higher ASPECTS on the initial head CT, higher rates of second-generation stentriever device use, and lower follow-up mRS (table 1). The multivariable logistic regression analysis stratified by recanalization success found that only patients with insufficient recanalization were significantly affected by systolic BPV (table 4). SBP SV remained a stronger predictor than S BP SD, or SBP CV in patients with insufficient recanalization at all three time intervals (OR 5.86, 6.34, 5.99, all P<0.026) (table 4).
OR for a 1-point increase in modified Rankin Scale (mRS) score comparing patients with sufficient recanalization versus those with insufficient recanalization
Discussion
Our data suggest that increased BPV is harmful in the days following ischemic stroke onset in patients who are treated with IAT. There are previous studies showing BPV is associated with outcome but, to our knowledge, none have looked specifically at patients receiving IAT. Like previous reports, we failed to find a consistent association between outcome and either diastolic BPV or mean blood pressure.11 Higher systolic BPV, measured by SD, CV and SV, was consistently associated with worse outcomes measured by follow-up mRS, even after adjusting for covariates with independent predictive ability, with the SV being the BPV measurement with the most consistent association with outcome. This association appears strongest in patients with insufficient recanalization following IAT.
The finding that BPV had a differential effect on those with insufficient recanalization has been reported in studies of patients treated with IV rt-PA.13 There are higher lesion volumes and larger ischemic penumbras in patients with insufficient recanalization.23 Cerebral autoregulation is compromised in larger strokes,10 making fluctuations in blood pressure more deleterious to larger ischemic penumbras. There were several significant differences between the recanalization groups in our study, including ASPECTS and percentage of second-generation stentriever devices used, but these were not independently predictive of mRS in the ordinal logistic regression model and, thus, were not controlled for in the final model.
Contrary to our pre-specified hypothesis, systolic BPV did not have an effect on sICH within 48 hours of hospital admission. Previous studies have found an association between BPV and sICH in patients treated with IV rt-PA.11 It has been proposed that the direction of blood pressure change—an increment compared with a decrement—is what predisposes to sICH,11 which we did not specifically evaluate in this study. We stopped including blood pressure readings after the time of sICH diagnosis because it is plausible that the hemorrhage itself would cause increased systolic BPV.
In previous IAT trials the sICH rates vary between modality used. In patients who undergo intra-arterial rt-PA, 10–15% will have sICH.24 Between 0% and 17% of patients who undergo mechanical thrombectomy will have sICH.25 First-generation devices were typically associated with higher sICH rates—for example, the MERCI device was associated with a 5–14% sICH rate.26 Lower sICH rates of 2–8% have been reported with second-generation devices.27–30 Our study shows high sICH rates overall, which we attribute to the heterogeneous IAT modalities in our cohort and the concurrent use of intra-arterial rt-PA in some patients who had penumbra or first-generation stentrievers. This limits our ability to detect the true effect of BPV on sICH in this cohort and our observed lack of an association will have to be replicated in more uniform cohorts.
This study has other important limitations. First, it a retrospective study with variable blood pressure recording methods and intervals between patients. We made every effort in our study to obtain good quality data to mitigate the limitations inherent to retrospective studies Second, patients presented at variable times from symptom onset to our tertiary center, making accurate hyperacute measurements of blood pressure impossible. It is possible that blood pressure in the very early minutes to hours after a stroke contributes to our outcomes. Third, we had a relatively small sample size and a gradually decreasing number of patients over the first 120 hours because of patient death or discharge. Fourth, outcomes were not prospectively collected: the mRS was often extracted from the neurologist’s examination, which may have led to inaccuracies; clinic visits were not at consistent time intervals making the timing of follow-up mRS variable; and some patients were lost to follow-up. Last, the number of second-generation stentriever devices was low despite continuing our review to include as many current patients as possible. However, these limitations are somewhat mitigated by excellent capture of blood pressure readings taken according to real-word clinical protocols after IAT.
In conclusion, in our cohort of stroke patients treated with IAT, higher BPV, as measured by SD, CV, and SV, was significantly associated with a 1-point increase in mRS at follow-up, which was strongest in those who had insufficient recanalization. This study gives valuable information about BPV in this subset of patients treated with IAT. It remains unknown how treatments aimed at reduction of fluctuations in blood pressure may affect outcomes, which warrants further prospective evaluation.
References
Footnotes
Contributors AEB, GJS, ADH: Substantial contributions to the conception or design of the work, the acquisition, analysis, and interpretation of data for the work. MJW, JJW, JJM, SA: Substantial contributions to the conception or design of the work. JSM: Acquisition, analysis, or interpretation of data for the work. AEB: Drafting the work and revising it critically for important intellectual content. MJW, JSM, JJW, GJS, JJM, SA, ADH: Revising it critically for important intellectual content. AEB, MJW, JSM, JJW, GJS, JJM, SA, ADH: Final approval of the version to be published. All authors agree to be accountable for all aspects of the work in ensuring that questions related to the accuracy or integrity of any part of the work are appropriately investigated and resolved.
Funding This investigation was supported by the University of Utah CTSA Biostatistical Core through Grant 5UL1TR001067-02 (formerly 8UL1TR000105 and UL1RR025764). Research reported in this publication was supported by the National Center for Advancing Translational Sciences of the National Institutes of Health under Award Number KL2TR001065. StrokeNet NIH funding through grant 5U10NS086606-03.
Competing interests None declared.
Ethics approval University of Utah IRB.
Provenance and peer review Not commissioned; externally peer reviewed.