Article Text

Abstract
Objective: To examine the relationship between the numbers of people walking or bicycling and the frequency of collisions between motorists and walkers or bicyclists. The common wisdom holds that the number of collisions varies directly with the amount of walking and bicycling. However, three published analyses of collision rates at specific intersections found a non-linear relationship, such that collisions rates declined with increases in the numbers of people walking or bicycling.
Data: This paper uses five additional data sets (three population level and two time series) to compare the amount of walking or bicycling and the injuries incurring in collisions with motor vehicles.
Results: The likelihood that a given person walking or bicycling will be struck by a motorist varies inversely with the amount of walking or bicycling. This pattern is consistent across communities of varying size, from specific intersections to cities and countries, and across time periods.
Discussion: This result is unexpected. Since it is unlikely that the people walking and bicycling become more cautious if their numbers are larger, it indicates that the behavior of motorists controls the likelihood of collisions with people walking and bicycling. It appears that motorists adjust their behavior in the presence of people walking and bicycling. There is an urgent need for further exploration of the human factors controlling motorist behavior in the presence of people walking and bicycling.
Conclusion: A motorist is less likely to collide with a person walking and bicycling if more people walk or bicycle. Policies that increase the numbers of people walking and bicycling appear to be an effective route to improving the safety of people walking and bicycling.
- motor vehicle crashes
- motorist behavior
- pedestrian
- bicyclist
- non-motorized traffic
- physical activity
- developed world
Statistics from Altmetric.com
- motor vehicle crashes
- motorist behavior
- pedestrian
- bicyclist
- non-motorized traffic
- physical activity
- developed world
Motor vehicle collisions are a leading global cause of death and disease burden.1,2 Worldwide, more people die in motor vehicle collisions while walking and bicycling than while driving.3
In examining injuries to people walking and bicycling, intuition suggests that injuries increase in locations where, and in time periods when, more people walk and bicycle.4 However, do injuries increase linearly with the amount of walking and bicycling? Is the situation the same as with billiards—will doubling the number of balls on the table double the number of collisions? If so, it implies these collisions are random and “accidental”. If not, then it implies that the numbers of people walking, bicycling, and motoring affects human behavior and hence behavior has an important role in preventing these injuries.
In less motorized countries, non-motorized users account for most of the road users killed in motor vehicle crashes, in contrast to the more motorized countries, where most deaths occur inside motorized four wheelers.5 While information on fatalities is collected in the developing world, reliable information on the amount of walking and bicycling is unavailable, limiting this investigation to industrialized countries.
Across Europe and North America, the amount of walking and bicycling varies tremendously—from 6% of all trips (USA) to 46% (the Netherlands).6 Yet the per capita fatal injury rate to people walking and bicycling is more or less the same in the two countries: 1.9/100 000 in the Netherlands and 2.1/100 000 in the USA.7 This surprising result shows that the numbers of pedestrians and bicyclists fatally injured does not vary linearly with the numbers of walkers and bicyclists.
Research at specific sites has shown that collisions between a motorist and a person walking or bicycling diminish where more people walk and bicycle. Ekman examined numbers of pedestrians, bicyclists, and motorists, and serious conflicts among them at 95 intersections in Malmö, Sweden. He found that after adjusting for the number of bicyclists, the number of conflicts/bicyclist was twice as great at locations with few bicyclists compared with locations with more. In fact, the number of conflicts/bicyclist decreased abruptly with more than 50 bicyclists/hour. With pedestrians, Ekman found that although the number of conflicts/pedestrian was largely unaffected by numbers of pedestrians, the conflict rate was still affected by numbers of motorists.8
Leden also reported a non-linear relationship in two examinations of intersections. In a before and after study, he examined changes in numbers of bicyclists and collisions between motorists and bicyclists in response to changes in physical configuration at 45 non-signalized intersections between bicycle paths and roadways in Gothenburg, Sweden. The total number of collisions increased with the 0.4 power of the increasing use of the intersections by bicyclists.9 He also examined police reported injuries to people walking at approximately 300 signalized intersections in Hamilton, Ontario, Canada. The number of collisions increased with the 0.32 to 0.67 power with increasing numbers of pedestrians.10
This paper explores this non-linear phenomenon noted above. Does it occur only at specific intersections, or also at larger scales, such as for a city or country or at different time periods with differing numbers of walkers or bicyclists? Is the relationship consistent and replicable? Is it plausible? Is there a dose-response relationship? And what are the likely causal mechanisms?11
METHODS
To explore the relationship between the amount of walking and bicycling and the collisions involving a motorist and a person walking or bicycling, it was necessary to identify locations and time periods with data for both injuries and the amount of walking and bicycling.
In the industrialized world, fatal motor vehicle injuries are recorded well; injury statistics less so.12 Additionally, although motor vehicle use is measured, few jurisdictions collect similar data for the numbers of walkers and bicyclists.13 Most available estimates are obtained by surveys. Then again, since much walking and bicycling occurs in short trips that may not be recorded in surveys (for example, children crossing the street), survey data may be inaccurate as well.
Comparisons between jurisdictions are also complex. Laws governing motor vehicle operation, roadway design, techniques for collecting the number of injuries and numbers of people walking and bicycling, and other perhaps significant factors may vary. To minimize these complexities when comparing across jurisdictions, this analysis uses data sets collected by one entity.
This paper uses five data sets (three population level and two time series) to compare the amount of walking or bicycling and the injuries incurring in collisions with motor vehicles.
For each data set, the measure of injuries to people walking or bicycling was compared to measure of walking and bicycling to determine the relationship. Parameters were calculated using least squares analysis for the function shown in equation (1): where I is the injury measure, E is the measure of walking or bicycling, and a and b are the parameters to be computed.
Exponent b indicates the change in the number of injuries in the population in response to changes in walking and bicycling. With b equal to 1, the growth in injuries with increasing exposure would be linear; b less than 1 indicates the growth in injuries would be less than linear; and b less than 0 indicates that increasing the number of walkers or bicyclists would decrease the total number of injures to people walking and bicycling in a given population.
For an individual walking or bicycling, the relevant risk measure is for a unit of walking or bicycling. This risk can be estimated by dividing both sides of equation (1) by the measure of walking and bicycling, E, resulting in equation (2):
The graphs show this latter relationship, as it is easier to understand visually.
DATA
In this analysis, three population data sets are employed to examine the relationship between numbers of walkers and bicyclists and the numbers of collisions with motorists across varying sizes of analysis areas, from cities to countries. In addition, two time series data sets are used to examine the effect of fluctuations in walking and bicycling on injuries.
Walking and bicycling in California cities
Cities within one state in the United States allow a relatively consistent comparison. California has one law governing traffic and consistent traffic control devices. However, cities may choose their own roadway design features. In practice, roadway designs vary mostly by era of urbanization.
Injury data were obtained from police collision reports as summarized by the California Highway Patrol for year 2000.14 Injury incidence rates were calculated using the US census population estimates as adjusted by the State of California’s Department of Finance for year 2000.15 Of the 111 cities in California with a population over 60 000, the 68 cities with per capita injury rates to people walking and bicycling both greater than 30/100 000 were examined.
The US Census Bureau collects journey to work trip data for the year 2000.16 While such trips constitute only a fraction of all person trips, this analysis assumes that mode of journey to work is in proportion to mode for other person trips and uses it as a proxy for other person trips.
Walking, bicycling, and moped riding in 47 Danish towns
The Danish Bureau of Statistics collected travel behavior for 47 towns with populations greater than 10 000 for years 1993–96.17 (Søren U Jensen provided the travel and injury data for this analysis.)
Walking and bicycling in European countries
European countries vary as to geography, roadway designs, traffic laws, and societal mores. A European Commission sponsored report compiled bicycling distances for 14 countries and person trips by foot and bicycle for eight countries for 1998.18 The Organization for Economic Co-operation and Development’s International Road Traffic and Accident Database reports traffic fatalities and population numbers for 1998.19,20
Bicycling in the United Kingdom, 1950–99
The Department of Environment, Transport and the Regions in the United Kingdom measures the distance bicycled with annual surveys, and compiles fatality data, which combined allow a time series analysis.21
Bicycling in the Netherlands, 1980–98
The Netherlands Centraal Bureau voor de Statistiek measures the distance bicycled with annual surveys and compiles fatality data.22
RESULTS
Table 1 shows the calculated results. Parameter b indicates the exponential change in the number of injuries in the population in response to changes in walking and bicycling.
Calculated results
Walking and bicycling in California cities
Per capita injury rates to pedestrians and bicyclists vary fourfold among the 68 cities, and the portion of journey to work trips made by foot and bicycle varies more than 15-fold and 20-fold (respectively). Dividing the per capita injury numbers by the fraction of work trips on foot or bicycle results in a fivefold and eightfold range of risk for a person walking or bicycling in the 68 cities. Figure 1 shows that the likelihood of an injury is not constant but decreases as walking or bicycling increases.
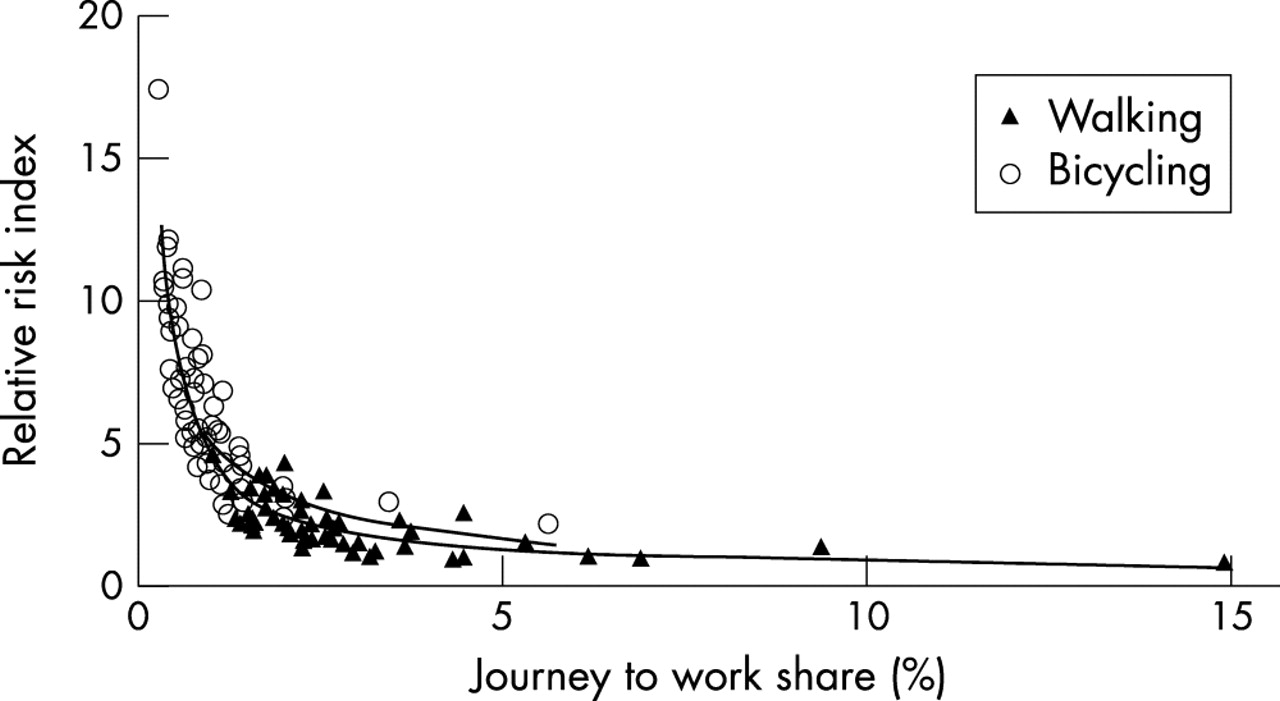
Walking and bicycling in 68 California cities in 2000.
Walking and bicycle and moped riding in 47 Danish towns
Per capita injury rates to pedestrians and bicyclists varied twofold, and the number trips made by foot and bicycle varied more than fourfold and threefold (respectively). Dividing the per capita injury numbers by the aggregate distance walked or bicycled indicates a fivefold range of risk for a person walking or bicycling for the 47 towns. Figure 2 shows that despite considerable scatter in the results, pedestrians are safer in towns with greater walking and bicyclists are safer in towns with more bicycling.
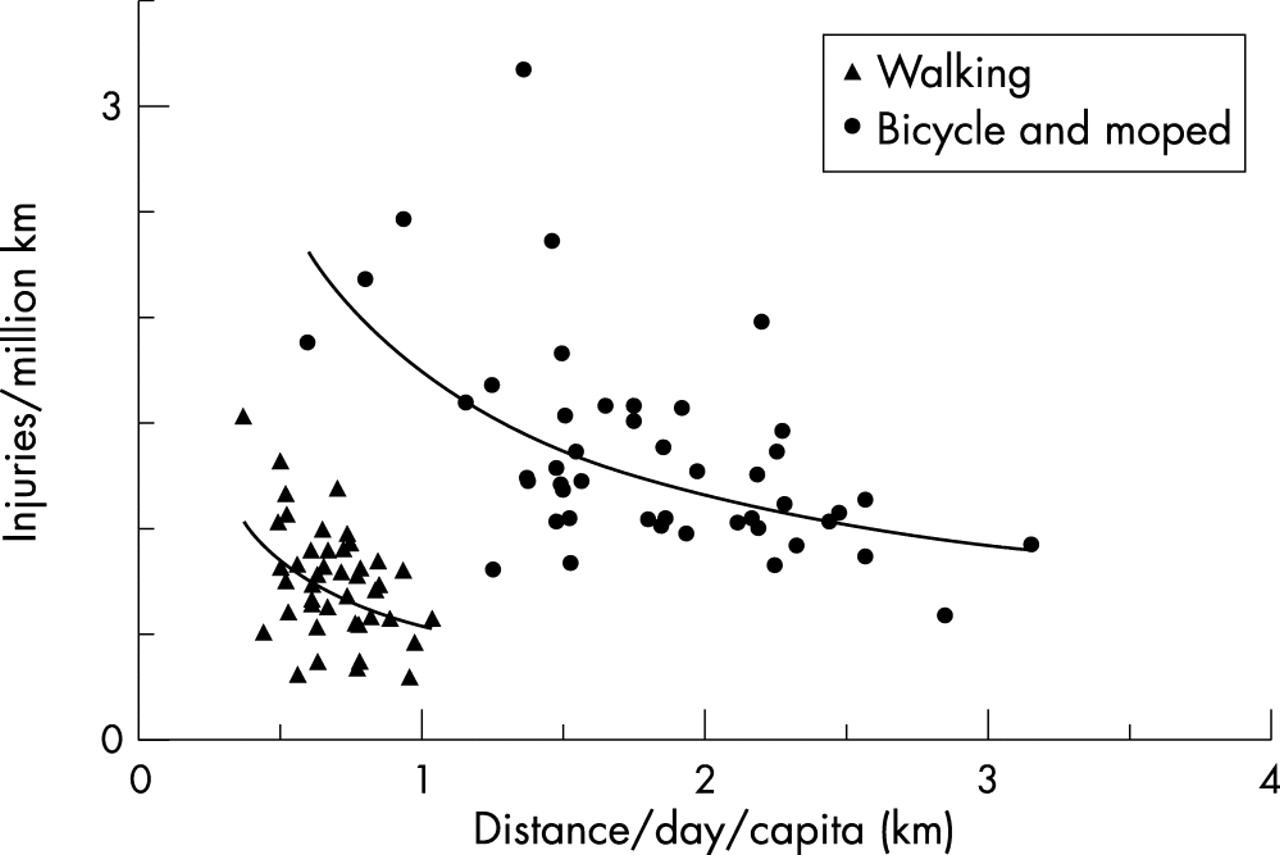
Walking and bicycling in 47 Danish towns in 1993–96.
Walking and bicycling in European countries
In the 14 countries with data, distance bicycled per capita varied 10-fold. Across them, the number of persons killed while bicycling varied fourfold. Dividing the number of bicyclist deaths per capita by the distance bicycled per capita indicates a nearly 20-fold range of risk for a person bicycling a given distance. Figure 3 shows that the number of bicyclist fatalities/distance bicycled decreases with increasing distance bicycled per capita.
Bicycling in 14 European countries in 1998.
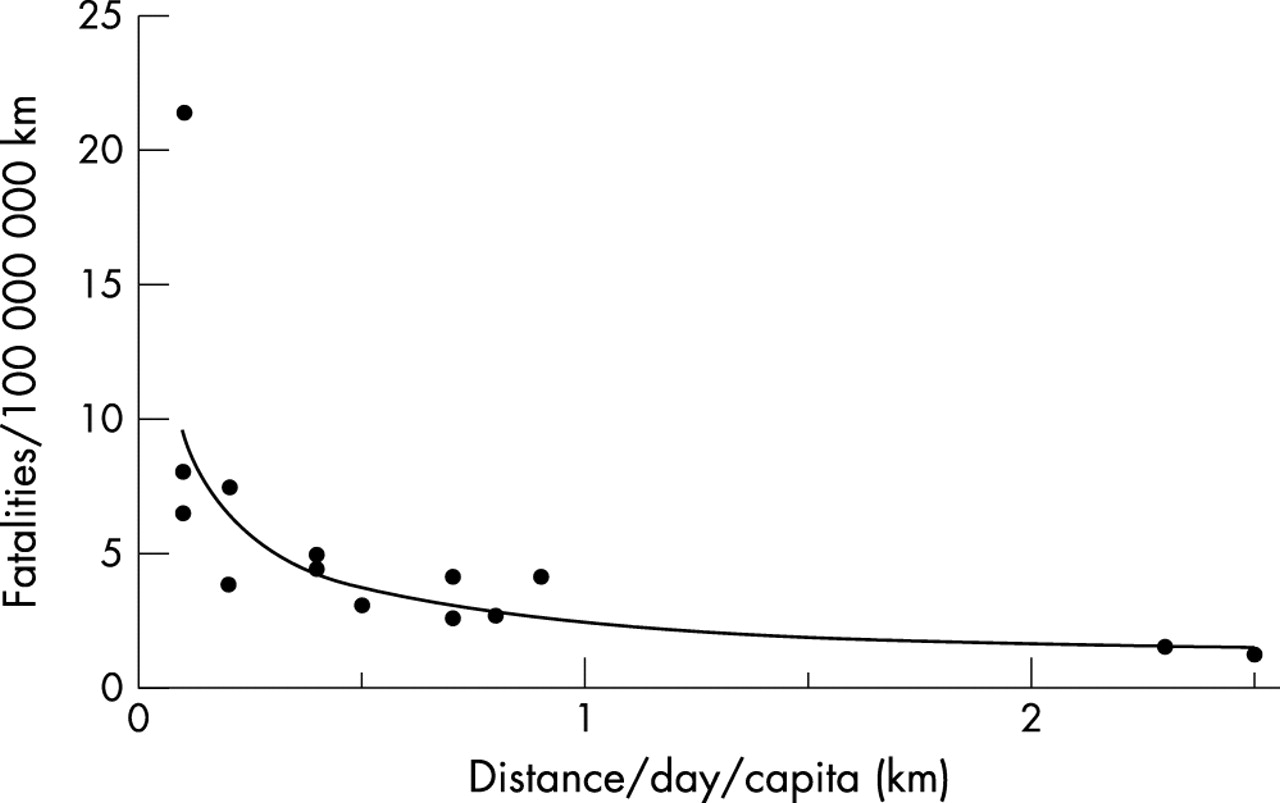
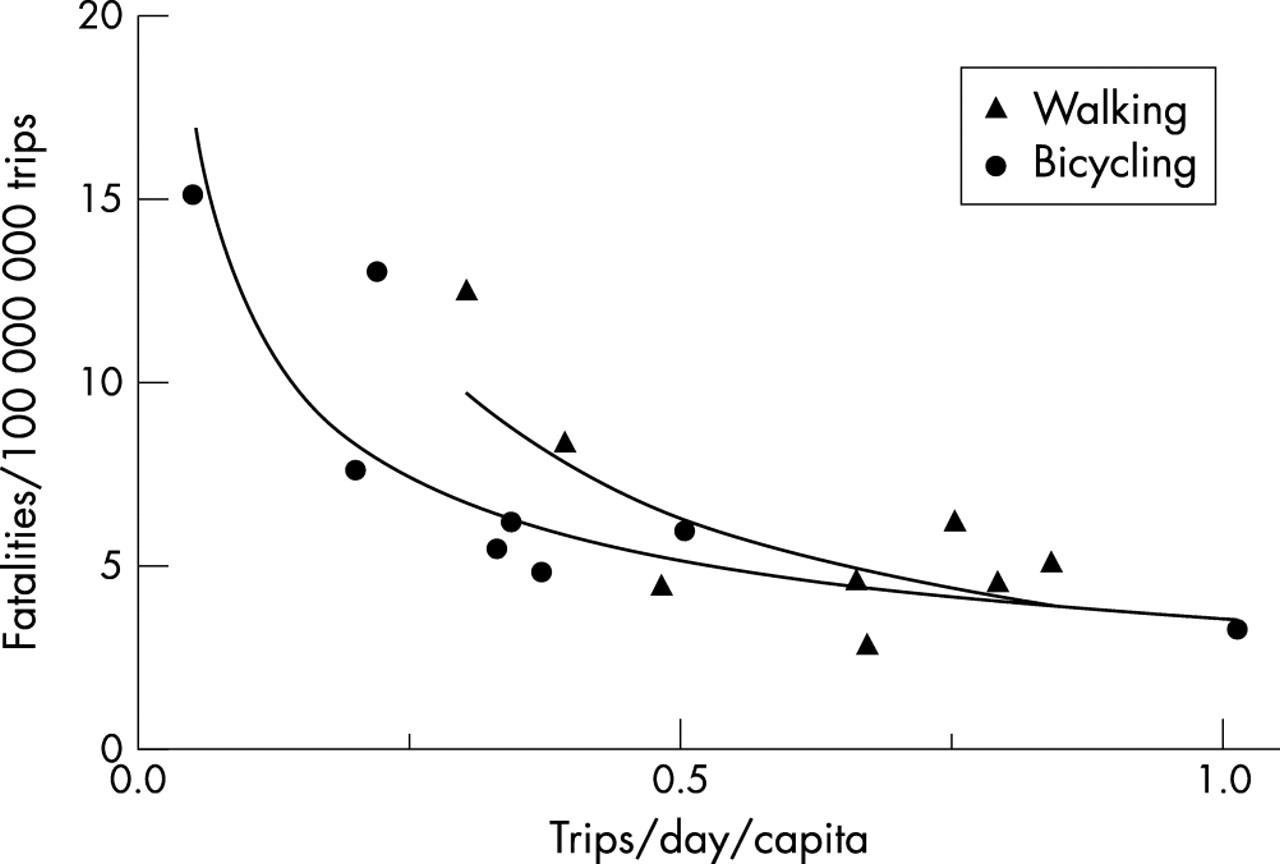
In the eight countries with person trip data, the number of bicycle trips per capita varied by more than 10-fold and the number of trips on foot varied threefold. Dividing the per capita fatality rate by the daily foot and bicycle trips per capita data indicates a nearly fivefold range of risk of death for each trip. Figure 4 shows that the risk decreases with increasing trips on foot or on bicycle.

Walking and bicycling in eight European countries in 1998.
Bicycling in the United Kingdom, 1950–99
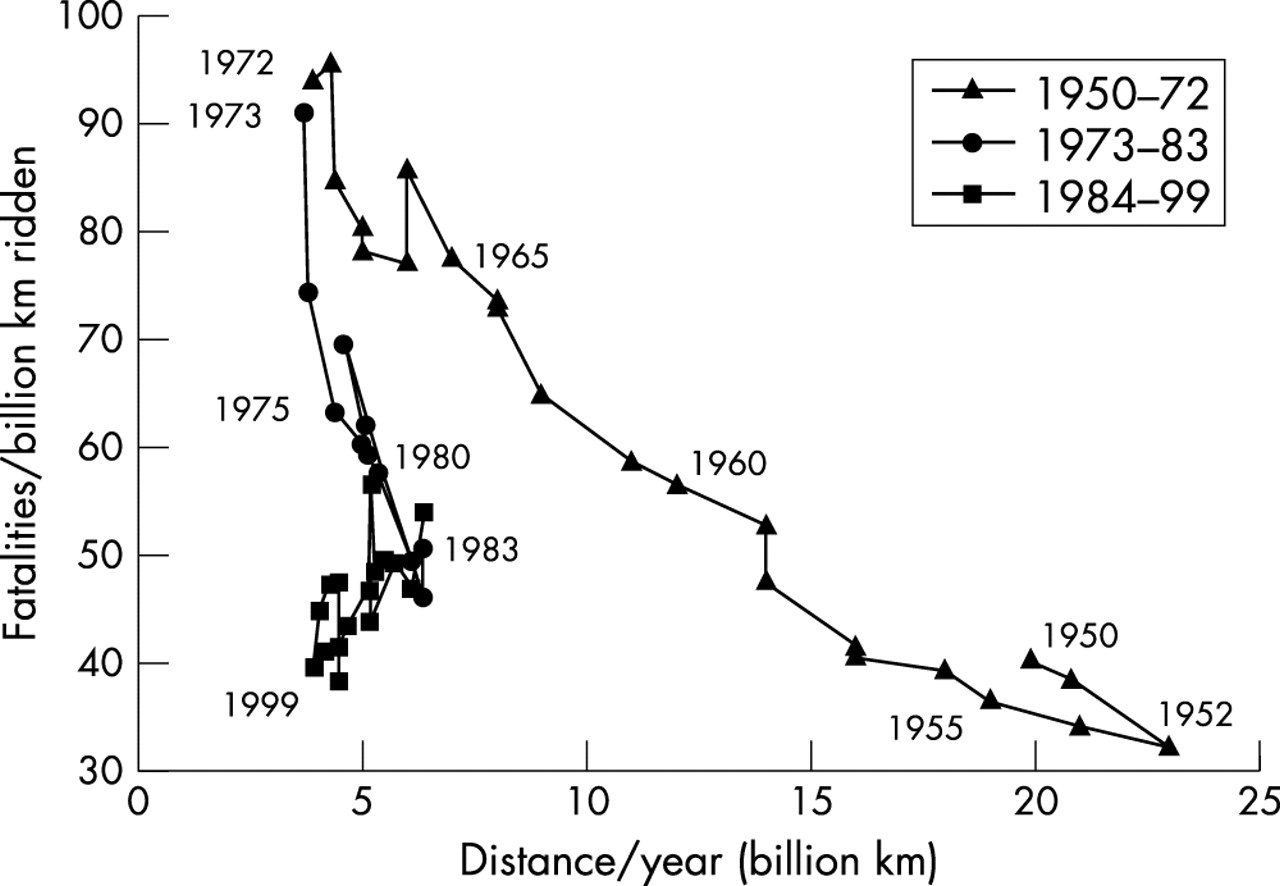
In the United Kingdom from 1950 to 1999, distance bicycled varied sixfold and bicyclist fatalities varied fivefold. Dividing the number of bicyclist deaths per capita by distance bicycled indicates a threefold range of risk for a given distance bicycled. Figure 5 shows the complex relationship between the number of bicyclist fatalities and the distance bicycled. Separating the data into three segments using the inflection points for distance ridden allows some understanding. Until 1973, as the United Kingdom motorized, the generally decreasing distance bicycled was accompanied by an increase in bicyclist fatalities/distance bicycled. From 1973 to 1983, the small increase in distance bicycled was accompanied by a large decrease in bicyclist fatalities/distance bicycled. This resurgence in bicycling may be related to the oil embargo and resulting increase in energy costs. In stark contrast, from 1984 to 1999, the decrease in distance bicycled was matched by a decrease in bicyclist fatalities/distance bicycled, indicating an increasing risk of a bicyclist fatality. This change may be related to the seatbelt law in 1983. One review suggested that the increase in seatbelt use transferred some risk to pedestrians and bicyclists as motorists felt safer and drove more aggressively and further.23 Average motorist speeds in built up areas in the United Kingdom increased from 45 km/h in 1981, before compulsory use of seatbelts, to 53 km/h in 1997.24 Less bicycling is a plausible response to more aggressive and faster motorists.

Bicycling in the United Kingdom from 1950–99.
Bicycling in the Netherlands, 1980–98
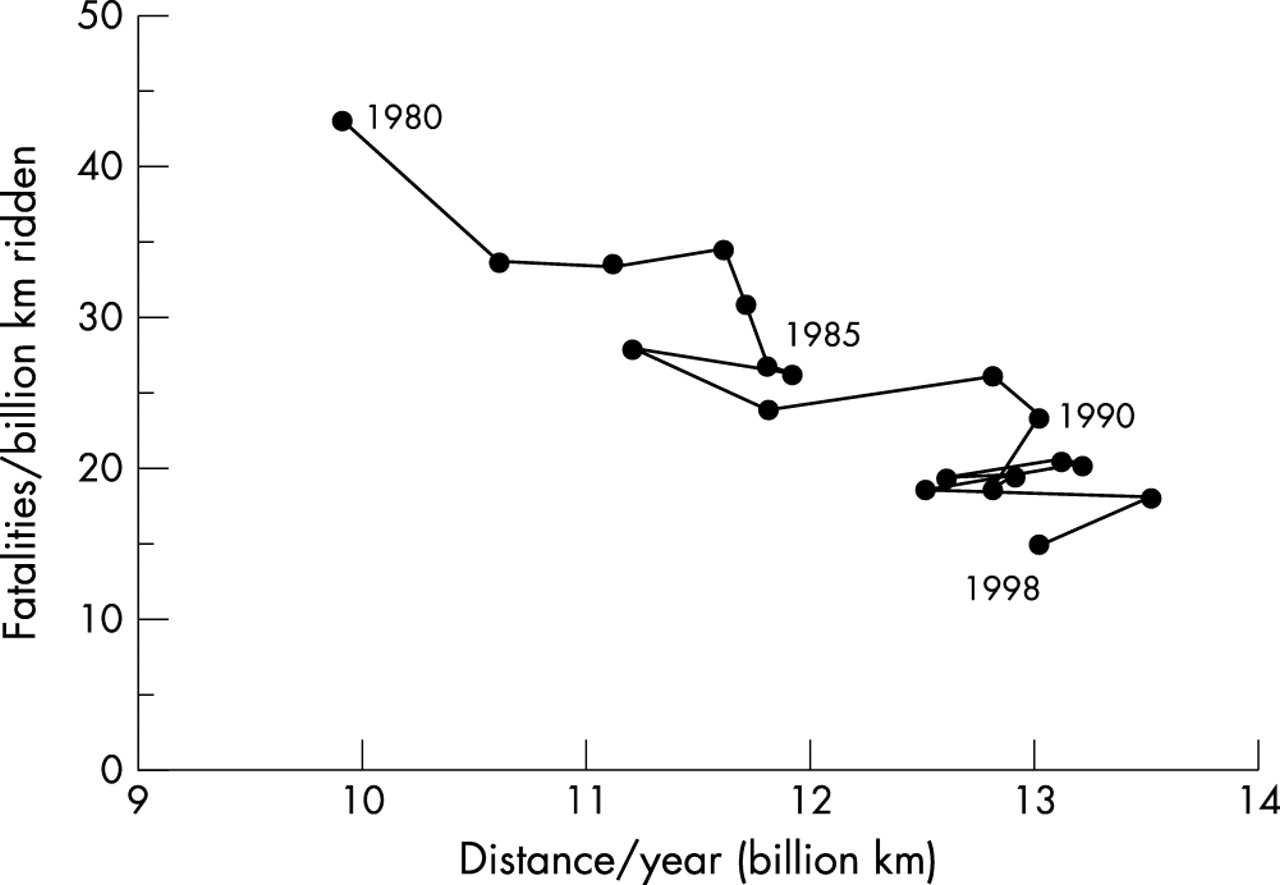
In the Netherlands, bicycling distances increased generally from 1980 to 1998. Annual bicyclist fatalities in the same time period decreased from 426 to 194. Dividing the number of bicyclist deaths per capita by distance bicycled indicates a nearly threefold range in risk for a given distance bicycled. Figure 6 shows that the number of bicyclist fatalities/distance traveled decreased rapidly with increasing distance bicycled.
Bicycling in the Netherlands from 1980–98.
DISCUSSION
Multiple independent data sets show that the total number of pedestrians or bicyclists struck by motorists varies with the 0.4 power of the amount of walking or bicycling (respectively). This relationship is consistent across geographic areas from specific intersections to cities and countries. Furthermore, Leden found the same relationship in a before and after study of 45 bicycle path intersections with roadways.9 In the industrialized countries examined, this relationship holds across a wide range of walking and bicycling.
Interpreting the time series data is complicated as some changes could result from forces not measured. Improvements in post-trauma medical care complicate comparing years—indeed for the period 1989 to 1995 Roberts et al found a 16%/year reduction in fatalities for severely injured children in the United Kingdom.25 Changes in the distribution of age in the population could also complicate comparisons.26 Furthermore, while the number of fatalities are likely accurately reported, record keeping for the distance bicycled may have changed. Also, the risk of some bicycle fatalities may be unrelated to distance traveled (for example, fewer children playing in residential areas might change the fatality numbers but not distance traveled).
Nonetheless, the British time series data indicate that decreasing bicycle riding leads to increased risk, and increasing risk leads to decreasing bicycle use. In contrast, over the last two decades, the Netherlands has implemented a range of policies to encourage people to walk and bicycle and make them safer.6 These efforts have succeeded in increasing bicycle use and decreasing risk.
The time series data also provide an understanding of cause. The possible explanations are changes in human behavior, roadway design, laws, and social mores. However, insofar as the changes seen in the time series data occurred rapidly and with both increasing and decreasing amounts of bicycling, it is improbable that the roadway design, traffic laws, or social mores, all of which change relatively slowly, could explain the relationship between exposure and injury rates. The more plausible explanation involves changes in behavior associated with changes in the amount of walking and bicycling.
Whose behavior changes, the motorist’s or that of the people walking and bicycling? It seems unlikely that people walking or bicycling obey traffic laws more or defer to motorists more in societies or time periods with greater walking and bicycling. Indeed it seems less likely, and hence unable to explain the observed results. Adaptation in motorist behavior seems more plausible and other discussions support that view. Todd reported three studies showing “motorists in the United States and abroad drive more slowly when they see many pedestrians in the street and faster when they see few”.27 In addition, motorists in communities or time periods with greater walking and bicycling are themselves more likely to occasionally walk or bicycle and hence may give greater consideration to people walking and bicycling. Accordingly, the most plausible explanation for the improving safety of people walking and bicycling as their numbers increase is behavior modification by motorists when they expect or experience people walking and bicycling.
Given the apparent response of motorists, further study is needed of ways to remind motorists of the presence of people walking and bicycling. Would different roadway design help? Do specific interventions such as marking crosswalks, placing Children Playing signs, and designating bicycle lanes have a community-wide impact? Studies to date on these approaches have tended to examine only the immediate area and ignore community-wide effects. However, it seems reasonable that increasing motorist awareness of people walking and bicycling would provide benefits beyond just the immediate area. Such awareness techniques should be investigated for community wide health benefits.
Another question arises about laws governing the interaction between motorists and vulnerable road users. For example, in the United States, if a motorist strikes a person walking between intersections, the motorist is unlikely to face criminal charges.27 Yet if motorist behavior largely controls the number of collisions, laws should be revised to reflect this finding.
CONCLUSIONS
A motorist is less likely to collide with a person walking and bicycling when there are more people walking or bicycling. Modeling this relationship as a power curve yields the result that at the population level, the number of motorists colliding with people walking or bicycling will increase at roughly 0.4 power of the number of people walking or bicycling. For example, a community doubling its walking can expect a 32% increase in injuries (20.4 = 1.32). Taking into account the amount of walking and bicycling, the probability that a motorist will strike an individual person walking or bicycling declines with the roughly −0.6 power of the number of persons walking or bicycling. An individual’s risk while walking in a community with twice as much walking will reduce to 66% (20.4/2 = 2-0.6 = 0.66). Accordingly, policies that increase the numbers of people walking and bicycling appear to be an effective route to improving the safety of people walking and bicycling.
Key points
-
Where, or when, more people walk or bicycle, the less likely any of them are to be injured by motorists. There is safety in numbers.
-
Motorist behavior evidently largely controls the likelihood of collisions with people walking and bicycling.
-
Comparison of pedestrian and cyclist collision frequencies between communities and over time periods need to reflect the amount of walking and bicycling.
-
Efforts to enhance pedestrian and cyclist safety, including traffic engineering and legal policies, need to be examined for their ability to modify motorist behavior.
-
Policies that increase walking and bicycling appear to be an effective route to improving the safety of people walking and bicycling.
Acknowledgments
In 1998, the Pasadena, California, City Council asked whether their city was a dangerous place to bicycle, prompting this investigation into the importance of accounting for the amount of walking and bicycling. Anne Seeley of California Department of Health Services asked if the public health goal of more walking and bicycling conflicted with reducing injuries, adding impetus to understanding the role of safety in numbers. Chris Morfas, Søren Jensen, Michael Ronkin, Rick Warring, Malcolm Wardlaw, John Pucher, Lewis Dijkstra, and Petra Staats provided data to help answer these questions. Charles Komanoff, Marie Birnbaum, and three anonymous reviewers provided valuable editorial advice. Virginia Gangsei helped clarify the presentation.
REFERENCES
Linked Articles
- Correction