
Updating the Evidence on the Association between Serum Cholesterol and Risk of Late-Life Dementia: Review and Meta-Analysis
Abstract
Background: Cohort studies have reported that midlife high total serum cholesterol (TC) is associated with increased risk of Alzheimer’s disease (AD) in late-life but findings have been based on few studies and previous reviews have been limited by a lack of compatible data.
Objective: We synthesized all high quality data from cohort studies reporting on the association between total serum cholesterol measured and late-life cognitive outcomes including Alzheimer’s disease (AD), vascular dementia (VaD), any dementia, mild cognitive impairment (MCI), and cognitive decline.
Methods: The literature was searched up to October 2016 using a registered protocol. Thirty-four articles meeting study criteria were identified. Seventeen studies published from 1996 to 2014, including 23,338 participants were included in meta-analyses.
Results: Relative risk of developing AD for adults with high TC in midlife was 2.14 (95% CI 1.33–3.44) compared with normal cholesterol. Individual studies that could not be pooled also reported high TC in midlife increased the risk of MCI and cognitive decline in late-life. High TC in late-life was not associated with MCI, AD, VaD, any dementia, or cognitive decline. Late-life measured HDL cholesterol and triglycerides were not associated with increased risk of VaD, and HDL was not associated with risk of MCI, AD, or any dementia. There were insufficient data to examine other cholesterol sub-fractions, sex differences, or APOE interactions.
Conclusions: Significant gaps in the literature regarding TC and late-life dementia remain. Evidence suggests that high midlife TC increases risk of late-life AD, and may correlate with the onset of AD pathology.
INTRODUCTION
The link between cholesterol and Alzheimer’s disease (AD) is supported by the identification of clusters of genes (apolipoprotein E4, single-nucleotide polymorphisms for clusterin (CLU), ABCA7, and PICALM) that influence lipid binding and metabolism in the brain [1]. There is also evidencefrom epidemiological studies that links high total serum cholesterol (TC) in midlife to sporadic AD in old-age [2]. Lipid measures including high density lipoproteins (HDL) and TC in midlife are currently used in assessment tools that evaluate risk of AD and dementia [3, 4].
However, the evidence base from epidemiological studies has been limited by a lack of studies reporting data on the association between cholesterol and cognitive outcomes in general, and more specifically a lack of data compatible for pooling, due to differing methods of categorizing serum cholesterol measures. Our previous review of observational studies found insufficient data were available to evaluate the association between high TC and vascular dementia (VaD) [5], despite TC being a cardiovascular risk factor. Analyses supported the association between high TC in midlife and late-life AD but included few studies. We also found no association between raised serum cholesterol in late-life and incident AD or VaD, but this was also based on a small number of studies and hence conclusions remained tentative and require further evaluation now that more datasets are available.
The current systematic review was planned to update and extend our previous review [5] with newly available data from prospective cohort studies. It specifically evaluates a) whether high TC in midlife predicts cognitive decline, or incident cognitive impairment or dementia in late-life in prospective, population-based studies, and b) whether high TC in late-life predicts cognitive decline, or incident cognitive impairment or dementia in late-life in prospective, population-based studies. Where data were available we also sought to evaluate whether high density lipoprotein (HDL-C), low density lipoprotein (LDL-C), and triglycerides were predictive of cognitive decline and dementia.
MATERIALS AND METHODS
Registration of protocol and reporting
The review was registered with the International Prospective Register of Systematic Reviews (PROSPERO CRD42015026727) [6] and reported in accordance with the PRISMA checklist [7].
Search strategy
Databases PsychInfo, PubMed, and Cochrane Collaboration were searched from inception to September, 2016. Reference lists of all papers identified were screened for other published papers. The following combination of selected body cholesterol terms and cognition terms were used for the search where an asterisk (*) indicates a word truncation. Dementia and cognition terms included: Cognit*, Memory, Attention, Reaction time, Speed of processing, Processing speed, Crystallized ability, Crystallized intelligence, Fluid ability, Fluid intelligence, General mental ability, GMA, Intelligence, Executive function, Neuropsychological testing, Mini mental stat* exam*, MMSE, Dementia, Alzheimer (auto explode), Mild cognitive impairment, MCI. Cholesterol terms used in the search were: Cholesterol, Serum cholesterol, Total cholesterol, APOE, High density lipoprotein or HDL and Low density lipoprotein or LDL. The search was limited to articles in English reporting data from humans.
Inclusion and exclusion criteria
Study inclusion criteria ensured that all articles included in the review met the Oxford Centre for Evidence-Based Medicine Level of Evidence 1B(http://www.cebm.net/index.aspx?o=1025). Additi-onal quality ratings were conducted for all studies meeting criteria using a checklist adapted from previous reviews, and the Newcastle Ottawa scale [8, 9]. Studies were required to be prospective, longitudinal, population based studies with a minimum of 100 participants and minimum follow-up period of one year, and include a measure of TC at baseline. The outcome measure had to include either dementia or cognitive decline with serum cholesterol as a predictor or covariate in the analyses. Studies on dementia needed to have screened for dementia at baseline or adjusted for incident dementia and/or baseline cognition performance in analyses, unless two standard deviations from the mean age of participants at baseline was less than 60 years old. Studies evaluating cognitive change were required to have measured cognition at both baseline and follow-up periods and either implemented a dementia assessment at baseline that excluded those participants with cognitive impairment or dementia, or adjusted for incident dementia and/or baseline cognition performance in analyses. Excluded studies were those that were cross sectional, experimental, case control studies, where the sample was not population-based, or where family members of participants with dementia were included. Studies were excluded if subjective assessments of cognition were used (either self-report or clinician ratings, rather than objective cognitive testing), or dementia diagnoses were obtained from only medical records, where there was no assessment of cognition at baseline when the outcome was cognitive performance (i.e., no longitudinal cognitive data).
Abstract screening and article selection
Citations were downloaded into an EndNoteTM reference database by KA-M and screened in two stages. When in doubt, the full-text article was obtained. The selected journal articles retrieved were examined by at least two of the authors (KJA, KA-M,RP) and rated against the selection criteria (KJA, KA-M, RP). Abstracts and articles were discussed and reassessed where reviewers differed on including the paper until a consensus was reached (KJA, KA-M, RP). Reference lists of included articles were also searched for potential articles for inclusion (KA-M).
Data extraction
Odds ratios, risk ratios, hazard ratios, beta weights, and standard errors (depending on type of analysis) were extracted and entered into a Microsoft Excel spreadsheet. Individual datasets were compiled for each outcome measure including cognitive decline, cognitive impairment, MCI, AD, VaD, and any dementia. Additional information tabulated for each study included covariates adjusted in the final statistical models.
Definition of high serum cholesterol
Guidelines for defining high cholesterol differ between countries and health authorities. For example, in Australia, ≤5.5 mmol/L is regarded as ‘normal’ [10] whereas in the United Kingdom, 5.0 mmol/L or less is regarded as ‘healthy’ [11]. Articles also differed on their measure of high TC. Several articles compared quartiles, some used serum cholesterol as a continuous measure, while others used a pre-defined cut-off. To maximize the opportunity to obtain a pooled estimate, we pooled the most commonly used measure of exposure, which in most cases involved comparing the lowest and highest quartile reported in each publication. For the midlife studies, high TC was defined as >6.5 mmol/l [12] by authors.
Outcomes
Cognitive decline was evaluated in studies including 2+ occasions of measurement of cognition. Cognitive impairment was defined psychometrically or clinically using standard criteria (e.g., for psychometrically defined MCI we use 1.5 SD decline or 3 points on the MMSE or other published criteria). For clinical diagnosis of MCI, we accepted Petersen [13], Winblad [14], or other widely accepted clinical research criteria. AD was diagnosed using research diagnostic criteria (e.g., DSM IV) or classification according to ICD codes. VaD was identified according to research diagnostic criteria (e.g., NINDS–AIREN criteria for the diagnosis of vascular dementia [15]). Any dementia is an outcome used in many epidemiological studies to capture any participant with dementia due to any cause. This group is primarily comprised of AD as that is most prevalent, followed by VaD, but may also include Lewy body dementia, frontotemporal dementia, etc. Some studies only use the outcome of ‘Dementia’ and do not specify dementia subtype.
Data synthesis and analysis
Data were summarized according to study outcome (AD, any dementia, VaD, MCI, cognitive decline or impairment). Meta-analyses were conducted using Comprehensive Meta-analysis software Version 3.0. Analyses were conducted separately for middle-age exposure (40 to <60 years) and late-life exposure (60+ years) to high TC, low HDL-C, or high triglycerides. Results adjusted for the most covariates within a publication were included. Narrative review of relevant issues for which data were insufficient to pool, was conducted. Publication bias was evaluated using Funnel plot asymmetry.
The data points for the meta-analysis of binary outcomes were the logarithms of the relative risks or odds ratios, and their standard errors (i.e., two data points per included study). Heterogeneity among studies was examined using standard I2 which estimates the proportion of variance due to heterogeneity [16]. Fixed effects analysis is recommended for small numbers of studies where it is difficult to estimate variance [17]. Hence in the present study fixed effects meta-analysis was used for analyses with two or three studies. If there was evidence of heterogeneity and four or more studies were available, random effects meta-analysis was used [18, 19].
RESULTS
Thirty-four articles meeting inclusion criteria were identified, of which 17 articles included sufficient data for meta-analysis and their data were reported in such a way that they could be pooled with other studies in sub-analyses of specific outcomes [2, 12, 20–34]. Two articles were drawn from the same cohort as another article [20, 24, 28, 29] so taking the largest sample from these articles, the total number of participants included in the quantitative part of the review was 23,338. Figure 1 shows the stages in identifying studies for inclusion in the review. Studies were drawn from the USA, Sweden, France, Japan, the Netherlands, Australia, Finland, and Italy. Characteristics of the studies from the 17 articles included in meta-analyses are shown in Table 1. One study included only female participants [27] and one study included only males [2].
Quality ratings for all studies were high, in part due to the rigorous inclusion criteria which covered several items that are included in quality rating scales [9]. However, studies publishing on midlife lacked clear information on the age range of the sample at baseline and the distribution of the sample within midlife and late-life [12, 21]. Characteristics of studies meeting criteria but not included in meta-analyses are reported in Supplementary Table 1.
Total serum cholesterol measured in late-life as risk factors
The individual study and pooled relative risks for exposures in late-life are shown in Table 2. Four studies reported compatible data on TC in late-life and risk of AD in late-life including 7,308 participants [22, 24, 25, 33]. The pooled result showed no effect on AD. Two studies [26, 28] including 3,817 participants reported compatible data on TC in late-life and risk of MCI in late-life. Their pooled result showed no association. Three studies [22, 23, 26] with 5,467 participants reported compatible data on TC in late-life and any dementia. Their pooled result showed no association. Two studies [24, 33] with 4,066 participants reported data on TC in late-life and risk of VaD and also found no association. Two studies [30, 32] with 2,521 participants reported compatible data on TC in late-life and cognitive decline and found no association. A study that was incompatible for pooling but which reported analyses on cognitive decline found one significant effect [35]. An analysis that combined 11 studies [21–26, 29–34] reporting data on exposure to high TC in late-life with any cognitive or dementia outcome in late-life had non-significant results (RR = 1.02, CI = 0.88–1.87, p = 0.77) (Forest plot reported in Supplementary Figure 1).
Total serum cholesterol in midlife as a risk factor
Table 3 reports results for TC measured in midlife as a risk factor for late-life cognitive outcomes. Three studies including 3,335 participants [2, 12, 27] assessed serum cholesterol in midlife for later AD risk with one reporting 32 years of follow-up and the other ranged from an average of 18 to 30 years. High TC in midlife was associated with a relative risk of 2.14 (95% CI: 1.33–3.44), p < 0.01 compared with non-high TC in midlife.
Two studies reported compatible data on TC in midlife and late-life dementia [21, 27] including 3,392 participants but found no association. An analysis that combined the unique studies on midlife TC and AD and any dementia outcomes found that high TC in midlife increased the risk of late-life AD/dementia by 82%.
HDL-C and triglycerides in late-life
Studies reporting data compatible for pooling on HDL-C and triglycerides are shown in Tables 4 and 5. Two studies reported compatible data on HDL-C in late-life (n = 3,817) and incident MCI [26, 28] and found no association. Three studies [22, 24, 25] (n = 6,062) reported compatible data on HDL-C in late-life and AD and found no association. Two studies were pooled to examine whether HDL-C is associated with incident VaD [24, 29] (n = 10,558) and showed no association. Two studies reported compatible data on HDL-C and late-life any dementia (n = 5,075) and found no association. Two studies reported compatible data on HDL-C and triglycerides in late-life and risk of VaD [24, 29], including a total of 10,558 participants and when pooled, found no association.
Another three studies reported findings on HDL-C and cognitive function in late-life [36–38] but were not compatible for pooling, with varying methodologies. One study [36] found that an improvement in the profile of non-HDL-C in high functioning older adults (n = 1189) followed for 4.5 years was associated with reduced risk of cognitive decline. Another small study that followed 101 older women for 12 years found that risk of poor memory increased with a decrease in HDL-C [38]. An examination of the Health and Retirement Study data on a sample including both mid- and older-aged adults reported that HDL-C mediated the association between lifestyle variables and memory decline [37]. A final study found high LDL-C was associated with increased risk of dementia with stroke [39].
Studies meeting criteria that were notcompatible for pooling and inclusion in meta-analysis
Seventeen additional studies were identified for this review that could not be included in meta-analyses (Supplementary Table 1). Four studies did not report relevant individual effect sizes [40–43] and thirteen reported data that were incompatible with other studies for pooling, three of which reported on HDL-C and are described above. Four studies focused on late-life exposure to high TC. An early Australian study of late-life high TC as a predictor of dementia observed a small protective effect but did not include covariates [44]. A report from the Three Cities study in France found high TC in late-life was not associated with increased risk of MCI [45] and two more studies from the US found no association of late-life TC, triglycerides, or LDL and memory or cognitive decline [35, 46].
Two individual studies showed that high TC in midlife [49] or mid- to late-life was associated with an increased risk of cognitive decline [48] and another study reported an association of high midlife TC and risk of MCI in late-life [49].
One study reported on the association of HDL-C and cognitive decline and found no association [50] and two reported data with long-term follow-ups and are described below [51, 53].
Studies reporting results for models incorporating multiple measures of cholesterol over long follow-up periods
Four studies using different methodologies have characterized TC over multiple occasions of measurement with long follow-up periods [2, 21, 51, 52]. In general these show that declining TC from in late-life increase the risk of AD, but that the average TC over time did not. An early Finnish study of men that linked midlife serum cholesterol to late-life AD also estimated the trajectory of decline in TC [2] and found this was steeper in those ultimately diagnosed with AD than those without dementia. A report examining average TC over time from mid- to late-life as a predictor of late-life AD in the Framingham study found no association of TC with AD but this study did not model trajectories [52]. Stewart and colleagues [51] modeled change over time in TC and found a non-linear association with incident AD, VaD, and any dementia. This association remained for any dementia after adjusting for multiple covariates and the authors conclude that declining TC may be predictive of incident any dementia. This result was replicated by Beydoun and colleagues for males but not females [21]. Another study by Toro adds to the view that declining TC may be predictive of AD [31]. In a cohort that was aged approximately 60–63 at baseline, they observed highest quartile TC predicted incident AD over 14 years of follow-up. In the same study, analysis of trajectories by diagnostic group at follow-up revealed the AD and MCI groups had declining TC.
Covariates
Twelve of the studies included in meta-analyses reported adjusting for APOE genotype, 14 studies adjusted for education. Few studies examined the impact of statin use. One [21] examined statin use longitudinally and reported a reduced risk of dementia for participants taking them while other studies found no effect [24, 28]. Sex differences were rarely reported and there were insufficient data for males or females for pooling. One study found opposite effects of low triglycerides, with increased risk for males and reduced risk for females [20].
Reduction in cholesterol levels in samples over time
To explore the hypothesis that effects in midlife may have been due to the historically high levels of cholesterol in at the time these studies were conducted, we examined the pattern of average baseline cholesterol over time. Data are reported in Supplementary Table 2. Nine European and US studies had compatible data and from that we estimated the correlation between year of observation and sample average TC which was –0.66, p = 0.05 and review of the data suggests a decline in baseline cholesterol levels over time.
DISCUSSION
Our meta-analysis synthesized all available, high quality, compatible data from prospective studies reporting on the association of serum lipids with cognitive outcomes. The results reported here update our previous review by covering an additional 8 years or publications and inclusion of 8 new articles allowing for more meta-analyses. The review consolidates several lines of evidence to develop a more coherent view of cognitive risk associated with unfavorable lipid profiles in mid- to late-adulthood. Although no new studies could be added to the meta-analysis on midlife exposure to high TC and late-life cognitive outcomes, a number of individual studies that were not compatible for meta-analysis reported results that supported the pooled results. Our review also clarifies research gaps, and highlights the need for continuation of cohorts studied from midlife. Datasets that provide information on midlife risk factors for dementia and cognitive decline are critical for increasing the knowledge base in this field.
Available evidence does not show that midlife TC predicts types of dementia other than AD but there is insufficient evidence for this to be conclusive. The quantity of data available on which to base conclusions is still small and there are few recent studies. Results for any dementia overlap with results for AD in most meta-analyses due to the high prevalence of AD in the any dementia group. Declining TC is observed retrospectively in patients who eventually develop AD in cohort studies [31], implicating high TC as a risk factor or possible biomarker of emerging AD, very early in the disease process. There are insufficient data on statins to determine whether reduction of cholesterol with statins confers a reduction in risk of AD [53].
In late-life, TC was not associated with cognitive or dementia outcomes in any analyses or in any of the large individual studies that were not compatible for pooling. We are hesitant to conclude that there is no biological association between late-life lipids and brain health. Some isolated studies found better HDL-C profiles associated with reduced dementia risk. Nearly all the late-life studies were commenced at a time when many in the cohorts could have accumulated significant AD pathology. Without knowing the trajectory of TC over time for an individual it is not possible to know whether an isolated reading is an indicator of decline. It is also possible that participants with high LDL-C/non-HDL-C were lost from cohorts due to mortality or other co-morbidities associated with cardiovascular events. Disentangling the effect of lipids on late-life brain health will require very long-term follow-ups of cohorts that include AD biomarkers and the field currently lacks these data. In addition, early life social-disadvantage may impact on midlife risk factors and confound associations observed between risk factors and late-life cognitive outcomes [54].
Findings from key studies that have modeled TC trajectories in clinical subgroups demonstrate the need for a life course perspective for interpreting the overall findings in this field. It is possible that high TC in midlife may facilitate the commencement of accumulation of AD pathology. Animal studies have shown that intervention with a high cholesterol diet leads to memory deficits, increases oxidative stress and doubles the concentration of amyloid-β in the hippocampus [55]. Given the long term accumulation of AD neuropathology, and the need to identify targets for prevention, the association between AD and TC in midlife may signify a window period for risk reduction that has not yet been fully evaluated. However, it also presents a challenge because any intervention would need to be followed for decades and this may present ethical concerns for the control group. As long-term data become available on the use of statins, epidemiological data may shed light on whether reducing TC in midlife with statins is associated with reduced risk of AD two to three decades later.
Strengths of our meta-analysis are the inclusion of high quality studies, the large sample size, long follow-up for the midlife studies, and consideration of multiple outcomes and lipid measures. Limitations include the small numbers of studies available for some comparisons, lack of information on statin use and the small amount of data available on VaD. The inclusion of publications where serum cholesterol was not the main variable of interest may have counteracted publication bias to some extent. Examination of effect modifiers in epidemiological studies is often hindered by small cell sizes and this also limits the scope for systematic reviews such as the present one in examining gene-risk factor interactions.
Gaps in the literature and commentary
The findings on high TC in midlife being associated with increased risk of late-life AD are still limited to the few studies that report relevant data from Scandinavia and the United States. The wider literature shows that level of TC in populations varies according to diet, urbanization, ethnicity, and income [56, 57]. What is not known is whether the association between TC and AD differs by these other factors that affect TC. This information will be critical for the development of appropriate clinical practice guidelines. In the literature reviewed, there was a notable lack of cohort data from Asian, South American, African, and Middle Eastern countries and hence we do not know if TC is a risk factor for AD in these regions. The studies were limited by the lack of information on age of exposure and the length of exposure. Also, individuals with hereditary hypercholesterolemia may have contributed to these findings and represent a special group who also have different genetic risk factors for cardiovascular disease that may increase risk of AD, and studies did not report screening for such individuals.
The most recent Cochrane review [58] of statins for the prevention of dementia showed no benefit. This is not surprising. First our results suggest that risk of high TC may be limited to AD. Second, the studies that evaluated statins as a method of reducing dementia incidence were conducted on cohorts aged 70 and older. TC has not been shown to increase risk of AD or dementia in this age-group and statin use for dementia risk reduction is therefore not indicated.
Observational studies and meta-analyses do not identify causal mechanisms but can confirm reliable associations. The effect of TC on AD risk may be via the impact of TC on arteriosclerosis or cerebrovascular disease, in addition to directly impacting on the accumulation of AD pathology. The development of an evidence-base in dementia risk reduction is essential, yet review of the rate of publication of articles on this topic demonstrates the incremental nature of knowledge accumulation. Collaborative pooling of individual datasets may allow researchers to address some of these limitations.
We conclude that high TC in midlife (>6.5 mmol/l) may increase the risk of AD but urge cohort studies to publish their data on this topic to increase the knowledge base. Maintenance of cholesterol in the normal range among middle-aged adults should be a priority. This provides further reason to promote lifestyle changes associated with improvements in body composition [59] and exercise [60].
ACKNOWLEDGMENTS
We thank the authors who kindly provided data for meta-analyses. This work was supported by NHMRC Research Fellowship #1002560 for KJA, and NIHR fellowship PDF-2012-05-197 for RP.
Authors’ disclosures available online (http://j-alz.com/manuscript-disclosures/16-0826r1).
Appendices
The supplementary material is available in the electronic version of this article: http://dx.doi.org/10.3233/JAD-160826.
REFERENCES
[1] | Grimm MO , Zimmer VC , Lehmann J , Grimm HS , Hartmann T ((2013) ) The impact of cholesterol, DHA, and sphingolipids on Alzheimer’s disease. Biomed Res Int 2013: , 814390. |
[2] | Notkola IL , Sulkava R , Pekkanen J , Erkinjuntti T , Ehnholm C , Kivinen P , Tuomilehto J , Nissinen A ((1998) ) Serum total cholesterol, apolipoprotein E epsilon 4 allele, and Alzheimer’s disease. Neuroepidemiology 17: , 14–20. |
[3] | Reitz C , Tang MX , Schupf N , Manly JJ , Mayeux R , Luchsinger JA ((2010) ) A summary risk score for the prediction of Alzheimer disease in elderly persons. Arch Neurol 67: , 835–841. |
[4] | Kivipelto M , Ngandu T , Laatikainen T , Winblad B , Soininen H , Tuomilehto J ((2006) ) Risk score for the prediction of dementia risk in 20 years among middle aged people: A longitudinal, population-based study. Lancet Neurol 5: , 735–741. |
[5] | Anstey KJ , Lipnicki DM , Low LF ((2008) ) Cholesterol as a risk factor for dementia and cognitive decline: A systematic review of prospective studies with meta-analysis. Am J Geriatr Psychiatry 16: , 343–354. |
[6] | Booth A , Clarke M , Dooley G , Ghersi D , Moher D , Petticrew M , Stewart L ((2012) ) The nuts and bolts of PROSPERO: An international prospective register of systematic reviews. Syst Rev 1: , 2. |
[7] | Moher D , Shamseer L , Clarke M , Ghersi D , Liberati A , Petticrew M , Shekelle P , Stewart LA , Group P-P ((2015) ) Preferred reporting items for systematic review and meta-analysis protocols (PRISMA-P) 2015 statement. Syst Rev 4: , 1. |
[8] | Pedditizi E , Peters R , Beckett N ((2016) ) The risk of overweight/obesity in mid-life and late life for the development of dementia: A systematic review and meta-analysis of longitudinal studies. Age Ageing 45: , 14–21. |
[9] | Stang A ((2010) ) Critical evaluation of the Newcastle-Ottawa scale for the assessment of the quality of nonrandomized studies in meta-analyses. Eur J Epidemiol 25: , 603–605. |
[10] | Australian Institute of Health and Welfare, Abnormal blood lipids (dyslipidaemia), http://www.aihw.gov.au/risk-factors/abnormal-blood-lipids/, Accessed 11/04/2016. |
[11] | National Health Service, High Cholesterol, http://www.nhs.uk/conditions/cholesterol/Pages/Introduction.aspx, Accessed 11/04-2016. |
[12] | Kivipelto M , Helkala EL , Laakso MP , Hanninen T , Hallikainen M , Alhainen K , Soininen H , Tuomilehto J , Nissinen A ((2001) ) Midlife vascular risk factors and Alzheimer’s disease in later life: Longitudinal, population based study. BMJ 322: , 1447–1451. |
[13] | Petersen RC , Doody R , Kurz A , Mohs RC , Morris JC , Rabins PV , Ritchie K , Rossor M , Thal L , Winblad B ((2001) ) Current concepts in mild cognitive impairment. Arch Neurol 58: , 1985–1992. |
[14] | Winblad B , Palmer K , Kivipelto M , Jelic V , Fratiglioni L , Wahlund LO , Nordberg A , Backman L , Albert M , Almkvist O , Arai H , Basun H , Blennow K , de Leon M , DeCarli C , Erkinjuntti T , Giacobini E , Graff C , Hardy J , Jack C , Jorm A , Ritchie K , van Duijn C , Visser P , Petersen RC ((2004) ) Mild cognitive impairment–beyond controversies, towards a consensus: Report of the International Working Group on Mild Cognitive Impairment. J Intern Med 256: , 240–246. |
[15] | Roman GC ((2002) ) Defining dementia: Clinical criteria for the diagnosis of vascular dementia. Acta Neurol Scand Suppl 178: , 6–9. |
[16] | Higgins JP , Thompson SG ((2002) ) Quantifying heterogeneity in a meta-analysis. Stat Med 21: , 1539–1558. |
[17] | Borenstein M , Hedges LV , Higgins JPT , Rothstein HR ((2009) ) Introduction to Meta-analysis, John Wiley & Sons, Chichester. |
[18] | DerSimonian R , Laird N ((1986) ) Meta-analysis in clinical trials. Control Clin Trials 7: , 177–188. |
[19] | ((2005) ) Cochrane Handbook for Systematic Reviews of Interventions 4.2.5 [updated May 2005], John Wiley & Sons, Chichester, UK. |
[20] | Ancelin ML , Ripoche E , Dupuy AM , Barberger-Gateau P , Auriacombe S , Rouaud O , Berr C , Carriere I , Ritchie K ((2013) ) Sex differences in the associations between lipid levels and incident dementia. J Alzheimers Dis 34: , 519–528. |
[21] | Beydoun MA , Beason-Held LL , Kitner-Triolo MH , Beydoun HA , Ferrucci L , Resnick SM , Zonderman AB ((2011) ) Statins and serum cholesterol’s associations with incident dementia and mild cognitive impairment. J Epidemiol Community Health 65: , 949–957. |
[22] | Li G , Shofer JB , Kukull WA , Peskind ER , Tsuang DW , Breitner JC , McCormick W , Bowen JD , Teri L , Schellenberg GD , Larson EB ((2005) ) Serum cholesterol and risk of Alzheimer disease: A community-based cohort study. Neurology 65: , 1045–1050. |
[23] | Mielke MM , Zandi PP , Sjogren M , Gustafson D , Ostling S , Steen B , Skoog I ((2005) ) High total cholesterol levels in late life associated with a reduced risk of dementia. Neurology 64: , 1689–1695. |
[24] | Reitz C , Tang MX , Luchsinger J , Mayeux R ((2004) ) Relation of plasma lipids to Alzheimer disease and vascular dementia. Arch Neurol 61: , 705–714. |
[25] | Reitz C , Tang MX , Schupf N , Manly JJ , Mayeux R , Luchsinger JA ((2010) ) Association of higher levels of high-density lipoprotein cholesterol in elderly individuals and lower risk of late-onset Alzheimer disease. Arch Neurol 67: , 1491–1497. |
[26] | Solfrizzi V , Panza F , Colacicco AM , D’Introno A , Capurso C , Torres F , Grigoletto F , Maggi S , Del Parigi A , Reiman EM , Caselli RJ , Scafato E , Farchi G , Capurso A ((2004) ) Vascular risk factors, incidence of MCI, and rates of progression to dementia. Neurology 63: , 1882–1891. |
[27] | Mielke M , Zandi P , Shao H , Waern M , Ostling S , Guo X , Bjorkelund C , Lissner L , Skoog I , Gustafson D ((2010) ) The 32-year relationship between cholesterol and dementia from midlife to late life (e-Pub ahead of print). Neurology 75: , 1888–1895. |
[28] | Reitz C , Tang MX , Manly J , Schupf N , Mayeux R , Luchsinger JA ((2008) ) Plasma lipid levels in the elderly are not associated with the risk of mild cognitive impairment. Dement Geriatr Cogn Disord 25: , 232–237. |
[29] | Raffaitin C , Gin H , Empana JP , Helmer C , Berr C , Tzourio C , Portet F , Dartigues JF , Alperovitch A , Barberger-Gateau P ((2009) ) Metabolic syndrome and risk for incident Alzheimer’s disease or vascular dementia: The Three-City Study. Diabetes Care 32: , 169–174. |
[30] | Taniguchi Y , Shinkai S , Nishi M , Murayama H , Nofuji Y , Yoshida H , Fujiwara Y ((2014) ) Nutritional biomarkers and subsequent cognitive decline among community-dwelling older Japanese: A prospective study. J Gerontol A Biol Sci Med Sci 69: , 1276–1283. |
[31] | Toro P , Degen C , Pierer M , Gustafson D , Schroder J , Schonknecht P ((2014) ) Cholesterol in mild cognitive impairment and Alzheimer’s disease in a birth cohort over 14 years. Eur Arch Psychiatry Clin Neurosci 264: , 485–492. |
[32] | Hyman BT , Gomez-Isla T , Briggs M , Chung H , Nichols S , Kohout F , Wallace R ((1996) ) Apolipoprotein E and cognitive change in an elderly population. Ann Neurol 40: , 55–66. |
[33] | Slooter AJC, Ruitenberg A, van Duijn CM, Breteler MMB ((2000) ) The effect of APOE on dementia is not through atherosclerosis: The Rotterdam Study: Reply. Neurology 54: , 2357–2358. |
[34] | Yoshitake T , Kiyohara Y , Kato I , Ohmura T , Iwamoto H , Nakayama K , Ohmori S , Nomiyama K , Kawano H , Ueda K , et al. ((1995) ) Incidence and risk factors of vascular dementia and Alzheimer’s disease in a defined elderly Japanese population: The Hisayama Study. Neurology 45: , 1161–1168. |
[35] | Mielke MM , Xue QL , Zhou J , Chaves PH , Fried LP , Carlson MC ((2008) ) Baseline serum cholesterol is selectively associated with motor speed and not rates of cognitive decline: The Women’s Health and Aging Study II. J Gerontol A Biol Sci Med Sci 63: , 619–624. |
[36] | Karlamangla AS , Singer BH , Reuben DB , Seeman TE ((2004) ) Increases in serum non-high-density lipoprotein cholesterol may be beneficial in some high-functioning older adults: MacArthur studies of successful aging. J Am Geriatr Soc 52: , 487–494. |
[37] | Infurna FJ , Gerstorf D ((2013) ) Linking perceived control, physical activity, and biological health to memory change. Psychol Aging 28: , 1147–1163. |
[38] | Komulainen P , Lakka TA , Kivipelto M , Hassinen M , Helkala EL , Haapala I , Nissinen A , Rauramaa R ((2007) ) Metabolic syndrome and cognitive function: A population-based follow-up study in elderly women. Dement Geriatr Cogn Disord 23: , 29–34. |
[39] | Moroney JT , Tang MX , Berglund L , Small S , Merchant C , Bell K , Stern Y , Mayeux R ((1999) ) Low-density lipoprotein cholesterol and the risk of dementia with stroke. JAMA 282: , 254–260. |
[40] | de Bruijn RF , Janssen JA , Brugts MP , van Duijn CM , Hofman A , Koudstaal PJ , Ikram MA ((2014) ) Insulin-like growth factor-I receptor stimulating activity is associated with dementia. J Alzheimers Dis 42: , 137–142. |
[41] | van Vliet P , Westendorp RG , van Heemst D , de Craen AJ , Oleksik AM ((2010) ) Cognitive decline precedes late-life longitudinal changes in vascular risk factors. J Neurol Neurosurg Psychiatry 81: , 1028–1032. |
[42] | Yaffe K , Vittinghoff E , Pletcher MJ , Hoang TD , Launer LJ , Whitmer R , Coker LH , Sidney S ((2014) ) Early adult to midlife cardiovascular risk factors and cognitive function. Circulation 129: , 1560–1567. |
[43] | Hogenkamp PS , Benedict C , Sjogren P , Kilander L , Lind L , Schioth HB ((2014) ) Late-life alcohol consumption and cognitive function in elderly men. Age (Dordr) 36: , 243–249. |
[44] | Piguet O , Grayson DA , Creasey H , Bennett HP , Brooks WS , Waite LM , Broe GA ((2003) ) Vascular risk factors, cognition and dementia incidence over 6 years in the Sydney Older Persons Study. Neuroepidemiology 22: , 165–171. |
[45] | Artero S , Ancelin ML , Portet F , Dupuy A , Berr C , Dartigues JF , Tzourio C , Rouaud O , Poncet M , Pasquier F , Auriacombe S , Touchon J , Ritchie K ((2008) ) Risk profiles for mild cognitive impairment and progression to dementia are gender specific. J Neurol Neurosurg Psychiatry 79: , 979–984. |
[46] | Reitz C , Luchsinger J , Tang MX , Manly J , Mayeux R ((2005) ) Impact of plasma lipids and time on memory performance in healthy elderly without dementia. Neurology 64: , 1378–1383. |
[47] | Wendell CR , Waldstein SR , Zonderman AB ((2014) ) Nonlinear longitudinal trajectories of cholesterol and neuropsychological function. Neuropsychology 28: , 106–112. |
[48] | Thacker EL , Gillett SR , Wadley VG , Unverzagt FW , Judd SE , McClure LA , Howard VJ , Cushman M ((2014) ) The American Heart Association Life’s Simple 7 and incident cognitive impairment: The REasons for Geographic And Racial Differences in Stroke (REGARDS) study. J Am Heart Assoc 3: , e000635. |
[49] | Kivipelto M , Helkala EL , Hanninen T , Laakso MP , Hallikainen M , Alhainen K , Soininen H , Tuomilehto J , Nissinen A ((2001) ) Midlife vascular risk factors and late-life mild cognitive impairment: A population-based study. Neurology 56: , 1683–1689. |
[50] | Kalmijn S , Feskens EJ , Launer LJ , Kromhout D ((1996) ) Cerebrovascular disease, the apolipoprotein e4 allele, and cognitive decline in a community-based study of elderly men. Stroke 27: , 2230–2235. |
[51] | Stewart R , White LR , Xue QL , Launer LJ ((2007) ) Twenty-six-year change in total cholesterol levels and incident dementia: The Honolulu-Asia Aging Study. Arch Neurol 64: , 103–107. |
[52] | Tan ZS , Seshadri S , Beiser A , Wilson PW , Kiel DP , Tocco M , D’Agostino RB , Wolf PA ((2003) ) Plasma total cholesterol level as a risk factor for Alzheimer disease: The Framingham Study. Arch Intern Med 163: , 1053–1057. |
[53] | Power MC , Weuve J , Sharrett AR , Blacker D , Gottesman RF ((2015) ) Statins, cognition, and dementia-systematic review and methodological commentary. Nat Rev Neurol 11: , 220–229. |
[54] | Power C , Jefferis BJ , Manor O ((2010) ) Childhood cognition and risk factors for cardiovascular disease in midadulthood: The 1958 British Birth Cohort Study. Am J Public Health 100: , 129–136. |
[55] | Gamba P , Testa G , Gargiulo S , Staurenghi E , Poli G , Leonarduzzi G ((2015) ) Oxidized cholesterol as the driving force behind the development of Alzheimer’s disease. Front Aging Neurosci 7: , 119. |
[56] | Danaei G , Singh GM , Paciorek CJ , Lin JK , Cowan MJ , Finucane MM , Farzadfar F , Stevens GA , Riley LM , Lu Y , Rao M , Ezzati M , Global Burden of Metabolic Risk Factors of Chronic Diseases Collaborating Group ((2013) ) The global cardiovascular risk transition: Associations of four metabolic risk factors with national income, urbanization, and Western diet in 1980 and 2008. Circulation 127: , 1493–1502, 1502e1491-1498. |
[57] | Liao PJ , Xie RB , Yin RX , Wei DX , Huang J , Huang F , Li H , Lin WX , Wu JZ , Pan SL ((2015) ) Serum lipid profiles, the prevalence of dyslipidemia and the risk factors in two isolated Chinese minorities. Int J Clin Exp Med 8: , 19200–19211. |
[58] | McGuinness B , Craig D , Bullock R , Passmore P ((2016) ) Statins for the prevention of dementia. Cochrane Database Syst Rev 1: , CD003160. |
[59] | Mertens E , Clarys P , Lefevre J , Charlier R , Knaeps S , Deforche B ((2015) ) Longitudinal study on the association between cardiorespiratory fitness, anthropometric parameters and blood lipids. J Phys Act Health 13: , 467–473. |
[60] | Park YM , Sui X , Liu J , Zhou H , Kokkinos PF , Lavie CJ , Hardin JW , Blair SN ((2015) ) The effect of cardiorespiratory fitness on age-related lipids and lipoproteins. J Am Coll Cardiol 65: , 2091–2100. |
Figures and Tables
Fig.1
Study selection process.
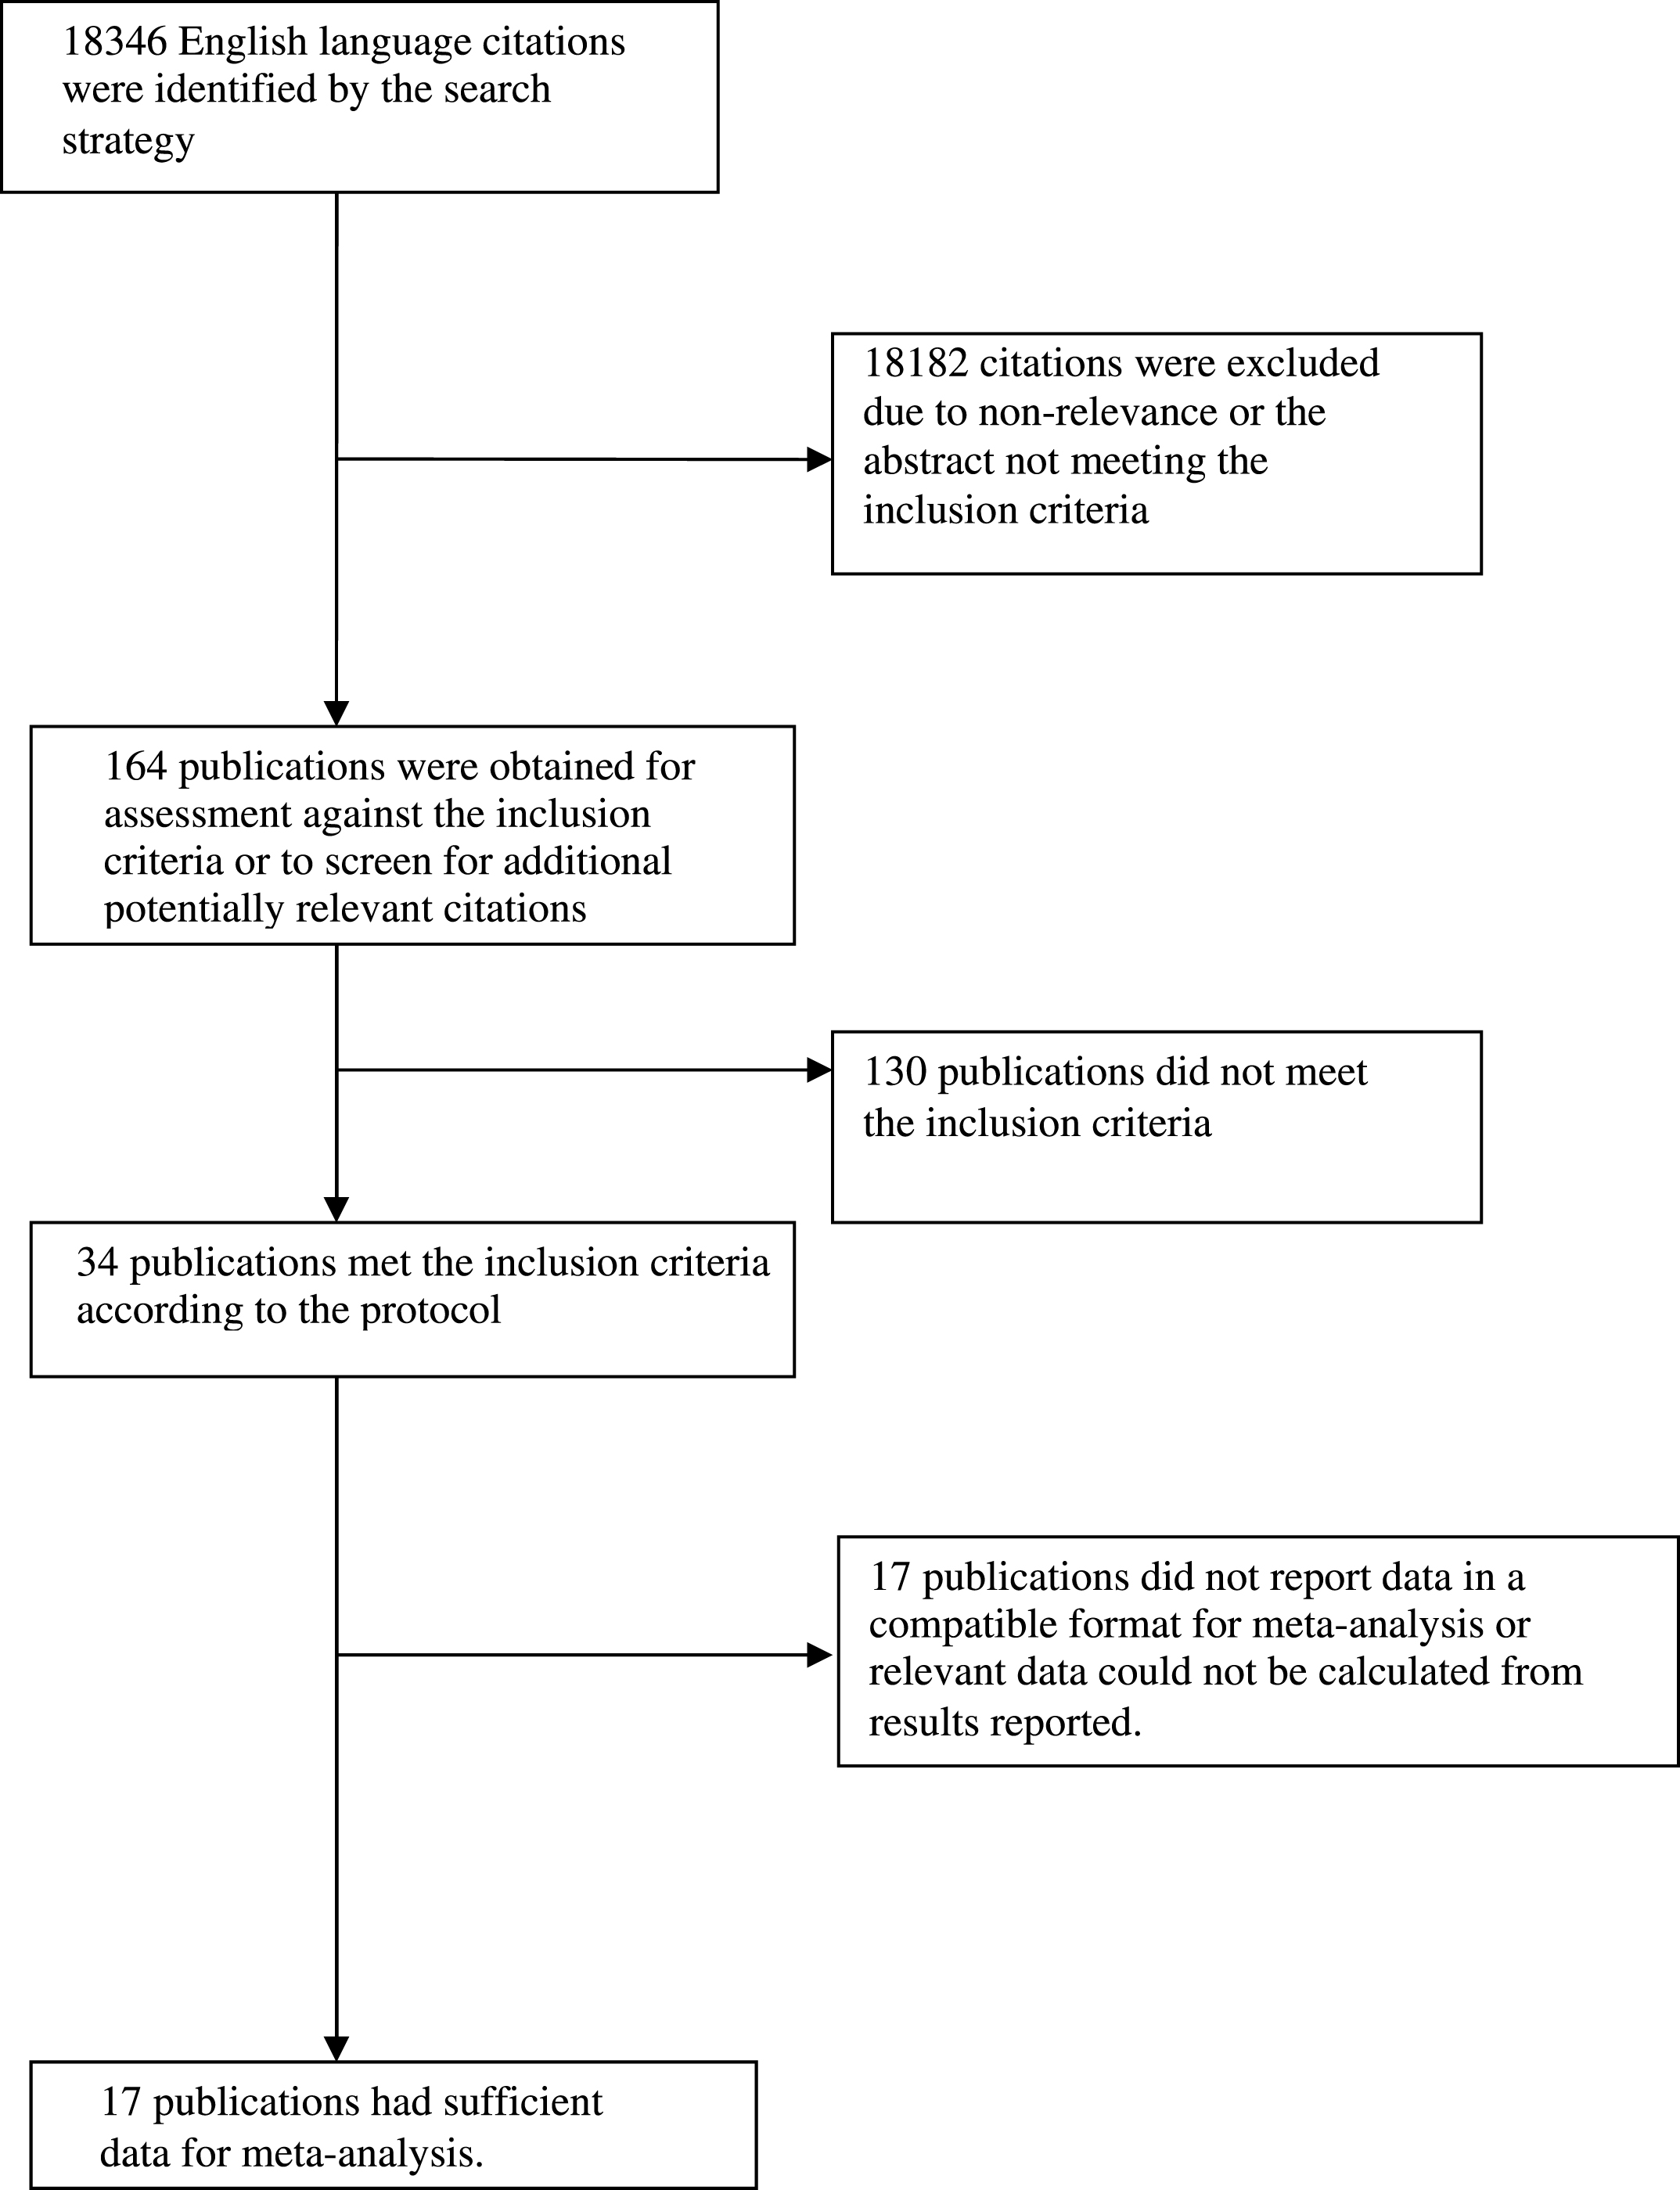
Table 1
Articles included in meta-analyses
| Study (no. of subjects) | Study name (source) | Observation period, years (SD) | Cholesterol measures | Outcome | Outcome Measure(s) | Mean age, years (SD) | Female (%) | Education | |
| 1 | Yoshitake et al., 1995* [34] (n = 828) | N/A (non- demented residents of Hisayama Town, Kyushu, Japan) | 7 | TC, TG, HDL-C, LDL-C, Very LDL-C | VaD, AD | Hasegawa’s dementia scale | Men = 73 (5.6)Women = 74 (6.1) | 59.5 | Men (low education status) = 13.5% Women (low education status) = 34.4% |
| 2 | Hyman et al., 1996** [32] (n = 1,899) | Iowa 65+ Rural Health Study (Iowa, USA) | 10 maximum | TC | Cognitive change | Free recall task, SPMSQ | 79.08 (SE 0.13) | 64.8 | 10.77 (SE 0.1) |
| 3 | Notkola et al., 1998§ [2] (n = 444) | Seven Countries Study (444 men in the Finnish Cohorts) | 30 maximum | TC | AD | MMSE, CDR Scale, SPMSQ, DSM-III | Data not available | 0 | Data not available |
| 4 | Slooter et al., 1999# [33] (n = 244 dementia cases, 1,002 controls) | Rotterdam Study (Rotterdam, the Netherlands) | 2.1 (0.9) | TC, HDL-C | Dementia | DSM-III, NINCDS-ADRDA, NINDS-AIREN | All dementia = 82.4 (7.5)Controls = 68.7 (7.9) | All dementia = 67.0 Controls = 60.0 | All dementia (Primary only) = 53.0% Controls (Primary only) = 23.0% |
| 5 | Kivipelto et al., 2001 [12] (n = 1,449) | N/A (participants derived from random population-based samples in Kuopio and Joensuu, Eastern Finland) | 21 | TC | AD | MMSE, DSM- IV, NINCDS-ADRDA | Overall = 71.3 (4.0) Midlife AD = 74.7 (3.8) No dementia midlife = 71.1 (4.0) | 60 | AD = 6.7 (2.7) No dementia = 8.5 (3.5) |
| 6 | Reitz et al., 2004∧ [24] (n = 1,168) | N/A (Random sample of Medicare recipients aged 65+ years, residing in Manhattan, USA) | 4.82 (2.9) | Fasting TC and TG levels, HDL-C and LDL-C | AD and VaD | NINCDS-ADRDA, VaD required clinical evidence of stroke | Overall = 78.4 (6.2) VaD = 81.6 AD = 82.6 | 68.3 | 8 median |
| 7 | Solfrizzi et al., 2004¤ [26] (n = 2,963; n = 1,555 without impairment and n = 121 with MCI) | Italian Longitudinal Study on Aging (Eight municipalities in Italy) | 3.5 | Total cholesterol, HDL-C | Incident MCI and dementia, AD and VaD | MMSE, DSM-III, CAMDEX, NINCDS-ADRDA, ICD10, Petersen criteria for MCI | Normal subjects = 71.8 (5.0) MCI = 80.7 (2.5) | Normal subjects = 56.4 MCI = 50.4 | Normal subjects = 7.1 (4.7) MCI = 2.2 (1.3) |
| 8 | Li et al., 2005¤¤ [22] (n = 2,112) | The Adult Changes in Thought Study (Seattle, USA) | 5.6 (1.8) | TC and HDL | All-cause dementia and probable AD | CASI, DSM-IV, NINCDS-ADRDA | Dementia = 82.2 (6.1)AD = 82.4 (5.3) Overall 74.9(5.9) | 59.5 | 13.7 (3.0) |
| 9 | Mielke et al., 2005† [23] (n = 382) | N/A (Sample of 70-year old residents of Gothenburg, Sweden) | 18 | TC, TG | Dementia | DSM-III | 70 | 59.2 | Data not available |
| 10 | Reitz et al., 2008†† [28] (n = 854) | N/A (Random sample of Medicare recipients aged 65+ years, residing in Manhattan, USA) | TC, HDL-C, TG, LDL-C | MCI | DSM-IV, letter fluency, category fluency and the WAIS-R Similarities subtest, Petersen Criteria for MCI | Overall = 75.8 (5.9)No MCI = 75.5 (6.0)Incident total MCI = 76.3 (5.7) | Overall = 68.7No MCI = 68.7Incident total MCI = 69.6 | Overall = 8.9 (4.5)No MCI = 9.1 (4.5)Incident total MCI = 8.6 (4.6) | |
| 11 | Raffaitan et al., 2009‡ [29] (n = 7,738) | French Three City Study (Bordeaux, Dijon and Montpellier, France) | 4 | HDL-C, TG | Incident AD and VaD | MMSE, Benton Visual Retention Test, Isaac’s Set Test, DSM-IV, NINCDS-ADRDA | 73.4 (4.9) | 61 | None or primary = 23.6% |
| 12 | Reitz et al., 2010‡‡ [25] (n = 1,130) | N/A (Random sample of Medicare recipients aged 65+ years, residing in Manhattan, USA) | 4.2(median) | Fasting TC and TG levels, HDL-C and LDL-C | Possible and probable AD | DSM-IV, NINCDS-ADRDA | Overall = 75.7 (6.3)Probable and possible AD = 82.9 (7.1) | 65.7 | 10.9 (4.7) |
| 13 | Mielke et al., 2010¶ [27] (n = 1,462) | The Prospective Population Study of Women (Gothenburg, Sweden) | 32 | TC | All-cause dementia | DSM-IIIR, NINCDS-ADRDA | Data not available | 100 | Of those who developed All-cause dementia 26.1% had (compulsory versus less) compared with 73.9% without |
| 14 | Beydoun et al., 2011¶¶ [21] (n = 1,604) | Baltimore Longitudinal Study of Aging (Baltimore, USA) | 24.9 | TC, HDL-C | Dementia and MCI | DSM-IIIR, NINCDS-ADRDA, Petersen criteria for MCI | No dementia or MCI = 51.5 (15.7)Incident dementia = 81.9 (7.7)Incident MCI = 65.7 (13.7) | No dementia or MCI = 39.6Incident dementia = 36.3Incident MCI = 33.3 | No dementia or MCI = 6.7 (2.7)Incident dementia = 16.7 (2.8)Incident MCI = 16.0 (3.3) |
| 15 | Ancelin et al., 2013¶¶¶ [20] (n = 7,053) | French Three-City Study (Bordeaux, Dijon and Montpellier, France) | 7 maximum | TC, TG, LDL-C, HDL-C | Dementia, AD, and VaD | DSM-IV, NINCDS-ADRDA, Hachinski Score | Women = 73.9 (5.3)Men = 73.7 (5.3) | 61.1 | Men (>12 years) = 28.3Women (>12 years) = 13.6 |
| 16 | Taniguchi et al., 2014∧∧ [30] (n = 682) | N/A (sample of participants aged 70+ years who lived in Kusatsu, Japan in 2002) | 4 maximum | TC, HDL-C, TG | Cognitive decline | MMSE | 75.5 (4.4) | 59.7 | 8.5 (2.2) |
| 17 | Toro et al., 2014∧∧∧ [31] (n = 381) | Interdisciplinary Longitudinal Study on Adults Development and Ageing (Germany) | 14 | TC | MCI, AD | AACD, NINCDS-ADRDA, NINDS-AIREN | AD = 74.8 (1.0)MCI = 74.3 (1.1)Cognitively healthy = 74.0 (1.0) | AD = 40.9MCI = 47.6Cognitively healthy = 47.5 | AD = 11.2 (1.8)MCI = 12.1 (2.2)Cognitively healthy = 13.7 (3.0) |
*Estimates were adjusted for age and gender. **Estimates were adjusted for age, sex, educational level, chronic disease history, and depression. §Estimates were adjusted for age and APOE ɛ4. #Estimates were adjusted for systolic blood pressure, diastolic blood pressure, BMI, TC, and HDL-C. # #Estimates were adjusted for age and BMI. ∧Estimates were adjusted for sex, age, education, ethnicity, BMI, APOE ɛ4, diabetes, heart disease, and hypertension. ¤Estimates were adjusted for age, sex, and educational level. ¤¤Estimates were adjusted for age at entry, sex, education, self-reported history of stroke or transient ischemic attack, history of coronary artery disease, history of hypertension, history of diabetes mellitus, CASI score, and BMI at enrolment. †Estimates were adjusted for diastolic blood pressure, BMI, sex, education, and smoking. ††Estimates were adjusted for sex, age, ethnicity, education, APOE ɛ4, diabetes, heart disease, stroke, and hypertension. ‡ Estimates were adjusted for age, sex, educational level, and APOE ɛ4. ‡‡ Estimates were adjusted for Age, sex, education, ethnic group, APOE ɛ4, diabetes mellitus, hypertension, heart disease, BMI, and lipid-lowering treatment. ¶Estimates were adjusted for education, diastolic blood pressure, BMI, age, and cigarette smoking. ¶¶Estimates were adjusted for age at first visit, sex, education (years of schooling), race and ethnicity, smoking status, type 2 diabetes, hypertension, cardiovascular disease or cerebrovascular disease (stroke, congestive heart failure, non-fatal myocardial infarction, or atrial fibrillation), dyslipidemia, BMI, and systolic blood pressure. ¶¶¶Estimates were adjusted for age, center, education level, mobility, hypertension, diabetes, depression, anticholinergic use, APOE ɛ4, APO5, CETP1, intima media thickness, and BMI. ∧∧Estimates were adjusted for sex, age, educational attainment, years of education, study area, living arrangement, frequency of going outdoors, alcohol drinking and smoking status, history of chronic diseases, body height and weight, BMI, resting blood pressure, grip strength usual gait speed, self-rated health, competence, and depression. ∧∧∧Estimates were adjusted for education, APOE ɛ4, socio-economic status, and gender. AACD, Age Associated Cognitive Decline Criteria of the International Psychogeriatric Association; AD, Alzheimer’s disease; APOE, apolipoprotein; BMI, body mass index; CAMDEX, Cambridge Mental Disorders of the Elderly Examination; CASI, Cognitive Abilities Screening Instrument; CDR, Clinical Dementia Rating; DSM, Diagnostic and Statistical Manual of Mental Disorders; HDL-C, high density lipoprotein; ICD10, 10th revision of the International Statistical Classification of Diseases and Related Health Problems; LDL-C, low density lipoprotein; MCI, mild cognitive impairment; MMSE, Mini-Mental State Examination; NINCDS-ADRDA, National Institute of Neurological and Communicative Disorders and Stroke and the Alzheimer’s Disease and Related Disorders Association; NINDS-AIREN, National Institute of Neurological Disorders and Stroke and the Association Internationale pour la Recherche et l’Enseignement en Neurosciences; SPMSQ, Short Portable Mental Status Questionnaire; TC, total cholesterol; TG, triglycerides; VaD, vascular dementia; WAIS-R, Wechsler Adult Intelligence Scale.
Table 2
Total cholesterol measured in late-life and cognitive outcomes in late-life
| Outcome | Study | Weight | RR | CI | p-value |
| AD | Slooter et al., 1999# [33] | 37.17 | 0.98 | 0.94, 1.02 | 0.38 |
| Reitz et al., 2004∧ [24] | 14.96 | 0.48 | 0.26, 0.87 | 0.02 | |
| Li et al., 2005¤¤ [22] | 18.72 | 1.00 | 0.61, 1.63 | 1.00 | |
| Reitz et al., 2010‡‡ [25] | 10.72 | 0.70 | 0.32, 1.51 | 0.36 | |
| Pooled | 0.93 | 0.69, 1.26 | 0.65 | ||
| VaD | Slooter et al., 1999# [33] | 88.99 | 0.95 | 0.69, 1.31 | 0.75 |
| Reitz et al., 2004 [24] | 11.01 | 1.05 | 0.42, 2.61 | 0.92 | |
| Pooled | 0.96 | 0.71, 1.30 | 0.79 | ||
| Any dementia | Solfrizzi et al., 2004¤ [26] | 3.25 | 0.75 | 0.12, 4.76 | 0.76 |
| Li et al., 2005 [22] | 85.40 | 1.16 | 0.81, 1.66 | 0.42 | |
| Mielke et al., 2005† [23] | 11.35 | 0.45 | 0.17, 1.21 | 0.11 | |
| 1.03 | 0.74, 1.43 | 0.88 | |||
| MCI | Solfrizzi et al., 2004 [26] | 20.43 | 0.50 | 0.28, 0.88 | 0.02 |
| Reitz et al., 2008†† [28] | 59.10 | 0.80 | 0.57, 1.12 | 0.19 | |
| Pooled | 0.71 | 0.53, 0.94 | 0.15 | ||
| Cognition | Hyman et al., 1996** [32] | 100.00 | 0.997 | 0.994, 1.00 | 0.05 |
| Taniguchi et al., 2014∧∧ [30] | 1.25 | 0.769, 2.03 | 0.37 | ||
| Pooled | 0.99 | 0.997, 1.00 | 0.05 |
Exposures were for lowest versus highest quartile for analyses except for the second set of results for AD which where the exposure was continuous TC. *Weights for fixed effects analysis. Weights differed for random effects analyses and were non-significant. #Estimates were adjusted for systolic blood pressure, diastolic blood pressure, BMI, TC, and HDL-C. ∧Estimates were adjusted for sex, age, education, race, BMI, APOE ɛ4, diabetes, heart disease, and hypertension. ¤¤Estimates were adjusted for age at entry, sex, education, self-reported history of stroke or transient ischemic attack, history of coronary artery disease, history of hypertension, history of diabetes mellitus, CASI score, and BMI at enrolment. ‡‡Estimates were adjusted for age, sex, education, ethnic group, APOE ɛ4, diabetes mellitus, hypertension, heart disease, BMI, and lipid-lowering treatment. ¤Estimates were adjusted for age, sex, and educational level. †Estimates were adjusted for diastolic blood pressure, BMI, sex, education, and smoking.††Estimates were adjusted for sex, age, ethnicity, education, APOE ɛ4, diabetes, heart disease, stroke, and hypertension. **Estimates were adjusted for age, sex, educational level, chronic disease history, and depression. ∧∧Estimates were adjusted for sex, age, educational attainment, years of education, study area, living arrangement, frequency of going outdoors, alcohol drinking and smoking status, history of chronic diseases, body height and weight, BMI, resting blood pressure, grip strength, usual gait speed, self-rated health, competence, and depression. AD, Alzheimer’s disease; APOE, apolipoprotein; BMI, body mass index; CASI, Cognitive Abilities Screening Instrument; CI, confidence interval; HDL-C, high density lipoprotein; MCI, mild cognitive impairment; RR, relative risk; TC, total cholesterol; VaD, vascular dementia.
Table 3
Total cholesterol measured in midlife and cognitive outcome in late-life
| Outcome | Study | Weight | RR | CI | p-value |
| AD | Notkola et al., 1998§ [2] | 23.52 | 3.10 | 1.16, 8.25 | 0.02 |
| Kivipelto et al., 2001# # [12] | 30.48 | 3.10 | 1.18, 6.62 | 0.02 | |
| Mielke et al., 2010¶ [27] | 46.00 | 1.48 | 0.73, 2.98 | 0.27 | |
| Pooled | 2.14 | 1.33, 3.44 | 0.00 | ||
| Dementia | Mielke et al., 2010 [27] | 84.61 | 2.82 | 0.94, 8.44 | 0.26 |
| Beydoun et al., 2011¶¶ [21] | 15.39 | 1.31 | 0.82, 2.09 | 0.06 | |
| Pooled | 1.47 | 0.96, 2.27 | 0.08 | ||
| AD/Dementia | Notkola et al., 1998 [2] | 13.39 | 3.10 | 1.16, 8.25 | 0.02 |
| Kivipelto et al., 2001 [12] | 10.66 | 3.10 | 1.18, 6.62 | 0.02 | |
| Mielke et al., 2010 [27] | 58.61 | 2.82 | 0.94, 8.44 | 0.26 | |
| Beydoun et al., 2011 [21] | 17.35 | 1.31 | 0.82, 2.09 | 0.06 | |
| Pooled | 1.82 | 1.27, 2.60 | <0.01 |
§Estimates were adjusted for age and APOE ɛ4. # #Estimates were adjusted for age and BMI. ¶Estimates were adjusted for education, diastolic blood pressure, BMI, age, and cigarette smoking. ¶¶Estimates were adjusted for age at first visit, sex, education (years of schooling), race and ethnicity, smoking status, type 2 diabetes, hypertension, cardiovascular disease or cerebrovascular disease (stroke, congestive heart failure, non-fatal myocardial infarction, or atrial fibrillation), dyslipidemia, BMI, and systolic blood pressure. AD, Alzheimer’s disease; APOE, apolipoprotein; BMI, body mass index; CI, confidence interval; RR, relative risk.
Table 4
HDL-C measured in late-life and cognitive outcome in late-life
| Outcome | Study | Weight | RR | CI | p-value |
| MCI | Solfrizzi et al., 2004 [26] | 20.59 | 1.26 | 0.73, 2.19 | 0.41 |
| Reitz et al., 2008 [28] | 66.65 | 0.90 | 0.66, 1.22 | 0.50 | |
| Pooled | 0.97 | 0.75, 1.27 | 0.85 | ||
| AD | Reitz et al., 2004 [24] | 32.97 | 0.70 | 0.37, 1.32 | 0.27 |
| Li et al., 2005 [22] | 43.45 | 1.23 | 0.71, 2.14 | 0.46 | |
| Reitz et al., 2010 [25] | 23.58 | 0.40 | 0.19, 0.85 | 0.02 | |
| Pooled | 0.78 | 0.54, 1.13 | 0.19 | ||
| VaD | Reitz et al., 2004¶ [24] | 46.54 | 0.81 | 0.32, 2.05 | 0.66 |
| Raffaitan et al., 2009† [29] | 53.46 | 1.52 | 0.64, 3.61 | 0.34 | |
| Pooled | 1.13 | 0.60, 2.14 | 0.70 | ||
| Any Dementia | Li et al., 2005 [22] | 94.89 | 1.04 | 0.69, 1.56 | 0.85 |
| Solfrizzi et al., 2004 [26] | 5.11 | 1.37 | 0.24, 7.84 | 0.72 | |
| Pooled | 1.06 | 0.71, 1.56 | 0.79 |
AD, Alzheimer’s disease; CI, confidence interval; HDL-C, high density lipoprotein; MCI, mild cognitive impairment; RR, relative risk; VaD, vascular dementia.

