


Abstract
Objectives. To investigate the treatment of knee pain in primary care and the factors associated with consulting general practitioners (GPs) and referrals to specialist services.
Methods. Individuals with knee pain were identified through postal questionnaires sent to patients aged 50 and over from two GP practices in southeast London. Patients with knee pain were then invited to the department, where demographic, clinical and service use data were collected. Participants also completed measures of pain, function, handicap and illness beliefs.
Results. From the 2940 questionnaires that were sent out, the response rate was 34%. Of these, 49% reported experiencing knee pain in the previous 12 months. Two hundred and thirty-one patients with knee pain attended the department. One hundred and thirty-four (58%) had seen their GP about their knee pain, with 50 (37%) referred on to specialist services. Compared with non-consulters, consulters had more severe disease and higher levels of disability and handicap, and believed the condition was more severe and had major consequences on their lives. Those referred to specialist care had higher levels of handicap and also believed the condition was more severe, with major consequences on their lives, than those not referred.
Conclusion. In this sample nearly half of those who reported knee pain had not seen their GP and were self-managing their condition. A mixture of physical, social and psychological factors predicted visits to GPs and rates of referral to secondary care. Patient perceptions about knee pain were important predictors of both consultations and referrals, highlighting the need to address both physical and psychosocial factors in relation to help-seeking.
Knee pain is a common musculoskeletal problem, especially in those aged 50 and over, and has been described as the new back pain because of its community importance [1] and limited evidence for long-term efficacy of treatment [2]. There is discordance between symptomatic knee pain and X-ray features of osteoarthritis (OA) [3]; consequently, primary care studies focus on symptomatic knee pain in the over-50s. In this group knee pain reliably indicates clinically relevant knee OA. A systematic review of knee pain in older adults reported that 25% of those aged over 55 yr experienced persistent knee pain each year [4] and a recent survey found knee pain in 47% of more than 8500 individuals over 50 yr [5]. However, on average, only one in six patients was found to have consulted their general practitioner (GP) about their knee pain over the course of a year [4].
A number of treatment strategies, both pharmaceutical and non-pharmaceutical, are available to GPs, including analgesics, physiotherapy and referral to specialist services such as rheumatology and orthopaedics [6, 7]. Use of these treatments may differ across GP practices and some treatments are more widely used than others. A survey of clinically diagnosed knee OA in two UK general practices reported that whilst physiotherapy was relatively under-utilized, many patients used NSAIDs [8]. Complementary medicines and therapies were also widely used, particularly by patients in higher social classes.
Despite the high prevalence of knee pain and its potential burden on health-care services, there has been little work on clinical, psychological and social factors associated with consulting for knee pain or referral to secondary care. The present study addressed the ways in which disability, severity of the condition and health beliefs relate to consultation rates and referral to specialist services.
Participants and methods
Sampling and recruitment
Two GP practices in southeast London participated in the study, conducted in 1998–99. Practice A was situated in a relatively wealthy London suburb in Dulwich (Carstairs score using small area statistics [9] from 1991 census, 0.37) whilst practice B was situated in an inner city environment in Peckham with relative deprivation (Carstairs score using small area statistics from 1991 census, 6.49). The median score for London in this census is 1.96 (range −4.56 to 24.7). Full ethical approval was obtained from the ethics committee of King's College Hospital and all patients studied gave informed consent.
To identify individuals with knee pain, a postal questionnaire, information sheet and prepaid envelope were sent to all patients aged 50 yr and over registered at the two practices. Prior to sending out questionnaires GPs were asked to identify patients who should not be contacted due to, for example, mental health problems or terminal illness. The questionnaire enquired about the presence of recent knee pain using the following question: ‘In the past 12 months, have you had pain in either or both of your knees during the day or during the night?’
This question was used to detect recent knee pain so as to facilitate recall of symptoms. In addition, respondents were asked about the onset of pain, when it occurred and activities that relieved or exacerbated the pain (e.g. climbing stairs, putting on socks). A maximum of two follow-up questionnaires were sent to non-responders at 4-week intervals.
Clinic assessment
Individuals who reported the presence of knee pain during the previous 12 months were invited to attend the rheumatology department for a detailed interview about their knee pain. Written informed consent was obtained and any questions concerning the study were answered. The interview, conducted by a trained research assistant (H.L.M.), consisted of collection of demographic data; information on service use, such as GP consultations for knee pain and referrals to specialists; a clinical examination of the knees for crepitus, swelling, bony enlargements and measurement of range of motion; and information on diagnosis of knee pain. The assessor was aware of which patients had seen their GP. In addition, participants were asked to complete four questionnaires: the Western Ontario and McMaster Universities osteoarthritis index (WOMAC) [10], an OA-specific measure that looks at pain, stiffness and function in the previous 48 h; a visual analogue scale of pain overall, at rest, and on movement in the preceding week; the Disease Repercussion Profile (DRP) [11], a generic quality of life measure that examines the impact of a condition on six areas (daily activities, social activities, finances, relationships, emotions and appearance) and asks the individual to describe how they are affected and the importance of this effect on a scale of 0–10; and the Illness Perceptions Questionnaire [12], which measures illness beliefs along dimensions of timeline, identity, causes, consequences, and cure/controllability.
Analysis
Data were analysed using SPSS. Descriptive results were reported as mean, s.d. and 95% confidence interval (CI). Differences between groups were evaluated using Student's t-test for numerical data and the χ2 test for categorical data. The factors explaining the seeking of advice from GPs and specialists were evaluated by stepwise logistic regression analysis using a model of log likelihood ratios, after excluding those factors that did not have a correlation of a significance of less than 0.10.
Results
Postal questionnaires were sent to 2940 patients: 1009 from practice A and 1931 from practice B. Nine hundred and eighty-nine (34%) were returned (Fig. 1) and 481 of these (49%) indicated the presence of some knee pain in the previous 12 months. Two hundred and eighty-one (58%) volunteered to attend for further assessment, of whom 231 (82%) attended for review. Of these 231 individuals, 135 were female (58%) and the mean age was 65 (range 50–88). One hundred and thirty-four patients (58%) had consulted their GP about their knee pain. There were no significant differences in sex and age between consulters and non-consulters (Table 1). There was a difference in consultation rates between GP practices; 63% of patients in practice B sought advice compared with only 37% in practice A. No significant differences (at the 10% level) were found in sex, age or patient-reported pain and function between the two practices. Overall, 70 of those with knee pain (52%) who consulted their GP reported being given a diagnosis of OA (Table 2). For those not given a diagnosis of OA, it was not documented whether they were given no diagnosis or an alternative diagnosis (e.g. wear and tear or rheumatism).
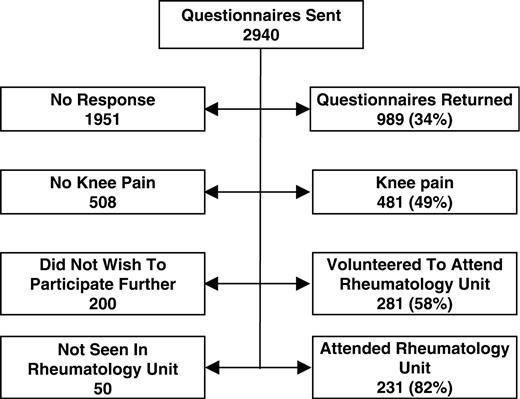
Identification of cases in the survey.
Demographic details of 231 people seen with knee pain
| Seen GP with knee pain | |||||
|---|---|---|---|---|---|
| Variable | Yes (n = 134) | No (n = 97) | Significance | ||
| Gender | |||||
| Male | 53 (40%) | 43 (44%) | NS | ||
| Female | 81 (60%) | 54 (56%) | |||
| Age (yr) | |||||
| Mean (range) | 66 (50–88) | 64 (51–85) | NS | ||
| s.d. 9.35 | s.d. 7.82 | ||||
| GP practice | |||||
| Practice A | 50 (37%) | 61 (63%) | χ2 = 14.2 | ||
| Practice B | 84 (63%) | 36 (37%) | DF = 1 | ||
| P<0.001 | |||||
NS, not significant; DF, degrees of freedom.
Management approaches in people with knee pain
| Seen GP | Not seen GP | Total | |
|---|---|---|---|
| Variable | (n = 134) | (n = 97) | (n = 231) |
| Given diagnosis of OA | |||
| Yes | 70 (52%) | 2 (2%)a | 72 (31%) |
| No | 54 (40%) | 95 (98%) | 149 (65%) |
| Not recalled | 10 (8%) | 0 | 10 (4%) |
| Used analgesics | |||
| Yes | 55 (41%) | 21 (22%) | 76 (33%) |
| No | 70 (52%) | 76 (78%) | 146 (63%) |
| Not recalled | 9 (7%) | 0 | 9 (4%) |
| Used NSAIDs | |||
| Yes | 48 (36%) | 5 (5%) | 53 (23%) |
| No | 77 (58%) | 92 (95%) | 169 (73%) |
| Not recalled | 9 (7%) | 0 | 9 (4%) |
| GP referred to physiotherapy | |||
| Yes | 28 (21%) | 1 (1%)b | 29 (13.5%) |
| No | 105 (78%) | 96 (99%) | 201 (87%) |
| Not recalled | 1 (1%) | 0 | 1 (0.5%) |
| GP referred to orthopaedics | |||
| Yes | 11 (8%) | 0 | 11 (5%) |
| No | 123 (92%) | 97 (100%) | 220 (95%) |
| Not recalled | 0 | 0 | 0 |
| GP referred to rheumatology | |||
| Yes | 11 (8%) | 0 | 11 (5%) |
| No | 123 (92%) | 97 (100%) | 220 (95%) |
| Not recalled | 0 | 0 | 0 |
aTwo patients with knee pain were told by their GPs that they had osteoarthritis during the course of consultations for other problems; bone patient had physiotherapy arranged by their GP without being seen in a consultation.
Of those who had consulted their GP about knee pain, 41 and 36% recalled being prescribed analgesics or NSAIDs, respectively, whilst 22% of non-consulters had taken over-the-counter medications and 5% of non-consulters had taken analgesics or NSAIDs for other conditions. Referrals to secondary care were infrequent; 11 (8%) of patients who had consulted their GP were referred to orthopaedics and 11 (8%) to rheumatology. No patients had received referrals to both orthopaedic and rheumatology departments. Twenty-eight consulters (21%) were referred to physiotherapy.
Participants who had seen their GP about knee pain had more severe disease, with significantly higher WOMAC pain and stiffness scores, clinically detectable swelling in both knees and less movement, than non-consulters (Table 3). In contrast in the patients who consulted their GP for knee pain, there were no significant differences in WOMAC pain and stiffness scores in range of movement between those patients who had also been reffered to rheumatology or orthopaedic clinics and those who had not been reffered, though there were differences in the presence of knee swelling and bony enlargement.
Clinical features in people with knee pain
| Seen GP with knee pain | Referred to rheumatology/orthopaedics | |||||||||
|---|---|---|---|---|---|---|---|---|---|---|
| Yes | No | Yes | No | |||||||
| Variable | (n = 134) | (n = 97) | Significance | (n = 22) | (n = 112) | Significance | ||||
| WOMAC pain score | 6.5 (5.8, 7.2) | 4.4 (3.7, 5.1) | P<0.0001 | 7.8 (5.7, 9.8) | 6.3 (5.6, 7.0) | NS | ||||
| WOMAC stiffness score | 3.0 (2.7, 3.3) | 2.2 (1.9, 2.5) | P<0.001 | 3.2 (2.3, 4.0) | 2.9 (2.6, 3.2) | NS | ||||
| Right knee range of movement | 103 (99, 107) | 110 (106, 115) | P<0.002 | 105 (93, 117) | 103 (99, 107) | NS | ||||
| Left knee range of movement | 106 (102, 110) | 114 (109, 119) | P<0.0001 | 101 (87, 104) | 107 (103, 111) | NS | ||||
| Right knee crepitus | 123 (92%) | 85 (89%) | NS | 19 (86%) | 103 (92%) | NS | ||||
| Right knee swelling | 49 (37%) | 20 (21%) | P<0.015 | 7 (32%) | 42 (38%) | NS | ||||
| Right knee bony enlargement | 14 (10%) | 12 (12%) | NS | 3 (14%) | 11 (10%) | NS | ||||
| Left knee crepitus | 126 (94%) | 83 (87%) | NS | 20 (91%) | 105 (94%) | NS | ||||
| Left knee swelling | 49 (37%) | 19 (20%) | 0.009 | 13 (59%) | 36 (32%) | P = 0.016 | ||||
| Left knee bony enlargement | 24 (18%) | 12 (12%) | NS | 7 (32%) | 17 (15%) | P = 0.05 | ||||
Means (95% CI) are shown. Differences between groups were evaluated using unpaired t-test. NS, not significant.
Disability and handicap were more severe in those who consulted their GP; they had higher WOMAC functional scores and higher DRP social, financial and economic, and emotional scores (Table 4). There were also differences in some DRP domains for referral to specialist care; they had higher DRP scores for financial and economic, relationships and image domains. There were no significant differences between those referred to orthopaedic and to rheumatology departments, although any differences could have been masked by the small numbers involved.
Function and handicap in people with knee pain
| Seen GP with knee pain | Referred to rheumatology/orthopaedics | |||||||||
|---|---|---|---|---|---|---|---|---|---|---|
| Yes | No | Yes | No | |||||||
| Variable | (n = 134) | (n = 97) | Significance | (n = 22) | (n = 112) | Significance | ||||
| WOMAC functional score | 21.2 (19.0, 23.5) | 15.3 (12.8, 17.9) | P<0.001 | 26.9 (19.8, 34.0) | 20.1 (17.8, 22.3) | NS | ||||
| DRP social | 1.75 (1.23, 2.27) | 0.64 (0.24, 1.03) | P = 0.001 | 3.00 (1.27, 4.73) | 1.51 (0.98, 2.03) | NS | ||||
| DRP financial and economic | 1.37 (1.23, 2.27) | 0.52 (0.18, 0.87) | P = 0.032 | 3.09 (1.18, 5.00) | 1.04 (0.56, 1.51) | P = 0.008 | ||||
| DRP relationships | 0.63 (0.26, 1.00) | 0.23 (0.04, 0.50) | NS | 3.18 (1.36, 5.01) | 0.13 (0.0, 0.30) | P<0.001 | ||||
| DRP emotion | 2.63 (2.04, 3.23) | 1.59 (1.02, 2.06) | P = 0.02 | 3.18 (1.52, 4.84) | 2.53 (1.89, 3.17) | NS | ||||
| DRP image | 0.64 (0.30, 0.98) | 0.23 (0.03, 0.48) | NS | 1.50 (0.18, 2.82) | 0.47 (0.15, 0.79) | P = 0.038 | ||||
| DRP function | 3.62 (3.00, 4.24) | 2.36 (1.73, 3.00) | P = 0.008 | 4.18 (2.30, 6.06) | 3.51 (2.86, 4.18) | NS | ||||
Means (95% CI) are shown. Differences between groups were evaluated using unpaired t-test. NS, not significant.
A number of health beliefs were associated both with individuals consulting their GP and with individuals referred to specialist care (Table 5). They were more likely to believe their knee pain was permanent, would last a long time, was a serious condition, and would have major consequences on their lives. Conversely, they were less likely to believe it would become easier to live with and would not have much effect on their life. In addition, those who saw their GP believed their knee pain strongly affected the way they, and others, saw them.
Beliefs about effects of illness in people with knee pain
| Seen GP with knee pain | Referred to rheumatology/orthopaedics | |||||||||
|---|---|---|---|---|---|---|---|---|---|---|
| Yes | No | Yes | No | |||||||
| (n = 134) | (n = 97) | Significance | (n = 22) | (n = 112) | Significance | |||||
| Permanent | ||||||||||
| Strongly agree | 24 (18%) | 5 (5%) | χ2 = 23.7 | 9 (41%) | 15 (13%) | χ2 = 10.5 | ||||
| Agree | 79 (59%) | 41 (42%) | DF = 3 | 10 (45%) | 69 (62%) | DF = 3 | ||||
| Neither | 22 (16%) | 32 (32%) | P<0.001 | 3 (14%) | 19 (17%) | P = 0.015 | ||||
| Disagree | 9 (7%) | 18 (19%) | – | 9 (8%) | ||||||
| Will last long time | ||||||||||
| Strongly agree | 19 (14%) | 6 (6%) | χ2 = 10.5 | 8 (36%) | 11(10%) | χ2 = 10.9 | ||||
| Agree | 69 (51%) | 38 (39%) | DF = 3 | 9 (41%) | 60 (54%) | DF = 3 | ||||
| Neither | 32 (24%) | 33 (34%) | P = 0.015 | 4 (18%) | 28 (25%) | P = 0.012 | ||||
| Disagree | 14 (10%) | 19 (20%) | 1 (5%) | 13 (12%) | ||||||
| Serious condition | ||||||||||
| Strongly agree | 7 (5%) | 1 (1%) | χ2 = 24.0 | 4 (18%) | 3 (3%) | χ2 = 15.3 | ||||
| Agree | 45 (34%) | 17 (18%) | DF = 4 | 11 (50%) | 34 (30%) | DF = 4 | ||||
| Neither | 42 (31%) | 27 (28%) | P<0.001 | 2 (9%) | 40 (36%) | P = 0.004 | ||||
| Disagree | 39 (29%) | 39 (40%) | 5 (23%) | 34 (30%) | ||||||
| Strongly disagree | 1 (1%) | 12 (12%) | – | 1 (1%) | ||||||
| Poor medical care in the past | ||||||||||
| Strongly agree | 2 (1%) | – | NS | 2 (9%) | – | χ2 = 13.7 | ||||
| Agree | 10 (7%) | 6 (6%) | 3 (14%) | 7 (6%) | DF = 4 | |||||
| Neither | 37 (28%) | 23 (24%) | 6 (27%) | 31 (28%) | P = 0.008 | |||||
| Disagree | 67 (50%) | 48 (49%) | 7 (32%) | 60 (54%) | ||||||
| Strongly disagree | 18 (13%) | 19 (20%) | 4 (18%) | 14 (13%) | ||||||
| Major consequences on my life | ||||||||||
| Strongly agree | 7 (5%) | 1 (1%) | χ2 = 22.1 | 5 (23%) | 2 (2%) | χ2 = 22.0 | ||||
| Agree | 33 (25%) | 11 (11%) | DF = 4 | 8 (36%) | 25 (22%) | DF = 4 | ||||
| Neither | 39 (29%) | 28 (29%) | P<0.001 | 3 (14%) | 36 (32%) | P<0.001 | ||||
| Disagree | 48 (36%) | 36 (37%) | 4 (18%) | 44 (39%) | ||||||
| Strongly disagree | 6 (4%) | 20 (21%) | 1 (5%) | 5 (4%) | ||||||
| Become easier to live with | ||||||||||
| Strongly agree | 5 (4%) | 1 (1%) | χ2 = 9.5 | – | 5 (4%) | χ2 = 16.5 | ||||
| Agree | 29 (22%) | 23 (24%) | DF = 4 | 4 (18%) | 25 (22%) | DF = 4 | ||||
| Neither | 21 (16%) | 28 (29%) | P = 0.05 | 1 (5%) | 20 (18%) | P = 0.002 | ||||
| Disagree | 66 (49%) | 40 (41%) | 10 (45%) | 56 (50%) | ||||||
| Strongly disagree | 13 (10%) | 4 (4%) | 7 (32%) | 6 (5%) | ||||||
| Not had much effect on my life | ||||||||||
| Strongly agree | 1 (1%) | 9 (9%) | χ2 = 20.9 | – | 1 (1%) | χ2 = 16.9 | ||||
| Agree | 38 (28%) | 40 (41%) | DF = 4 | 5 (23%) | 33 (29%) | DF = 4 | ||||
| Neither | 30 (22%) | 22 (23%) | P<0.001 | 1 (5%) | 29 (26%) | P = 0.002 | ||||
| Disagree | 57 (43%) | 24 (25%) | 11 (50%) | 46 (41%) | ||||||
| Strongly disagree | 8 (6%) | 1 (1%) | 5 (23%) | 3 (3%) | ||||||
| Strongly affected the way I see myself | ||||||||||
| Strongly agree | 6 (4%) | – | χ2 = 20.6 | 3 (14%) | 3 (3%) | NS | ||||
| Agree | 50 (37%) | 18 | DF = 4 | 9 (41%) | 41 (37%) | |||||
| Neither | 27 (20%) | 20 | P<0.001 | 3 (14%) | 24 (21%) | |||||
| Disagree | 44 (33%) | 41 | 6 (27%) | 38 (34%) | ||||||
| Strongly disagree | 7 (5%) | 17 | 1 (5%) | 6 (5%) | ||||||
| Strongly affected the way others see me | ||||||||||
| Strongly agree | 2 (1%) | – | χ2 = 24.4 | 1 (5%) | 1 (1%) | NS | ||||
| Agree | 24 (18%) | 4 | DF = 4 | 8 (36%) | 16 (14%) | |||||
| Neither | 29 (22%) | 13 | P<0.001 | 4 (18%) | 25 (22%) | |||||
| Disagree | 63 (47%) | 47 | 7 (32%) | 56 (50%) | ||||||
| Strongly disagree | 16 (12%) | 32 | 2 (9%) | 14 (13%) | ||||||
Numbers responding in each group are shown. Differences between groups were compared using the χ2 test. DF, degrees of freedom, NS, not significant.
A regression analysis evaluated the factors that predicted who would consult their GP about their knee pain (Table 6). Only factors with an initial correlation of significance of 0.10 were included in the analysis, which was run with visual analogue scale scores in each of the relevant domains. The main predictors were GP practice, DRP social domain score and the beliefs that the knee pain would have a permanent effect and that it would strongly affect the way others saw them. These four factors gave a correct classification in 74% of cases. A second regression analysis examined factors that predicted specialist referral. These comprised knee swelling, DRP function and relationship domain scores and the beliefs that the knee pain would have a major effect on their lives and would strongly affect the way they saw themselves. These five factors gave a correct classification in 88% of cases.
Regression analyses of factors influencing seeing GP and specialist referral in people with knee pain
| Seen GP with knee pain | Referred to rheumatology/orthopaedics | ||||||||||||
|---|---|---|---|---|---|---|---|---|---|---|---|---|---|
| Variable | Model log likelihood | Change in −2 log likelihood | Significance of the change | Variable | Model log likelihood | Change in −2 log likelihood | Significance of the change | ||||||
| GP practice | −131.081 | 7.692 | 0.006 | Left knee swelling | −39.331 | 5.275 | 0.022 | ||||||
| DRP social | −128.858 | 3.247 | 0.072 | DRP function | −38.774 | 4.163 | 0.041 | ||||||
| Permanent effect | −129.978 | 5.486 | 0.019 | DRP relationships | −47.013 | 20.640 | 0.001 | ||||||
| Strongly affected the way others see me | −132.760 | 11.051 | 0.001 | Major effect | −40.323 | 7.259 | 0.007 | ||||||
| Strongly affected the way I see myself | −38.896 | 4.406 | 0.036 | ||||||||||
| Correct classification in 74% cases | Correct classification in 88% cases | ||||||||||||
Discussion
The purpose of this study was to examine the treatment of knee pain in a primary care population and to determine the rate of referrals to specialist care. Of the 231 patients who participated, less than half reported receiving prescribed analgesics or NSAIDs and only one-fifth had been referred to physiotherapy. The use of physiotherapy to treat knee pain in southeast London was comparable to that reported for knee OA patients treated by GPs in Wessex [8], but the use of NSAIDs and analgesics was substantially lower. Physiotherapy has been shown to improve function and reduce pain in this condition, so factors relating to low use of this service should be investigated.
A current concern is the extent to which knee pain should be dealt with in the community, especially as there is a wide range of musculoskeletal services within the community sector, with considerable variation in quality [13]. The balance of expert opinion favours community management rather than referral to orthopaedics and rheumatology, particularly given the high prevalence of knee pain [1]. Our own findings support this view as the patients with knee pain in our survey who were referred for specialist advice did not have more severe disease, but had higher levels of self-perceived handicap and more negative views about their condition. However, in this context it is of concern that the current new GP contract in the UK has no quality indicators for musculoskeletal problems [14] and that the National Service Framework for Older People for the NHS had no recommendations on the management of OA [15]. This is an area in which further research and development is needed; it is hoped that there will be scope to include OA in the next iteration of the GP contract.
Musculoskeletal conditions are among the principal health concerns that patients seek referral for [16]. UK surveys have shown consistent increases in the numbers of patients referred for specialist rheumatology advice [17, 18] with considerable regional differences in the patterns of referral [19]. Given the considerable resource implications for a knee referral [20], especially for orthopaedic services, it seems important to fully understand the processes involved. Our findings suggest that the wider aspects of OA, including its impact on social functioning and relationships, may be key factors.
Those who were referred for specialist advice did not have more severe symptoms than patients who consulted their GP but were not referred. There were no significant differences in WOMAC pain, stiffness or function scores between groups. This finding is in keeping with earlier findings from a group of 691 individuals aged over 55 yr with knee pain in the Rotterdam area in which the chronicity of pain was more important in health-care utilization than the severity of pain or the level of disability [21]. Study participants who were referred had higher scores in the financial and economic, relationships and image domains of the DRP. They also had higher scores on the timeline and consequence dimensions. The regression analysis showed that specialist referral was most likely in patients with knee swelling, high scores in DRP function and relationship domain scores, and those who perceived there to be more serious consequences as a result of the condition. It was not clear what the perceived serious consequences were, and this may be a productive area to explore using in-depth interviews, as suggested in previous work by Arcury and colleagues [22] and Lambert and colleagues [23]. The design of the study, in which knees were assessed separately in a disorder that is often unilateral, created some minor idiosyncrasies in the analysis, particularly in the finding that only left knee swelling was associated with referral for specialist advice; this almost certainly reflects the relatively small sample size and in a larger sample would most likely be superseded by both knees showing similar associations. Although post hoc changes in data analysis, such as taking the worst possible knee, could have corrected for this, we believe such changes are best avoided by an explanation of the likely cause of the finding.
The reasons that patients consult their primary care physicians for musculoskeletal conditions involve a complex mixture of social and psychological factors [24]. Participants who consulted their GPs about their knee pain had more severe disease, with higher WOMAC pain, stiffness and function scores. They also had higher DRP social, financial and economic and emotional scores. This latter finding supports not only pre-existing evidence that OA handicap can be assessed using the DRP [25] but also the widespread psychosocial impact of OA [26]. Interestingly, the dominant factors influencing GP consultation in our participants were not pain or function, but GP practice, the DRP social score and beliefs that the disease would have a permanent effect and that it affected the way individuals were viewed by others.
Of interest was that no overlap existed between factors predicting consultation with a GP and referral to secondary care. This may be due to the fact that referrals are largely determined by the GP, who assesses the severity of the presenting problem and the impact it has on the patient, whereas seeking help from the GP is a decision made by the patient. However, it is surprising that neither pain nor stiffness appeared in either regression analysis.
Illness beliefs have been examined in a wide array of chronic conditions, including myocardial infarction [27], irritable bowel syndrome [28], chronic fatigue syndrome [29] and rheumatoid arthritis [30], and have also been found to predict attendance at cardiac rehabilitation [31]. However, to our knowledge, no published work has quantitatively examined the role of illness beliefs in musculoskeletal conditions in relation to GP consultations. Findings in this study indicate that beliefs relating to consequences and timeline were important in relation to consulting the GP and being referred to secondary care.
Because of the cross-sectional nature of this study, the direction of causality cannot be determined. For example, beliefs about the permanence or consequences of the knee pain may have determined a visit to the GP or developed as a result of the consultation. Longitudinal research is required to fully explore these relationships. The generalizability of findings may be restricted as the two practices used in this study were in the same area of the UK. However, they were in different socio-economic areas, and one factor related to GP consultation was the practice, suggesting that they were sufficiently different from each other. The reasons for differences in consultation rates between the practices were uncertain, but may have concerned differences in disease duration or levels of self-efficacy regarding self-management of the condition, neither of which was recorded. Two individuals who had not consulted their GP about their knee pain reported being given a diagnosis of OA. The reasons for this are unclear but may be due to the patients generalizing from OA at other sites or assuming that symptoms of knee pain are equivalent to a diagnosis of OA.
Due to the low response rate (34%) and the possibility of response bias, the prevalence of knee pain in this sample may have been overestimated. One reason for the low response rate was that a number of patients were registered at addresses at which they did not live; therefore, many questionnaires were returned to us. In addition, the final sample size may not have been large enough to reveal associations between variables. This would require a large epidemiological study using a greater number of participants and GP practices.
This study examined rates of referrals and consultations with GPs for knee pain in a primary care sample. More longitudinal work is required on differences between factors influencing going to the doctor and referrals to secondary care, including the role of beliefs about the condition. This will help to provide a deeper understanding of the process of care for people with knee pain.
The Department is grateful for the continuing support of the ARC. This project received funding from local Primary Care Trusts (South Southwark and North Lambeth) and the NHS R & D Programme at Kings College Hospital. We thank Dr M. Kiln and Dr M. Hossain for their help and access to their patients.
The authors have no conflicts of interest.
References
Underwood MR. Community management of knee pain in older people: is knee pain the new back pain?
Hannan MT, Felson DT, Pincus T. Analysis of the discordance between radiographic changes and knee pain in osteoarthritis of the knee.
Peat G, McCarney R, Croft P. Knee pain and osteoarthritis in older adults: a review of community burden and current use of primary health care.
Jinks C, Jordan K, Ong BN, Croft P. A brief screening tool for knee pain in primary care (KNEST). 2. Results from a survey in the general population aged 50 and over.
Lane NE, Thompson JM. Management of osteoarthritis in the primary-care setting: an evidence-based approach to treatment.
Jordan KM, Sawyer S, Coakley P, Smith HE, Cooper C, Arden NK. The use of conventional and complementary treatments for knee osteoarthritis in the community.
Carstairs V, Morris R.
Bellamy N, Buchanan WW, Goldsmith CH, Campbell J, Stitt LW. Validation study of WoMAC: a health status instrument for measuring clinically important patient relevant outcomes to antirheumatic drug therapy in patients with osteoarthritis of the hip or knee.
Carr AJ, Thompson PW. Towards a measure of patient-perceived handicap in rheumatoid arthritis.
Weinman J, Petrie KJ, Moss-Morris R, Horne R. The illness perception questionnaire: a new method for assessing the cognitive representation of illness.
Roberts C, Dolman EA, Adebajo Ao, Underwood M. A national qualitative survey of community-based musculoskeletal services in the UK.
Department of Health.
Lin CT, Albertson G, Price D, Swaney R, Anderson S, Anderson RJ. Patient desire and reasons for specialist referral in a gatekeeper-model managed care plan.
Kirwan JR, Snow SM. Which patients see a rheumatologist? SWRACR (South Western Regional Advisory Committee on Rheumatology).
Kirwan JR, Averns H, Creamer P et al. Changes in rheumatology out-patient workload over 12 years in the South West of England.
Guilar J, Wamuo I, Choy EH, Hossain M, Scott DL. Who is referred for specialist rheumatology care?
Hopman-Rock M, de Bock GH, Bijlsma JW, Springer MP, Hofman A, Kraaimaat FW. The pattern of health care utilization of elderly people with arthritic pain in the hip or knee.
Arcury TA, Gesler WM, Cook HL. Meaning in the use of unconventional arthritis therapies.
Lambert BL, Butin DN, Moran D, Zhao SZ, Carr BC, Chen C, Kizis FJ. Arthritis care: comparison of physicians’ and patients’ views.
Uhlig T, Hagen KB, Kvien TK. Why do patients with chronic musculoskeletal disorders consult their primary care physicians?
Carr AJ. Beyond disability: measuring the social and personal consequences of osteoarthritis.
Brooks PM. Impact of osteoarthritis on individuals and society: how much disability? Social consequences and health economic implications.
Petrie KJ, Weinman JA (eds).
Rutter CL, Rutter DR. Illness representation, coping and outcome in irritable bowel syndrome (IBS).
Heijmans MJ. Coping and adaptive outcome in chronic fatigue syndrome: importance of illness cognitions.
Scharloo M, Kaptein AA, Weinman JA, Hazes JM, Breedveld FC, Rooijmans HG. Predicting functional status in patients with rheumatoid arthritis.
Author notes
1Department of Rheumatology, Kings College London School of Medicine and 2Department of Rheumatology, King's College Hospital, London, UK.

Comments