


Abstract
Background: Certain factors, such as race or age, are known to be associated with variation in initiation of adjuvant chemotherapy for stage III colon cancer, but little is known about what factors are associated with completion of adjuvant therapy. To determine whether predictors of initiation also predict completion, we analyzed Surveillance, Epidemiology, and End Results (SEER) program data linked to Medicare claims. We investigated mortality as a means to testing the validity of the completion measure that we created. Methods: We studied 3193 stage III colon cancer patients whose diagnosis was recorded in 1992–1996 SEER program data linked to 1991–1998 Medicare claims and who initiated adjuvant chemotherapy after colon cancer resection. We defined a measure of adjuvant chemotherapy completion as one chemotherapy administration claim in a month. We tested the validity of the created measure and its relation to 3-year cancer mortality adjusted for demographic, clinical, and environmental variables. We explored the association of patient characteristics and treating physician characteristics with chemotherapy completion by use of multivariable logistic regression modeling. Results: Of the 3193 patients, 2497 (78.2%) completed the course. Risk of cancer-related mortality was statistically significantly lower among those completing chemotherapy (relative risk = 0.79, 95% confidence interval = 0.69 to 0.89) than those with no adjuvant therapy. Patients who were female, widowed, increasingly elderly, rehospitalized, and living in certain regions were less likely to complete adjuvant chemotherapy than other patients. Race and other clinical, environmental, and physician characteristics were not associated with completion of therapy. Conclusions: Factors associated with incomplete adjuvant chemotherapy may represent physical frailty, treatment complications, and lack of social and psychological support. Interventions to mitigate these influences are a logical next step toward increasing chemotherapy completion rates.
During the late 1980s and early 1990s, a series of randomized clinical trials demonstrated that fluoropyrimidine-based adjuvant chemotherapy provides a consistent survival advantage for stage III colon cancer patients when compared with surgery alone ( 1 – 6 ) . As a result of proven benefit, a 1990 National Institutes of Health Consensus Panel on Colorectal Cancer recommended routine adjuvant chemotherapy for these cancers ( 7 ) .
Despite these recommendations, not all patients with stage III colon cancer initiate adjuvant chemotherapy. Patients who are African American, are the most elderly, have more comorbidities, are unmarried, or live in certain regions of the United States are all less likely to initiate recommended adjuvant chemotherapy for stage III colon cancer than patients who are white, younger, married, or healthier ( 8 – 15 ) . Initiation of chemotherapy is, however, only the first step to improved survival. If groups that are less likely to initiate adjuvant chemotherapy also complete chemotherapy at lower rates, they will have an even greater survival disadvantage. There are few published studies on adjuvant chemotherapy completion rates for colon cancer. One randomized clinical trial showed a completion rate of 69%, but predictors of completion have not been studied ( 16 ) .
We examined adjuvant chemotherapy completion rates in a population of elderly patients with stage III colon cancer to investigate the hypothesis that the same characteristics that predict differences in initiation of adjuvant chemotherapy would predict completion of a complete course of therapy. We identified patients whose data were captured by the National Cancer Institute's Surveillance, Epidemiology, and End Results (SEER) program and in the Medicare claims data. Identifying characteristics that predict completion of treatment should help to provide information for interventions to increase adherence to treatment and thereby should increase colon cancer survival rates.
P ATIENTS AND M ETHODS
Data Source
In this study, we used data from the SEER cancer registries linked with Medicare claims data for persons found in both files. The SEER–Medicare database is generated through the cooperative efforts of the Center for Medicare and Medicaid Services, the National Cancer Institute, and the SEER registries. Our study database included data for incident colon cancer cases identified in the SEER registry between 1992 and 1996 and data from Medicare claims between January 1, 1991, and December 31, 1998. The Medicare program insures 97% of the U.S. population aged 65 years and older; linked with SEER, the Medicare data allow examination of cancer treatment for nearly all elderly Americans in fee-for-service care within the SEER program areas. At the time of this study, the SEER program gathered data on all incident cancer cases among individuals residing in the following five states and eight metropolitan or county-based areas in five other states: New Mexico, Connecticut, Hawaii, Iowa, Utah, Arizona Indians (which we group with New Mexico), Atlanta and rural Georgia, Detroit, Los Angeles, Seattle and Puget Sound, San Francisco, and San Jose. These areas represent approximately 14% of the U.S. population. SEER data include patient demographics, cancer type and stage, and initial surgical and radiation treatment information. Medicare data include enrollment dates, health maintenance organization membership and fee-for-service beneficiaries' dates of service, diagnosis codes, and procedure codes for services provided by hospitals (i.e., MedPAR files), physicians and clinics (i.e., Carrier file), and noninstitutional facilities (i.e., Outpatient file) ( 17 ) . For 98% of physicians submitting Medicare claims, unique physician identifying numbers (i.e., UPINs) in these data can be used to link physician characteristics from the American Medical Association Masterfile database (e.g., demographics, primary and secondary specialty, board certification, and practice characteristics) ( 18 ) .
Study Population
We identified 9796 patients aged 66 years and older from the linked database who were diagnosed with primary stage III colon cancer from January 1, 1992, through December 31, 1996. Colon cancers included all adenocarcinomas in the colon or rectosigmoid. American Joint Committee on Cancer criteria ( 19 ) were used to designate cancer stage. We sequentially excluded 269 patients with a prior colorectal cancer, 11 patients with simultaneous stage IV colorectal cancer, and three patients whose colorectal cancer diagnosis was from autopsy or their death certificate. We then excluded 2247 patients without continuous Part A and B enrollment in fee-for-service Medicare in the 11 months preceding the month before diagnosis to allow measurement of prior comorbidity. We also excluded 1138 patients who died and 193 patients with incomplete enrollment in the 9 months after diagnosis, to enable ascertainment of adjuvant chemotherapy receipt. Finally, because patients without primary surgical treatment were likely to differ from those who have timely surgery in ways that would render them less likely to have adjuvant therapy, we excluded the 157 patients who did not receive surgical resection for their cancer within 6 months of diagnosis.
We conducted frequency and cross-tabulation descriptive analyses for the 5778 patients who met the inclusion criteria and calculated their chemotherapy initiation rates. Chemotherapy initiation was defined as at least one claim indicating administration of chemotherapy (Current Procedural Terminology codes 96408, 96410, 96412, 96414, 96545, 96549, 96520, or 96530; International Classification of Diseases, 9th Edition [ICD-9] procedure code 99.25, ICD-9 diagnosis codes E 0781 and V58.1; and Health Care Common Procedure codes J0640, J9190, or Q0083-85). We limited further analyses on chemotherapy completion to the 3193 patients who initiated adjuvant chemotherapy.
Completion of Adjuvant Chemotherapy
The main outcome variable was receipt of a complete course of adjuvant chemotherapy. During our study period, the standard length of time for an adjuvant chemotherapy course shifted from 12 to 6 months because of results from randomized clinical trials ( 20 ) . Because oncologists began adopting the 6-month regimen during our study period, we accepted 6 months or cycles of a chemotherapy regimen as the standard from which we defined a complete course of chemotherapy to avoid underascertainment of completion.
We defined months or cycles of chemotherapy from the typical regimens at the time of the study: daily for a week each cycle of 21 or 28 days, 1 day each week for 6 weeks followed by 2 weeks without therapy (the Roswell Park regimen), and pump administration. We adapted these chemotherapy cycle definitions to the data available in the Medicare claims by identifying individual claim days of chemotherapy.
To allow for missing claims within the recommended 6 months or cycles, we defined a complete course of adjuvant chemotherapy as 5 months of chemotherapy. We developed a liberal definition of a complete cycle (one claim day in a month) and a more conservative definition of a complete cycle (three claim days in a month) to allow for claims and inpatient stays that extended over several days of treatment.
To avoid misclassifying chemotherapy for cancer recurrence as adjuvant therapy, we considered only chemotherapy that was administered within a designated treatment period, which began with the first claim date for surgery, chemotherapy, or radiation therapy after diagnosis and ended 1) with the claim date after which there were 3 months without any type of colon cancer treatment, 2) with a cancer recurrence, or 3) 9 months after diagnosis, whichever came first. We originally required that all members of our sample be alive and fully enrolled in Medicare for 18 months after diagnosis to allow for up to 6 months after diagnosis to receive surgery and up to 12 months after surgery to receive adjuvant chemotherapy. We found, however, that virtually all (i.e., 99.8%) of those who completed an adjuvant course of chemotherapy did so within 9 months of diagnosis. Using the 9-month date allowed us to maximize our study sample size by retaining 1012 cases that otherwise would have been excluded because of incomplete enrollment in Medicare between the 10th and 18th months after diagnosis.
Explanatory Variables
Patient sociodemographic and clinical characteristics. Data on age, race, marital status (married, widowed, divorced, or single), and sex were obtained from SEER. From inpatient and outpatient claims in the 11 months preceding the month before diagnosis, we applied Romano's adaptation of the Charlson comorbidity index, which is a weighted score of 18 conditions such as myocardial infarction, congestive heart failure, and chronic pulmonary disease ( 21 , 22 ) . We classified individuals into groups by their Charlson comorbidity score (i.e., 0, 1, or ≥2). Data on tumor stage, number of positive lymph nodes, and tumor grade were obtained from SEER records.
We constructed two additional rehospitalization variables representing clinical factors that may have been associated with interruption or cessation of adjuvant chemotherapy. The first captured rehospitalization during the postsurgical period (1–6 weeks), and the second captured the subsequent treatment period (7 weeks until the end of the treatment period). We excluded hospitalizations that were primarily for chemotherapy or radiation therapy (Diagnostic-Related Groupings 409 or 410). Also, we wanted to include only those hospitalizations that occurred within the time frame that could influence chemotherapy completion. Therefore, for patients who received a complete course of chemotherapy, we included hospitalizations occurring before the completion of chemotherapy, and for those who did not receive a complete course, we included hospitalizations that occurred up to 2 months after the last cancer treatment date (e.g., for chemotherapy, radiation therapy, index surgery, or stoma closure). We hypothesized that rehospitalizations in weeks 1–6 likely represented postoperative complications or the combination of comorbidity and postoperative complications, whereas those beyond week 6 coincided with the receipt of adjuvant chemotherapy or the combination of comorbidity and receipt of adjuvant chemotherapy.
Environmental variables. Race- and age-specific median household income in the patient's census tract served as a proxy for socioeconomic status. The SEER registry to which each patient was reported represented the region of the country in which each patient received care.
Location of patient residence was represented by the plurality residence ZIP code on the Medicare claims during the month of diagnosis or the most proximate claim. ZIP codes were classified according to individual Rural Urban Commuting Areas codes aggregated into four levels: urban, large rural city/town, small rural town, and isolated small rural town ( 23 , 24 ) .
Physician characteristics. Physicians administering chemotherapy were identified by physician identifying number on the patients' chemotherapy administration claims in the Carrier and Outpatient Files from the Center for Medicare and Medicaid Services. We considered the physician who had the most chemotherapy administration claims during each patient's treatment period to be the physician responsible for chemotherapy completion.
To designate the specialty of the treating physician, we examined the primary and secondary specialty from the 1993 and 1997 American Medical Association Masterfile and the plurality specialty classification from the Medicare claims. Physicians were designated as medical oncologists if their specialty was listed as medical oncology, hematology/oncology, or pediatric hematology/oncology in any source.
Demographic and practice characteristics for the treating physician included age (<40 years, 40–49, 50–59, or ≥60 years), sex, race (white, African American, Hispanic, Asian, other, or missing), board certification, solo or group practice, and number of years in practice. To measure treating physician volume, we looked in the year of diagnosis for the index patient and counted the number of colon or rectal cancer patients for whom the provider submitted chemotherapy administration claims to the Medicare program. Although this method does not capture non-Medicare physician volume, it has been used in other, similar studies in which surgical volume was a variable of interest ( 25 – 27 ) .
Among 3193 patients who received adjuvant chemotherapy, 2% did not have an identifiable chemotherapy-administering physician or the needed physician information. We performed analyses by exploring physician characteristics on the remaining 3144 (98%) patients. Because race of the treating physician was missing for 30% of the patients, we included missing race as a variable in the regression analyses.
Control Variables
Patients with metastatic cancer recurrence could either discontinue chemotherapy or continue with prolonged chemotherapy that would no longer be considered adjuvant therapy. To avoid overestimating the numbers of patients completing adjuvant therapy by erroneously including those receiving therapy for a cancer recurrence, we created a variable indicating a metastatic disease before the end of a complete course of chemotherapy or within the treatment period. This variable included liver metastases (Current Procedural Terminology codes 36246–7, 47120, 47122, 47125, 47130, 47370–1, 47380–2, 76362, 76394, 76490, 36260, or 47100; ICD9-P 50.20–2, 50.29, 50.3, or 50.4; or ICD-9 197.7) and secondary malignancies (ICD-9 197.0–3, 197.8, 198.3–5, 198.41, 198.45, 198.48, 198.51, 197.04, or 197.08).
Statistical Analysis
We first described the demographic, clinical, and environmental characteristics of all eligible stage III colon cancer patients and then used chi-square tests to compare their rates of initiation of adjuvant chemotherapy by characteristic. All P values in our analyses are from two-sided tests.
Earlier work with the SEER–Medicare data has documented the high sensitivity of Medicare claims to identify chemotherapy initiation consistent with recommended care regimens ( 28 , 29 ) . Because these data have not been used previously to define chemotherapy completion, we sought evidence of the validity of both our liberal and conservative definitions of chemotherapy completion by examining their association with 3-year cancer mortality. If the completion variable is valid, we would expect the mortality to be lowest for those who complete a course of adjuvant chemotherapy. With mortality data available only through December 31, 1998, this analysis was limited to the 4711 patients diagnosed between January 1, 1992, and December 31, 1995. We compared the 3-year cancer mortality of patients with a complete chemotherapy course, patients with some but incomplete course of chemotherapy, and those with no chemotherapy. We used chi-square tests to test for unadjusted differences in mortality across the three groups and then conducted multivariable logistic regression (SAS version 8.2; SAS, Cary, NC) to compute the adjusted relative risk (RR) of mortality. Factors other than a complete course of chemotherapy could affect mortality rates; indeed, we predicted that patients with more aggressive tumors and with recurrence would be less likely to complete therapy and more likely to die, thereby inflating the relative risk of survival for those who completed therapy. Therefore, we controlled for tumor size, number of positive lymph nodes, tumor grade, and cancer recurrence in the treatment period.
After describing the characteristics of those study patients who received some adjuvant chemotherapy, we used chi-square tests to compare the rates of complete adjuvant chemotherapy by patient and physician characteristics. Again, we used both the liberal and conservative definitions of chemotherapy completion. We adopted a stricter statistical significance level (i.e., P <.01) because of the number of statistical tests being performed.
We used multiple logistic regression modeling to measure the relationships among patient, tumor, clinical, environmental, or physician characteristics and the interactions of statistically significant variables and receipt of a complete course of chemotherapy. Patient characteristics included age (66–70 years, 71–75 years, 76–80 years, 81–85 years, or ≥86 years), race (white, African American, Hispanic, Asian or Pacific Islander, or other/unknown), sex (male or female), and marital status (married, divorced/separated/single, or widowed). Tumor characteristics included T stage (T1, T2, T3, or T4), number of positive lymph nodes (N0 or zero, N1 or 1–3, or N2 or 4–96), and tumor grade (well differentiated, moderately differentiated, poorly differentiated, or undifferentiated). Clinical characteristics included a comorbidity score (0, 1, or ≥2), whether the patient was rehospitalized during weeks 1–6 after surgical resection, and whether the patient was rehospitalized from week 7 after surgical resection through the treatment period. Environmental characteristics included census tract–based race- and age-specific median annual household income (≤$25 000, $25 001–$35 000, $35 001–$45 000, or ≥$45 001), residence location (urban, large rural, small rural, or remote rural), the SEER registry and the year of diagnosis (1992, 1993, 1994, 1995, or 1996). Physician characteristics included age (<40 years, 40–49 years, 50–59 years, 60–69 years, or ≥60 years), sex (female or male), race (white, African American, Hispanic, Asian or Pacific Islander, or other/unknown), duration of practice (1–15 years, 16–20 years, 21–25 years, or ≥26 years), if a medical oncologist, volume of chemotherapy patients in the diagnosis year (1, 2, 3–4, or ≥5), and practice type (solo or group). To avoid misclassifying chemotherapy for recurrence as adjuvant chemotherapy, we controlled for cancer recurrence in these analyses.
The main two criteria for including a variable in the final model were statistical significance of the variable at a P value of .09 or less or the improvement in overall fit of the model at a statistical significance level of .05 or less. We included standard patient demographic and environmental variables (e.g., race/ethnicity, age, sex, marital status, location of residence, and age- and race-specific household income) and SEER registry regardless of statistical significance. Because outcomes were relatively common, odds ratios (ORs) were transformed to relative risks with 95% confidence intervals (CIs) for the variables that were retained in the final model, as described previously ( 30 ) . We applied generalized estimating equations method to our final models to account for clustering of patients by physician and found no substantial differences in our results. Therefore, we report the results of the standard regression model, because this method allowed us to use likelihood ratio tests instead of Wald tests and because generalized estimating equations method uses a pseudolikelihood rather than an actual likelihood.
Throughout the study, we excluded individuals with missing values only as necessary for specific analyses. The missing value rates were generally low, with the exception of the variable physician race. Because of the high missing value rate for this variable, we created a missing race category for use in analyses.
R ESULTS
Of the initial 5778 patients, 3193 (55.3%) received adjuvant therapy. The characteristics of the initial study population and the adjuvant chemotherapy initiation rates by characteristic are summarized in Table 1 . Consistent with other studies, the racial and ethnic groups that were least likely to receive adjuvant chemotherapy were African American. Patients who were most likely to receive adjuvant chemotherapy were 75 years or younger, male, married, with fewer hospital readmissions after surgery, or living in a census tract with average annual median incomes greater than $25 000 compared with other groups. Among the 5 study years, patients diagnosed in 1996 (i.e., the last year of diagnoses in the study population) had the highest adjuvant chemotherapy rates.
Characteristics and rate of adjuvant chemotherapy initiation of stage III colon cancer patients (n = 5778) *
| Characteristic | Patients with stage III colon cancer, % | Rate of initiation of adjuvant chemotherapy, % |
|---|---|---|
| Total | 100.0 | 55.3 |
| Demographic | ||
| Age | ||
| 66–70 y | 21.6 | 78.9 † |
| 71–75 y | 26.1 | 71.2 |
| 76–80 y | 24.3 | 56.3 |
| 81–85 y | 17.2 | 29.8 |
| ≥86 y | 10.9 | 8.1 |
| Race | ||
| White | 84.3 | 55.7 ‡ |
| African American | 7.3 | 46.1 |
| Hispanic | 3.4 | 59.0 |
| Asian or Pacific Islander | 4.3 | 59.3 |
| Other or unknown | 0.7 | 55.8 |
| Sex | ||
| Female | 55.4 | 50.8 † |
| Male | 44.6 | 60.9 |
| Marital status | ||
| Married | 54.1 | 64.6 † |
| Divorced, separated, or single | 11.7 | 51.0 |
| Widowed | 34.2 | 42.3 |
| Tumor | ||
| T stage | ||
| T1 | 2.0 | 60.2 |
| T2 | 8.4 | 58.6 |
| T3 | 82.9 | 54.8 |
| T4 | 6.7 | 54.8 |
| No. of positive lymph nodes | ||
| N0 (0 lymph nodes) | 0.4 | 40.9 † |
| N1 (1–3 lymph nodes) | 71.5 | 53.1 |
| N2 (4–96 lymph nodes) | 28.1 | 62.1 |
| Tumor grade | ||
| Well differentiated | 5.5 | 51.3 |
| Moderately differentiated | 67.4 | 55.1 |
| Poorly differentiated | 26.1 | 56.2 |
| Undifferentiated | 1.1 | 52.5 |
| Clinical | ||
| Comorbidity score | ||
| 0 | 68.8 | 58.8 † |
| 1 | 17.2 | 48.3 |
| ≥2 | 14.1 | 46.6 |
| Hospital readmission | ||
| 1–6 wk after surgery | ||
| Yes | 10.1 | 44.8 † |
| No | 89.9 | 56.4 |
| ≥7 wk | ||
| Yes | 14.6 | 85.7 † |
| No | 85.4 | 50.1 |
| Environmental | ||
| Census tract–based race- and age-specific median annual household income | ||
| ≤$25 000 | 51.2 | 48.8 † |
| $25 001–$35 000 | 28.4 | 60.3 |
| $35 001–$45 000 | 12.1 | 64.5 |
| ≥$45 001 | 8.3 | 65.9 |
| Residence location | ||
| Urban | 82.6 | 55.0 |
| Large rural | 6.2 | 55.6 |
| Small rural | 5.8 | 55.9 |
| Remote rural | 5.4 | 58.2 |
| SEER registry | ||
| Arizona/New Mexico | 3.2 | 53.2 |
| Connecticut | 15.5 | 54.9 |
| Atlanta/rural Georgia | 5.7 | 59.8 |
| Hawaii | 2.5 | 55.9 |
| Iowa | 16.2 | 57.0 |
| Los Angeles | 14.6 | 56.4 |
| Detroit | 16.3 | 57.1 |
| Seattle/Puget Sound | 9.0 | 54.0 |
| San Francisco | 8.7 | 48.1 |
| San Jose | 4.3 | 50.6 |
| Utah | 3.8 | 56.3 |
| Year of diagnosis | ||
| 1992 | 21.1 | 53.8 ‡ |
| 1993 | 20.0 | 54.0 |
| 1994 | 20.4 | 54.9 |
| 1995 | 20.0 | 53.7 |
| 1996 | 18.5 | 60.4 |
Missing values include the following: marital status = 100; positive lymph nodes = 201; grade = 216; race- and age-specific median annual household income by census tract = 507; residence location = 1. SEER = Surveillance, Epidemiology, and End Results.
P <.001.
P ≤.01(specifically, for race, P = .002; for year of diagnosis, P = .007).
Using the liberal definition of a complete course (i.e., one claim in a month), 2162 (45.9%) of 4711 patients diagnosed between January 1, 1992, and December 31, 1995, received no adjuvant chemotherapy; 569 (12.1%) received some chemotherapy without completion; and 1980 (42.0%) received a complete course of therapy ( Table 2 ). We found no statistically significant differences between these completion rates and those calculated with the more conservative definition of a complete course (i.e., three claim days in a month). Risk of cancer-related mortality was statistically significantly lower among those completing chemotherapy by either definition than among those not completing chemotherapy; for the liberal definition, the relative risk was 0.79 (95% CI = 0.69 to 0.89). Throughout subsequent analyses, the findings for the liberal and conservative definitions again were essentially the same. Therefore, in the subsequent analyses we present findings that used the liberal definition only.
Three-year cancer mortality rate and risk among stage III colon cancer patients diagnosed 1992–1995 (n = 4711), by level of chemotherapy completion and definition of completion
| Liberal definition | Conservative definition | |||||||||
|---|---|---|---|---|---|---|---|---|---|---|
| Chemotherapy | No. (%) | Unadjusted cancer mortality rate, % * | Adjusted RR (95% CI) † | No. (%) | Unadjusted cancer mortality rate, % * | Adjusted RR (95% CI) † | ||||
| None | 2162 (45.9) | 31.0 | 1.00 | 2162 (45.9) | 31.0 | 1.00 | ||||
| Some but incomplete | 569 (12.1) | 30.4 | 0.94 (0.81 to 1.11) | 741 (15.7) | 29.7 | 0.93 (0.80 to 1.07) | ||||
| Complete | 1980 (42.0) | 24.2 | 0.79 (0.69 to 0.89) | 1808 (38.4) | 23.9 | 0.78 (0.68 to 0.88) | ||||
Statistically significant at P ≤.001 (two-sided chi-square test).
RR = relative risk; CI = confidence interval. Adjusted for race, age, sex, marital status, comorbidity score, urban or rural residence location, tumor extent, number of positive lymph nodes, tumor grade, cancer recurrence, registry, and age- and race-specific annual median census tract income.
Among the 3193 patients who received some adjuvant chemotherapy, 2497 (78.2%) received a complete course ( Table 3 ). Patients with the highest rates of complete adjuvant therapy were 75 years or younger, male, married, without hospital admission after surgical resection, and living in a census tract where the median income for their race and age was higher than that of other groups.
Characteristics and rates of adjuvant chemotherapy completion of stage III colon cancer patients receiving adjuvant chemotherapy (n = 3193) *
| Characteristic | % Of patients | Rate of adjuvant chemotherapy completion, % |
|---|---|---|
| Total | 100.0 | 78.2 |
| Demographic | ||
| Age | ||
| 66–70 y | 30.8 | 82.4 † |
| 71–75 y | 33.6 | 80.7 |
| 76–80 y | 24.7 | 74.4 |
| 81–85 y | 9.3 | 67.6 |
| ≥86 y | 1.6 | 64.7 |
| Race | ||
| White | 85.0 | 78.1 |
| African American | 6.1 | 79.5 |
| Hispanic | 3.6 | 77.4 |
| Asian or Pacific Islander | 4.6 | 76.7 |
| Other or unknown | 0.8 | 87.5 |
| Sex | ||
| Female | 50.9 | 74.9 † |
| Male | 49.1 | 81.6 |
| Marital status | ||
| Married | 63.2 | 82.1 † |
| Divorced, separated, or single | 10.7 | 76.0 |
| Widowed | 26.1 | 69.3 |
| Tumor | ||
| T stage | ||
| T1 | 2.1 | 75.0 |
| T2 | 8.9 | 77.2 |
| T3 | 82.3 | 78.2 |
| T4 | 6.7 | 80.3 |
| No. of positive lymph nodes ‡ | ||
| N0 (0 lymph nodes) | 0.3 | 88.9 |
| N1 (1–3 lymph nodes) | 68.3 | 78.1 |
| N2 (4–96 lymph nodes) | 31.4 | 78.2 |
| Tumor grade ‡ | ||
| Well differentiated | 5.1 | 74.4 |
| Moderately differentiated | 67.3 | 78.9 |
| Poorly differentiated | 26.6 | 77.6 |
| Undifferentiated | 1.0 | 80.7 |
| Clinical | ||
| Comorbidity score | ||
| 0 | 73.2 | 79.3 |
| 1 | 15.0 | 76.6 |
| ≥2 | 11.8 | 73.5 |
| Hospital readmission | ||
| 1–6 wk after surgery | ||
| Yes | 8.2 | 66.4 † |
| No | 91.8 | 79.3 |
| ≥7 wk | ||
| Yes | 22.7 | 62.4 † |
| No | 77.3 | 82.8 |
| Environmental | ||
| Census tract–based race- and age-specific median annual household income | ||
| ≤$25 000 | 45.1 | 76.0 § |
| $25 001–$35 000 | 30.9 | 79.3 |
| $35 001–$45 000 | 14.2 | 81.8 |
| ≥$45 001 | 10.0 | 83.7 |
| Residence | ||
| Urban | 82.2 | 78.2 |
| Large rural | 6.2 | 72.4 |
| Small rural | 5.9 | 79.3 |
| Remote rural | 5.7 | 83.4 |
| SEER registry | ||
| Arizona/New Mexico | 3.1 | 71.7 |
| Connecticut | 15.4 | 77.4 |
| Atlanta/rural Georgia | 6.2 | 77.8 |
| Hawaii | 2.5 | 82.7 |
| Iowa | 16.7 | 79.0 |
| Los Angeles | 14.9 | 77.2 |
| Detroit | 16.9 | 77.0 |
| Seattle/Puget Sound | 8.8 | 84.8 |
| San Francisco | 7.6 | 80.5 |
| San Jose | 4.0 | 71.4 |
| Utah | 3.9 | 77.6 |
| Year of diagnosis ‡ | ||
| 1992 | 20.5 | 76.7 |
| 1993 | 19.5 | 76.0 |
| 1994 | 20.3 | 79.8 |
| 1995 | 19.5 | 78.3 |
| 1996 | 20.2 | 80.3 |
Missing values include the following: marital status = 48; positive lymph nodes = 96; grade = 129; race- and age-specific median annual household income by census tract = 274; residence location = 1.
P <.001.
These variables are left out of the final model because they were not statistically significant and did not add to the predictive value of the model.
P = .006.
Most patients received chemotherapy from medical oncologists (95.1%), male physicians (91.0%), physicians aged 40–49 years (54.0%), and physicians in group practice (74.9%) ( Table 4 ). The only physician characteristic associated with chemotherapy completion in these unadjusted analyses was receiving a plurality of their chemotherapy care from a medical oncologist.
Rates of adjuvant chemotherapy completion and distribution of study patients (n = 3193) by treating physician characteristics *
| Treating physician characteristics | No. of physicians | % Of patients | Rate of adjuvant chemotherapy completion, % |
|---|---|---|---|
| Total | 735 | 100.0 | 78.2 |
| Age, y | |||
| <40 | 146 | 15.1 | 77.2 |
| 40–49 | 350 | 54.0 | 78.5 |
| 50–59 | 169 | 24.9 | 80.7 |
| ≥60 | 63 | 6.0 | 79.3 |
| Sex | |||
| Female | 89 | 9.0 | 79.0 |
| Male | 639 | 91.0 | 77.7 |
| Race | |||
| White | 417 | 54.8 | 79.0 |
| African American | 11 | 1.1 | 82.4 |
| Asian/Pacific Islander | 78 | 12.4 | 79.4 |
| Hispanic | 9 | 1.5 | 77.1 |
| Other | 12 | 1.2 | 93.8 |
| Missing | 208 | 29.0 | 75.7 |
| Duration of practice | |||
| 1–15 y | 251 | 27.3 | 77.8 |
| 16–20 y | 147 | 25.7 | 80.5 |
| 21–25 y | 143 | 23.8 | 76.8 |
| ≥26 y | 186 | 23.2 | 80.7 |
| Medical oncologist | |||
| Yes | 616 | 95.1 | 79.3 † |
| No | 118 | 4.9 | 69.5 |
| Volume of chemotherapy patients in diagnosis year ‡ | |||
| 1 | 451 | 28.7 | 76.4 |
| 2 | 147 | 23.1 | 80.4 |
| 3–4 | 85 | 25.6 | 80.2 |
| ≥5 | 52 | 22.7 | 78.5 |
| Practice type | |||
| Solo | 184 | 25.1 | 77.5 |
| Group | 543 | 74.9 | 79.4 |
Missing values include the following: for age and sex, physicians = 7 and patients = 65; for race, physicians = 208 and patients = 956; for years of practice, physicians = 8 and patients = 66; for medical oncologist, physicians = 1 and patients = 46; for solo practice, physicians = 8 and patients = 66; for annual volume of chemotherapy patients in diagnosis year, patients = 45.
P = .004.
Annual volume of patients who are Surveillance, Epidemiology, and End Results (SEER)–Medicare patients cared for by the plurality provider of chemotherapy to the patient.
Multiple logistic regression modeling tested for independent relationships between chemotherapy completion and patients' sociodemographic, clinical, and environmental characteristics and their physicians' characteristics. The most powerful predictor of an incomplete course was rehospitalization, both in weeks 1–6 postoperatively and from week 7 until the end of the treatment ( Fig. 1 and Appendix I ). Age was another statistically significant predictor of chemotherapy completion. Persons aged 71–75 years and those aged 66–70 years were as likely to receive complete adjuvant therapy. However, for those older than 75 years, the likelihood of completing treatment decreased with age. Women and widowed individuals were also statistically significantly less likely to receive a complete course than their counterparts (men and married individuals). Controlling for cancer recurrence did not modify the statistical significance of any independent predictors, and those with cancer recurrence were statistically significantly less likely to complete adjuvant chemotherapy (for adjuvant therapy completion, RR = 0.22, 95% CI = 0.14 to 0.31; Appendix I ) than those without recurrence.
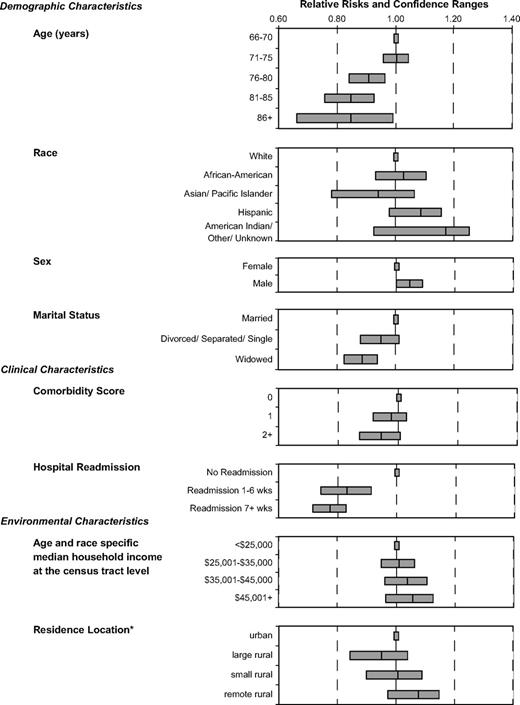
Relative risks of adjuvant chemotherapy completion by selected variables for stage III colon cancer patients. Relative risks are indicated by the central line. Error bars = 95% confidence intervals. *Residence location derived from the Rural-Urban Commuting Area Codes.
Race, tumor characteristics, annual household median income of the patient's residence census tract, and SEER region were not statistically significant independent predictors of adjuvant chemotherapy completion. Several physician characteristics were added to the model, but none was a statistically significant predictor, nor did any add explanatory power to the model. We also explored several interaction terms, most importantly the interaction between rehospitalization, which had the strongest independent relationship with chemotherapy completion, and other variables in the regression model (i.e., age, sex, marital status, and comorbidity). None of the interaction terms added explanatory power to the model, and we found that the negative relationship between rehospitalization and chemotherapy completion was consistent across these variables, except the most elderly (i.e., those aged ≥86 years), who had similar chemotherapy completion rates regardless of rehospitalization status.
D ISCUSSION
This study of Medicare beneficiaries with stage III colon cancer found a high completion rate (78.2%) among those who initiated adjuvant chemotherapy. As anticipated, those who completed adjuvant chemotherapy had improved survival. We also found that, as in the initiation of chemotherapy, both clinical and demographic factors influenced the receipt of a complete course of adjuvant chemotherapy.
Results from Lamont et al. ( 29 ) indicate that the SEER–Medicare data set accurately identifies colon cancer patients receiving any fluorouracil-based adjuvant chemotherapy. We expanded the use of these administrative data to identify patients who completed adjuvant chemotherapy. To accomplish the study's primary aim of identifying factors associated with adjuvant chemotherapy completion, we developed and refined two working measures of adjuvant chemotherapy completion. We then demonstrated validity by analyzing 3-year cancer mortality and showing consistency with the randomized clinical trials of adjuvant chemotherapy for stage III colon cancer. Patients in this study with a complete course of chemotherapy had improved survival compared with those with no chemotherapy, suggesting that we constructed a reasonable measure of chemotherapy completion with these administrative data.
This conclusion assumes that we have adequately controlled for other differences between the chemotherapy completion and noncompletion groups that might influence mortality. Although we did control for such factors (e.g., comorbidity, cancer aggressiveness, and cancer recurrence), the measurement using administrative claims has limitations. These limitations include components of the chemotherapy course that we could not measure, such as the correct agent, dose, and full infusion of doses. Also, our measure may overestimate a complete course because we counted a month or cycle of therapy with only one claim as complete and defined a 5-month course as complete, even during the early 1990s, when 12 months was the recommended course. Thus, confirmation of the validity of our chemotherapy completion variable by means of chart review will be an important next step to measure the sensitivity of administrative chemotherapy claims to capture a complete course of treatment.
Admission to the hospital during the time when chemotherapy was administered was the most powerful predictor of an incomplete course of therapy. The absence of interaction between rehospitalization and factors such as comorbidity and most age groups demonstrates a consistent relationship between rehospitalization and chemotherapy completion and suggests that these rehospitalizations probably represent complications from cancer therapy.
Our finding of lower adjuvant chemotherapy completion rates among female patients is of interest because these results are in accordance with several studies demonstrating greater toxicity of 5-fluorouracil–based chemotherapy in women ( 31 – 34 ) . As with initiation of chemotherapy ( 31 – 33 ) , increasing age and being widowed ( 12 ) remained negatively associated with treatment completion, independent of comorbidity or rehospitalization. Increasing age may be associated with increasing frailty and decreasing tolerance of 5-fluorouracil chemotherapy or with patient or physician belief that toxicity is greater in older patients. Studies of the elderly receiving this therapy are conflicting, with some showing increased toxicity ( 32 , 33 , 35 – 37 ) and others showing less striking effect of toxicity, in particular when 5-fluorouracil was combined with leucovorin instead of levamisole ( 38 – 42 ) . Sundararajan et al. ( 43 ) demonstrated the efficacy of chemotherapy among the elderly and emphasized the importance of better understanding the reasons for the high attrition among older colon cancer patients. Widowed patients, for example, might have fewer resources and less social support than married patients ( 44 – 46 ) , and they may also have increased levels of depression ( 47 ) , which has been associated with less timely pursuit of full cancer treatment ( 48 , 49 ) . To ensure that these patients have an equal chance of completing their chemotherapy course, support services could be provided.
Despite being less likely to initiate adjuvant chemotherapy for stage III colon cancer, African Americans who began therapy were as likely as whites to receive a complete course of therapy. Patients completing therapy, regardless of race, may be self-selected and equally motivated to complete therapy. These findings agree with analysis from one large randomized clinical trial in which African American and white stage II and III colon cancer patients were as likely to finish the prescribed chemotherapy course and were as likely to derive a survival benefit ( 50 ) . Consequently, if we want to increase use of recommended treatment by African American patients with colon cancer, a key point of intervention is after surgery, when the decision to initiate chemotherapy takes place.
Physician characteristics such as age, sex, board certification, number of years in practice, or practice type did not predict chemotherapy completion rates. Physicians' behaviors may be uniform after patients initiate adjuvant chemotherapy. However, factors unrelated to the physicians, such as physical frailty, patient beliefs, or lack of social support, may be more important in explaining chemotherapy completion. It is also possible that we could not identify or measure physician characteristics that might contribute to their patients' chemotherapy completion, such as physician attitudes about chemotherapy in the elderly.
This study's limitations include its reliance on claims data, as noted above, with the inherent absence of potentially important explanatory variables. Better measures of frailty, social support, patient preferences, and physical and emotional resilience might allow better understanding of why some patients do not complete adjuvant chemotherapy. Coding varies across institutions and regions, affecting the validity of both SEER and Medicare data ( 51 ) . Also, this cohort is neither random nor unselected, and because it differs somewhat from the national population of elderly cancer patients, the findings may lack some generalizability ( 52 , 53 ) . There is some selection bias for healthier patients in the cohort because we required patients to be alive for 9 months after diagnosis. We were also unable to evaluate the initiation and completion rates for the non-Medicare patients cared for by the physicians who treated the patients in this cohort. Finally, our exclusion of individuals with missing values from analyses assumes that the nonmissing data are a representative sample of the entire dataset. This missing-at-random assumption is rarely true, although unfortunately there is no way to statistically test this assumption.
As mentioned above, our claims-based chemotherapy completion measure also has limitations. Nevertheless, it was encouraging that the liberal and conservative definitions of the variable produced similar analytic results. Also, although 78.2% of those who initiated therapy in our study completed their course, only 55.3% initiated chemotherapy, resulting in an overall completion rate of 43.2%. Knowledge that the proportion of those receiving a complete adjuvant course might actually be lower than the proportion that we observed simply increases the importance of policies and programs to encourage individuals with stage III colon cancer to obtain the recommended therapy.
This study supports the use of administrative claims data for measuring completion rates of adjuvant chemotherapy for elderly stage III colon cancer patients. The predictors of an incomplete course of adjuvant chemotherapy likely represent the frailty of the individual, the level of social and physical support, and the development of complications during treatment. From these findings, interventions to improve social and physical support throughout the treatment course could be implemented to test whether such support improves rates of chemotherapy completion in elderly colon cancer patients. These interventions would be strengthened by further qualitative study of patient preferences, which would deepen our understanding of those who do not receive adjuvant chemotherapy, those who receive adjuvant chemotherapy but do not complete the recommended course, and those who complete the adjuvant chemotherapy course.
A PPENDIX
Logistic regression models with receipt of a complete course of adjuvant chemotherapy for stage III colon cancer patients as the outcome *
| Final model (n = 3192) | |
|---|---|
| Variable | Relative risk (95% CI) |
| Demographic | |
| Age | |
| 66–70 y | 1.0 (Referent) |
| 71–75 y | 1.00 (0.95 to 1.04) |
| 76–80 y | 0.90 (0.84 to 0.96) |
| 81–85 y | 0.85 (0.76 to 0.93) |
| ≥86 y | 0.84 (0.66 to 0.99) |
| Race | |
| White | 1.0 (Referent) |
| African American | 1.03 (0.93 to 1.10) |
| Asian/Pacific Islander | 0.94 (0.78 to 1.07) |
| Hispanic | 1.08 (0.98 to 1.16) |
| Other/unknown | 1.17 (0.92 to 1.25) |
| Sex | |
| Female | 1.0 (Referent) |
| Male | 1.05 (1.00 to 1.09) |
| Marital status | |
| Married | 1.0 (Referent) |
| Divorced, separated, or single | 0.95 (0.88 to 1.01) |
| Widowed | 0.88 (0.83 to 0.94) |
| Unknown | 1.06 (0.88 to 1.15) |
| Clinical | |
| Comorbidity score | |
| 0 | 1.0 (Referent) |
| 1 | 0.98 (0.92 to 1.03) |
| ≥2 | 0.94 (0.87 to 1.01) |
| Hospital readmission | |
| No readmission within wk 1–6 after surgery | 1.0 (Referent) |
| Readmission within wks 1–6 wk after surgery | 0.84 (0.74 to 0.91) |
| No readmission within wk 7 or later after surgery | 1.0 (Referent) |
| Readmission within wk 7 or later after surgery | 0.77 (0.72 to 0.83) |
| Cancer recurrence | |
| No | 1.0 (Referent) |
| Yes | 0.22 (0.14 to 0.31) |
| Tumor stage | |
| T1 | 1.0 (Referent) |
| T2 | 1.03 (0.84 to 1.16) |
| T3 | 1.07 (0.91 to 1.17) |
| T4 | 1.11 (0.94 to 1.21) |
| Environmental | |
| Census tract–based race- and age-specific median annual household income | |
| ≤$25 000 | 1.0 (Referent) |
| $25 001–$35 000 | 1.01 (0.96 to 1.11) |
| $35 001–$45 000 | 1.04 (0.96 to 1.10) |
| ≥$45 001 | 1.06 (0.97 to 1.13) |
| Missing | 0.91 (0.79 to 1.01) |
| Residence location | |
| Urban residence | 1.0 (Referent) |
| Large rural residences | 0.95 (0.85 to 1.04) |
| Small rural residences | 1.01 (0.90 to 1.09) |
| Remote rural residences | 1.08 (0.98 to 1.15) |
| SEER region | |
| San Francisco | 1.0 (Referent) |
| Arizona/New Mexico registry | 0.91 (0.74 to 1.02) |
| Connecticut registry | 0.99 (0.91 to 1.06) |
| Atlanta/rural Georgia registry | 0.98 (0.87 to 1.06) |
| Hawaii registry | 1.08 (0.96 to 1.15) |
| Iowa registry | 0.99 (0.89 to 1.06) |
| Los Angeles registry | 0.98 (0.89 to 1.05) |
| Detroit registry | 1.02 (0.94 to 1.08) |
| Seattle/Puget Sound registry | 1.05 (0.96 to 1.10) |
| San Jose registry | 0.89 (0.74 to 1.00) |
| Utah registry | 0.95 (0.82 to 1.05) |
Regression controlled for colon cancer recurrence. CI = confidence interval; SEER = Surveillance, Epidemiology, and End Results.
Supported by grant R01CA089544 from the National Cancer Institute, National Institutes of Health, Bethesda, MD. Dr. Dominitz is a core investigator at the Northwest Center for Outcomes Research in Older Adults, a Center of Excellence. The views expressed in this article are those of the authors and do not necessarily represent the views of the National Cancer Institute or the Department of Veterans Affairs.
We thank Yong Cai, Ph.D., and Pam Green, Ph.D., for their expertise and role on the study database design and development team and for their assistance in creating a number of the database variables; Denise Lishner for her assistance in literature review and manuscript editing; Marie Topor and Angela Fahey at Information Management Services, Inc., for their assistance in understanding the linked SEER–Medicare database; and George Wright, Ph.D., for his insight into the analytical questions and his editing of the manuscript.
References
Laurie JA, Moertel CG, Fleming TR, Wieand HS, Leigh JE, Rubin J, et al. Surgical adjuvant therapy of large-bowel carcinoma: an evaluation of levamisole and the combination of levamisole and fluorouracil. The North Central Cancer Treatment Group and the Mayo Clinic.
Moertel CG, Fleming TR, Macdonald JS, Haller DG, Laurie JA, Goodman PJ, et al. Levamisole and fluorouracil for adjuvant therapy of resected colon carcinoma.
Wolmark N, Rockette H, Fisher B, Wickerham DL, Redmond C, Fisher ER, et al. The benefit of leucovorin-modulated fluorouracil as postoperative adjuvant therapy for primary colon cancer: results from National Surgical Adjuvant Breast and Bowel Project protocol C-03.
Moertel CG, Fleming TR, Macdonald JS, Haller DG, Laurie JA, Tangen CM, et al. Fluorouracil plus levamisole as effective adjuvant therapy after resection of stage III colon carcinoma: a final report.
Wolmark N, Rockette H, Mamounas EP, Jones J, Petrelli N, Atkins J. The relative efficacy of 5-FU+leucovorin (FU-LV), 5-FU+levamisole (FU-LEV) and 5-FU+leucovorin+levamisole (FU-LV-LEV) in patients with Ducke's B and C carcinoma of the colon: first report of NSABP C-04 Proc ASCO
Jessup JM, McGinnis LS, Steele GD Jr, Menck HR, Winchester DP. The National Cancer Data Base. Report on colon cancer.
NIH Consensus Conference. Adjuvant therapy for patients with colon and rectal cancer.
Ragland KE, Selvin S, Merrill DW. Black-white differences in stage-specific cancer survival: analysis of seven selected sites.
Hodgson DC, Fuchs CS, Ayanian JZ. Impact of patient and provider characteristics on the treatment and outcomes of colorectal cancer.
Schrag D, Cramer LD, Bach PB, Begg CB. Age and adjuvant chemotherapy use after surgery for stage III colon cancer.
Ayanian JZ, Zaslavsky AM, Fuchs CS, Guadagnoli E, Creech CM, Cress RD, et al. Use of adjuvant chemotherapy and radiation therapy for colorectal cancer in a population-based cohort.
Dominitz JA, Samsa GP, Landsman P, Provenzale D. Race, treatment, and survival among colorectal carcinoma patients in an equal-access medical system.
Roetzheim RG, Pal N, Gonzalez EC, Ferrante JM, Van Durme DJ, Krischer JP. Effects of health insurance and race on colorectal cancer treatments and outcomes.
Tropman SE, Hatzell T, Paskett E, Ricketts T, Cooper MR, Aldrich T. Colon cancer treatment in rural North and South Carolina.
Potosky AL, Harlan LC, Kaplan RS, Johnson KA, Lynch CF. Age, sex, and racial differences in the use of standard adjuvant therapy for colorectal cancer.
Taal BG, Van Tinteren H, Zoetmulder FA. Adjuvant 5FU plus levamisole in colonic or rectal cancer: improved survival in stage II and III.
Potosky AL, Riley GF, Lubitz JD, Mentnech RM, Kessler LG. Potential for cancer related health services research using a linked Medicare-tumor registry database.
Baldwin LM, Adamache W, Klabunde CN, Kenward K, Dahlman C, Warren JL. Linking physician characteristics and Medicare claims data: issues in data availability, quality, and measurement.
Greene FL, Page DL, Fleming ID, Fritz A, Balch CM, Haller DG, et al., editors. AJCC cancer staging manual. 6th ed. New York (NY): Springer;
O'Connell MJ, Laurie JA, Kahn M, Fitzgibbons RJ Jr, Erlichman C, Shepherd L, et al. Prospectively randomized trial of postoperative adjuvant chemotherapy in patients with high-risk colon cancer.
Romano PS, Roos LL, Jollis JG. Adapting a clinical comorbidity index for use with ICD-9-CM administrative data: differing perspectives.
Charlson ME, Pompei P, Ales KL, MacKenzie CR. A new method of classifying prognostic comorbidity in longitudinal studies: development and validation.
Morrill R, Cromartie J, Hart LG. Metropolitan, urban, and rural commuting areas: toward a better depiction of the US settlement system.
WWAMI Rural Health Research Center. Rural-urban commuting area codes (RUCAs). Available at: http://www.fammed.washington.edu/wwamirhrc/ . [Last accessed: December 13,
Schrag D, Cramer LD, Bach PB, Cohen AM, Warren JL, Begg CB. Influence of hospital procedure volume on outcomes following surgery for colon cancer.
Schrag D, Panageas KS, Riedel E, Cramer LD, Guillem JG, Bach PB, et al. Hospital and surgeon procedure volume as predictors of outcome following rectal cancer resection.
Schrag D, Panageas KS, Riedel E, Hsieh L, Bach PB, Guillem JG, et al. Surgeon volume compared to hospital volume as a predictor of outcome following primary colon cancer resection.
Warren JL, Harlan LC, Fahey A, Virnig BA, Freeman JL, Klabunde CN, et al. Utility of the SEER-Medicare data to identify chemotherapy use.
Lamont EB, Lauderdale DS, Schilsky RL, Christakis NA. Construct validity of Medicare chemotherapy claims: the case of 5FU.
Zhang J, Yu KF. What's the relative risk? A method of correcting the odds ratio in cohort studies of common outcomes.
Sloan JA, Goldberg RM, Sargent DJ, Vargas-Chanes D, Nair S, Cha SS, et al. Women experience greater toxicity with fluorouracil-based chemotherapy for colorectal cancer.
Stein BN, Petrelli NJ, Douglass HO, Driscoll DL, Arcangeli G, Meropol NJ. Age and sex are independent predictors of 5-fluorouracil toxicity. Analysis of a large scale phase III trial.
Zalcberg J, Kerr D, Seymour L, Palmer M. Haematological and non-haematological toxicity after 5-fluorouracil and leucovorin in patients with advanced colorectal cancer is significantly associated with gender, increasing age and cycle number. Tomudex International Study Group.
Chansky K, Benedetti J, Macdonald JS. Differences in toxicity between men and women treated with 5-fluorouracil therapy for colorectal carcinoma.
Popescu RA, Norman A, Ross PJ, Parikh B, Cunningham D. Adjuvant or palliative chemotherapy for colorectal cancer in patients 70 years or older.
Bower M, Asbury R, Kramer Z, Pandya K, Bennett JM. Adjuvant chemotherapy for colorectal cancer in the elderly: population-based experience.
Toxicity of fluorouracil in patients with advanced colorectal cancer: effect of administration schedule and prognostic factors. Meta-Analysis Group In Cancer.
Sargent DJ, Goldberg RM, Jacobson SD, Macdonald JS, Labianca R, Haller DG, et al. A pooled analysis of adjuvant chemotherapy for resected colon cancer in elderly patients.
Steinberg J, Erlichman C, Gadalla T, Fine S, Wong A. Prognostic factors in patients with metastatic colorectal cancer receiving 5-fluorouracil and folinic acid.
Chiara S, Nobile MT, Vincenti M, Lionetto R, Gozza A, Barzacchi MC, et al. Advanced colorectal cancer in the elderly: results of consecutive trials with 5-fluorouracil-based chemotherapy.
Aschele C, Guglielmi A, Tixi LM, Bolli E, Mori AM, Lionetto R, et al. Adjuvant treatment of colorectal cancer in the elderly.
Begg CB, Carbone PP. Clinical trials and drug toxicity in the elderly. The experience of the Eastern Cooperative Oncology Group.
Sundararajan V, Mitra N, Jacobson JS, Grann VR, Heitjan DF, Neugut AI. Survival associated with 5-fluorouracil-based adjuvant chemotherapy among elderly patients with node-positive colon cancer.
Iwashyna TJ, Christakis NA. Marriage, widowhood, and health-care use.
Frey P, Stinson T, Siston A, Knight SJ, Ferdman E, Traynor A, et al. Lack of caregivers limits use of outpatient hematopoietic stem cell transplant program.
Weinrich S, Coker AL, Weinrich M, Eleazer GP, Greene FL. Predictors of Pap smear screening in socioeconomically disadvantaged elderly women.
Turner MJ, Killian TS, Cain R. Life course transitions and depressive symptoms among women in midlife.
Robertson R, Campbell NC, Smith S, Donnan PT, Sullivan F, Duffy R, et al. Factors influencing time from presentation to treatment of colorectal and breast cancer in urban and rural areas.
Colleoni M, Mandala M, Peruzzotti G, Robertson C, Bredart A, Goldhirsch A. Depression and degree of acceptance of adjuvant cytotoxic drugs.
McCollum AD, Catalano PJ, Haller DG, Mayer RJ, Macdonald JS, Benson AB 3rd, et al. Outcomes and toxicity in African-American and Caucasian patients in a randomized adjuvant chemotherapy trial for colon cancer.
Zippin C, Lum D. Study of completeness of the surveillance, epidemiology and end results (SEER) program case ascertainment by hospital size and casefinding source.
Warren JL, Klabunde CN, Schrag D, Bach PB, Riley GF. Overview of the SEER-Medicare data: content, research applications, and generalizability to the United States elderly population.

