


Abstract
Background: Diabetes has been associated with an increased risk of colorectal cancer in most, but not all, studies. Findings have also been inconclusive with regard to sex and subsite in the colorectum. To resolve these inconsistencies, we conducted a meta-analysis of published data on the association between diabetes and the incidence and mortality of colorectal cancer. Methods: We identified studies by a literature search of Medline from January 1, 1966, through July 31, 2005, and by searching the reference lists of pertinent articles. Summary relative risks (RRs) with 95% confidence intervals (CIs) were calculated with a random-effects model. All statistical tests were two-sided. Results: Analysis of 15 studies (six case–control and nine cohort studies), including 2 593 935 participants, found that diabetes was associated with an increased risk of colorectal cancer, compared with no diabetes (summary RR of colorectal cancer incidence = 1.30, 95% CI = 1.20 to 1.40), without heterogeneity between studies ( Pheterogeneity = .21). These results were consistent between case–control and cohort studies and between studies conducted in the United States and in Europe. The association between diabetes and colorectal cancer incidence did not differ statistically significantly by sex (summary RR among women = 1.33, 95% CI = 1.23 to 1.44; summary RR among men = 1.29, 95% CI = 1.15 to 1.44; Pheterogeneity = .26) or by cancer subsite (summary RR for colon = 1.43, 95% CI = 1.28 to 1.60; summary RR for rectum = 1.33, 95% CI = 1.14 to 1.54; Pheterogeneity = .42). Diabetes was positively associated with colorectal cancer mortality (summary RR = 1.26, 95% CI = 1.05 to 1.50), but there was evidence for heterogeneity between studies ( Pheterogeneity = .04). Conclusions: Our findings strongly support a relationship between diabetes and increased risk of colon and rectal cancer in both women and men.
Type 2 diabetes mellitus and colorectal cancer are major causes of morbidity and mortality in the United States and other Western countries ( 1 – 3 ) . Dietary and lifestyle risk factors for developing insulin resistance and type 2 diabetes, such as Western diet, physical inactivity, and obesity, have also been linked to an increased risk of colon cancer ( 4 – 7 ) . On the basis of the overlapping risk factors, it has been hypothesized that diabetes itself may be a risk factor for colon cancer ( 8 ) .
Although epidemiologic studies of the relationship of diabetes with the risk of colorectal cancer are not entirely consistent, most studies are compatible with a positive association. In some studies, the association appeared to be stronger for colon cancer than for rectal cancer ( 9 – 12 ) , or the association was observed only in women ( 10 , 13 , 14 ) . The interpretation of these findings, however, has been hampered by the low frequency at which both diseases occur in the same individual, which results in the lack of statistical power to adequately analyze this association.
To provide a quantitative assessment of the association between diabetes and risk of colorectal cancer, we conducted a meta-analysis of case–control and cohort studies. We also evaluated whether the association varied by sex and by cancer subsite (colon versus rectum and proximal colon versus distal colon).
M ATERIALS AND M ETHODS
Search Strategy
We identified studies by a literature search of the Medline database (from January 1, 1966, through July 31, 2005) with the following medical subject heading terms and/or text words: “diabetes mellitus,” “diabetes,” “colorectal cancer,” “colorectal neoplasm,” “colon cancer,” “colon neoplasm,” “rectal cancer,” and “rectal neoplasm.” We also reviewed reference lists of the identified publications for additional pertinent studies. No language restrictions were imposed.
Inclusion and Exclusion Criteria
The 25 studies considered for inclusion in this meta-analysis were case–control and cohort studies on the association between diabetes and the incidence of or mortality from colon, rectal, or colorectal cancer ( 9 – 33 ) . Studies were excluded if they provided only an estimate of effect with no means to calculate a confidence interval or if the estimates were not adjusted by age. When there were multiple publications from the same population or cohort, only data from the most recent report were included. We excluded three candidate studies ( 15 – 17 ) because of overlapping publications and one study ( 18 ) that reported only crude data that were not adjusted by age.
Data Extraction
The data that we extracted included publication data (the first author's last name, year of publication, and country of population studied), study design, number of exposed and unexposed subjects, control source (in case–control studies), follow-up period (for cohort studies), type of diabetes (type 1 or 2), risk estimates with their corresponding confidence intervals, and variables controlled for by matching or in the multivariable model. From each study, we extracted the risk estimates that reflected the greatest degree of control for potential confounders.
Statistical Analysis
We divided epidemiologic studies of the relationship between diabetes and colorectal cancer risk into three general types according to measure of relative risk (RR): case–control studies (odds ratio), cohort studies (incidence and/or mortality rate ratio), and cohort studies with an external comparison group (standardized incidence and/or mortality ratio). We conducted separate meta-analyses of colorectal cancer incidence and mortality. The measure of effect of interest is the relative risk. Because colorectal cancer is rare, the odds ratio in case–control studies and rate ratios in cohort studies yield similar estimates of relative risk ( 34 ) . Cohort studies that reported standardized incidence/mortality ratio were analyzed separately.
Summary relative risk estimates with their corresponding 95% confidence intervals (CIs) were derived with the method of DerSimonian and Laird ( 35 ) by use of the assumptions of a random effects model, which incorporates between-study variability. We calculated a pooled relative risk and its corresponding 95% confidence interval for studies that reported only sex- and/or subsite-specific relative risks. Statistical heterogeneity between studies was evaluated with Cochran's Q test and the I2 statistic ( 36 ) . Publication bias was assessed by constructing a funnel plot ( 37 ) , by Begg's adjusted rank correlation test, and by Egger's regression asymmetry test ( 38 ) .
For case–control studies and cohort studies that reported incidence rate ratios, we conducted subgroup meta-analyses to examine potential sources of heterogeneity, including study design, type of control subjects in case–control studies, sex, cancer subsite, and duration of follow-up for cohort studies. Statistical analyses were carried out with Stata, version 8.0 (Stata Corp, College Station, TX). P values that were less than .05 were considered statistically significant. All statistical tests were two-sided.
R ESULTS
Study Characteristics
Twenty-one independent studies met the predefined inclusion criteria. Of these 21 studies, six were case–control studies ( 10 , 13 , 19 , 26 , 27 , 33 ) ( Table 1 ), 11 were cohort studies that used incidence and/or mortality rate ratios as the measure of relative risk ( 9 , 11 , 14 , 20 , 22 – 24 , 28 , 30 – 32 ) ( Table 2 ), and four were cohort studies that used standardized incidence and/or mortality ratio as the measure of relative risk ( 12 , 21 , 25 , 29 ) ( Table 3 ). Eleven studies were conducted in the United States, eight in Europe, one in Australia, and one in Korea. Of the 15 cohort studies, incident colorectal cancer was the outcome in seven, mortality from colon, rectal, or colorectal cancer was the outcome in three, and colorectal cancer incidence and mortality were reported in five. In the primary meta-analysis of diabetes and colorectal cancer incidence, we included all six case–control studies ( 10 , 13 , 19 , 26 , 27 , 33 ) and the nine cohort studies that reported incidence rate ratios ( 9 , 11 , 14 , 20 , 22 , 24 , 28 , 30 , 31 ) . These 15 studies included a total of 2 593 935 participants. The three cohort studies ( 12 , 21 , 25 ) that reported standardized incidence ratio were analyzed separately. For the meta-analysis of diabetes and colorectal cancer mortality, we included the six cohort studies that reported mortality rate ratio ( 11 , 20 , 23 , 28 , 30 , 32 ) . These six studies enrolled a total of 2 523 580 participants.
Characteristics of case–control studies of diabetes and colorectal cancer incidence *
| Authors, year (ref. No.), country | No. of case patients by cancer site (subsites) | No. of control subjects (selection methods) | Type of diabetes | RR † (95% CI), sex, cancer site | Controlled variables |
|---|---|---|---|---|---|
| O'Mara et al. 1985 ( 26 ) , United States | 1286 CRC (612 CC, 674 RC) | 4620 (hospital patients without cancer) | Type 1 and 2 (self-reported) | 1.16 (0.86 to 1.57) ठwomen + men, CRC | Age |
| 1.29 (0.84 to 1.96) ठwomen + men, CC | |||||
| 1.05 (0.68 to 1.62) ठwomen + men, RC | |||||
| 1.15 (0.76 to 1.74) ठwomen, CRC | |||||
| 1.18 (0.76 to 1.83) ठmen, CRC | |||||
| Kune et al, 1988 ( 27 ) , Australia | 714 CRC | 727 (population controls matched by age and sex) | Type 1 and 2 (self-reported) | 1.02 (0.62 to 1.67) women + men, CRC | Age |
| 0.75 (0.35 to 1.61) women, CRC | |||||
| 1.28 (0.67 to 2.47) men, CRC | |||||
| Le Marchand et al., 1997 ( 10 ) , United States | 1192 CRC (825 CC, 350 RC ‖ ) | 1192 (population controls matched by age, sex, and ethnicity) | Type 1 and 2 (self-reported) | 1.4 (1.0 to 2.1) § women + men, CRC | Age, BMI, physical activity, family history of colorectal cancer, smoking, and intakes of total energy, egg, dietary fiber, calcium, and alcohol |
| 1.6 (1.0 to 2.5) § women + men, CC | |||||
| 1.1 (0.6 to 1.8) § women + men, PCC | |||||
| 2.2 (1.3 to 3.5) § women + men, DCC | |||||
| 1.1 (0.5 to 2.6) § women + men, RC | |||||
| 1.8 (1.1 to 2.8) women, CRC | |||||
| 1.2 (0.80 to 1.7) men, CRC | |||||
| La Vecchia et al., 1997 ( 33 ) , Italy | 1953 CRC (1225 CC, 728 RC) | 4154 (hospital patients without cancer and gastrointestinal disease) | Type 1 and 2 (self-reported) | 1.3 (1.0 to 1.6) women + men, CRC | Age, sex, BMI, physical activity, area of residence, education, family history of colorectal cancer, and intakes of total energy, fat, dietary fiber, and alcohol |
| 1.2 (0.8 to 1.6) women + men, CC | |||||
| 1.5 (1.1 to 2.2) women + men, RC | |||||
| 1.2 (0.8 to 1.8) women, CRC | |||||
| 1.4 (1.0 to 1.9) men, CRC | |||||
| Levi et al., 2002 ( 13 ) , Switzerland | 287 CRC | 550 (hospital patients without cancer) | Type 1 and 2 (self-reported) | 1.75 (0.95 to 3.24) women + men, CRC | Age, sex, BMI, education, family history of colorectal cancer, smoking, alcohol intake |
| 3.56 (1.05 to 12.11) women, CRC | |||||
| 1.30 (0.63 to 2.68) men, CRC | |||||
| Yang et al., 2005 ( 19 ) , United Kingdom | 10 447 CRC (6862 CC, 3585 RC) | 104 429 (population controls matched by age, enrollment date, and duration of follow-up) | Type 2 (medical records) | 1.42 (1.25 to 1.62) women + men, CRC | Age, year of enrollment |
| 1.45 (1.25 to 1.70) women + men, CC | |||||
| 1.34 (1.08 to 1.68) women + men, RC | |||||
| 1.38 (1.14 to 1.67) women, CRC | |||||
| 1.36 (1.16 to 1.61) men, CRC |
RR = relative risk; CI = confidence interval; RC = rectal cancer; CRC = colorectal cancer; CC = colon cancer; PCC = proximal colon cancer; DCC = distal colon cancer; BMI = body mass index; ref. = reference.
Measure of relative risk is an odds ratio.
CIs were calculated from raw data reported in the article.
RR (and its 95% CI) was derived by pooling the sex- and/or subsite-specific RRs.
The numbers of colon and rectal cancer cases do not add up to the total number of colorectal cancer cases because of missing information on subsite.
Characteristics of cohort studies of diabetes and colorectal cancer incidence and mortality *
| Authors, year (ref. No.), country (follow-up period) | Study population | RR † (95% CI) sex, cancer site (No. of case patients) | Controlled variables |
|---|---|---|---|
| Colorectal cancer incidence | |||
| Steenland et al., 1995 ( 22 ) , United States (1971–1987) | National Health and Nutrition Survey I | 1.41 (0.79 to 2.52) ‡ women + men, CRC (176) | Age, BMI, physical activity, income, smoking, alcohol intake |
| Exposed group: 522 women and men with self-reported DM (type 1 and 2) | 1.40 (0.64 to 3.10) women, CRC (82) | ||
| Comparison group: 12 532 women and men without self-reported DM | 1.43 (0.61 to 3.31) men, CRC (94) | ||
| Will et al., 1998 ( 20 ) , United States (1959–1972) | Cancer Prevention Study I | 1.24 (0.87 to 1.53) ‡ women + men, CRC (7224) | Age, BMI, physical activity, education, race, family history of colorectal cancer, history of constipation, smoking, aspirin use, and intakes of fruits, vegetables, cereals, meat, milk, coffee, tea, and alcohol |
| Exposed group: 8258 women and 7229 men with self-reported DM (type 1 and 2) | 1.16 (0.87 to 1.53) women, CRC (4006) | ||
| Comparison group: 502 592 women and 345 620 men without self-reported DM | 1.30 (1.03 to 1.65) men, CRC (3218) | ||
| Hu et al., 1999 ( 11 ) , United States (1976–1994) | Nurses' Health Study | 1.43 (1.10 to 1.87) women, CRC (892) | Age, BMI, physical activity, family history of colorectal cancer, smoking, menopausal status, HRT use, aspirin use, multivitamin use, and intakes of red meat and alcohol |
| Exposed group: 7069 women with self-reported DM (Type 2) § | 1.49 (1.09 to 2.06) women, CC (607) | ||
| Comparison group: 111 003 women without self-reported DM | 1.64 (1.04 to 2.60) women, PCC (275) | ||
| 1.38 (0.88 to 2.15) women, DCC (332) | |||
| 1.11 (0.56 to 2.21) women, RC (176) | |||
| Schoen et al., 1999 ( 24 ) , United States (1989–1996) | Cardiovascular Health Study | 1.4 (0.8 to 2.4) women + men, CRC (61) | Age |
| Exposed group: 638 women and 546 men with DM defined by blood glucose, medication history, and the results of oral glucose load | 1.1 (0.5 to 2.6) women, CRC (25) | ||
| Comparison group: 1508 women and 1106 men without DM | 1.6 (0.8 to 3.1) men, CRC (36) | ||
| Nilsen and Vatten, 2001 ( 14 ) , Norway (1984–1996) | Nord-Trondelag Health Survey | 1.05 (0.50 to 2.40) ‡ women + men, CRC (726) | Age, BMI, physical activity, education, marital status |
| Exposed group: 8202 person–years for women and 6510 person-years for men, self-reported DM (type 1 and 2) | 1.55 (1.04 to 2.31) women, CRC (367) | ||
| Comparison group: 376 715 person-years for women and 357 person-years for men | 0.66 (0.35 to 1.24) men, CRC (359) | ||
| Khaw et al., 2004 ( 28 ) , United Kingdom (1995–2002) | European Prospective Investigation into Cancer Norfolk Study | 2.78 (1.10 to 7.00) women + men, CRC (67) | Age, BMI, smoking |
| Exposed group: 72 women and 149 men with self-reported DM (type 1 and 2) | 1.71 (0.23 to 12.64) women, CRC (31) | ||
| Comparison group: 5088 women and 4296 men without self-reported DM | 3.37 (1.17 to 9.72) men, CRC (36) | ||
| Limburg et al., 2005 ( 9 ) , United States (1986–1999) | Iowa Women's Health Study | 1.4 (1.1 to 1.8) women, CRC (870) | Age, BMI, and intakes of total energy, calcium, and vitamin E |
| Exposed group: 1900 women with self-reported DM (type 2) § | 1.5 (0.9 to 2.6) ‡ women, CC (661) | ||
| Comparison group: 33 072 women without self-reported DM | 1.9 (1.3 to 2.6) women, PCC (402) | ||
| 1.1 (0.6 to 1.8) women, DCC (259) | |||
| 0.8 (0.4 to 1.6) women, RC (196) | |||
| Jee et al., 2005 ( 30 ) , Korea (1993–2002) | National Health Insurance Corp | 1.13 (1.03 to 1.23) ‡ women + men, CRC (NA) | Age, smoking, and alcohol |
| Exposed group: 21 056 women and 41 868 men with fasting serum glucose level of ≥7.0mmol/L or self-reported treatment for DM | 1.17 (0.98 to 1.40) women, CRC (NA) | ||
| Comparison group: 447 559 Korean women and 787 902 Korean men without DM | 1.11 (1.00 to 1.24) men, CRC (NA) | ||
| Larsson et al., 2005 ( 31 ) , Sweden (1998–2004) | Cohort of Swedish Men | 1.49 (1.14 to 1.96) men, CRC (411) | Age, BMI, physical activity, education, family history of colorectal cancer, smoking, multivitamin use, aspirin use, and intakes of fruits, vegetables, dairy foods, and red meat |
| Exposed group: 3847 men with self-reported DM (type 2) § | 1.53 (1.02 to 2.29) men, CC (190) | ||
| Comparison group: 41 703 men without self-reported DM | 1.68 (0.98 to 2.86) men, PCC (98) | ||
| 1.40 (0.76 to 2.59) men, DCC (92) | |||
| 1.79 (1.18 to 2.73) men, RC (156) | |||
| Colorectal cancer mortality | |||
| Smith et al., 1992 ( 23 ) , United States (1967–1987) | Whitehall Study | 0.62 (0.09 to 4.47) men, colon (113) ‖ | Age |
| Exposed group: 224 men with plasma glucose levels of ≥200 mg/100 mL | |||
| Comparison group: 17 051 men with plasma glucose levels of <96 mg/100 mL | |||
| Will et al., 1998 ( 20 ) , United States (1959–1972) | Cancer Prevention Study I | 1.02 (0.78 to 1.32) ‡ women + men, CRC (NA) | Age, BMI, physical activity, education, race, family history of colorectal cancer, history of constipation, smoking, aspirin use, and intakes of fruits, vegetables, cereals, meat, milk, coffee, tea, and alcohol |
| Exposed group: 8258 women and 7229 men with self-reported DM (type 1 and 2) | 1.07 (0.71 to 1.62) women, CRC (NA) | ||
| Comparison group: 502 592 women and 345 620 men without self-reported DM | 0.98 (0.70 to 1.37) men, CRC (NA) | ||
| Hu et al., 1999 ( 11 ) , United States (1976–1994) | Nurses' Health Study | 1.43 (1.10 to 1.87) women, CRC (892) | Age, BMI, physical activity, family history ofcolorectal cancer, smoking, menopausal status, HRT use, aspirin use, multivitamin use, and intakes of red meat and alcohol |
| Exposed group: 7069 women with self-reported DM (type 2) § | |||
| Comparison group: 111 003 women without self-reported DM | |||
| Coughlin et al., 2004 ( 32 ) , United States (1982–1998) | Cancer Prevention Study II | 1.19 (1.09 to 1.31) ‡ women + men, CRC (7777) | Age, BMI, physical activity, education, race, family history of colorectal cancer, smoking, HRT use, and intakes of red meat, citrus fruits and juices, vegetables, and alcohol |
| Exposed group: 26 186 women and 26 617 men with self-reported DM (type 1 and 2) | 1.20 (1.05 to 1.38) ‡ women, CRC (3681) | ||
| Comparison group: 586 135 women and 441 305 men without self-reported DM | 1.18 (1.05 to 1.35) ‡ men, CRC (4096) | ||
| Khaw et al., 2004 ( 28 ) , United Kingdom (1995–2002) | European Prospective Investigation into Cancer Norfolk Study | 3.60 (0.81 to 15.9) women + men, CRC (22) | Age, BMI, smoking |
| Exposed group: 72 women and 149 men with self-reported DM (type 1 and 2) | |||
| Comparison group: 5088 women and 4296 men without self-reported DM | |||
| Jee et al., 2005 ( 30 ) , Korea (1993–2002) | National Health Insurance Corp | 1.23 (1.05 to 1.45) ‡ women + men, CRC (NA) | Age, smoking, and alcohol |
| Exposed group: 21 056 women and 41 868 men with fasting serum glucose level of ≥7.0mmol/L or self-reported treatment for DM | 1.11 (0.81 to 1.51) women, CRC (NA) | ||
| Comparison group: 447 559 Korean women and 787 902 Korean men without DM | 1.28 (1.06 to 1.55) men, CRC (NA) |
RR = relative risk; CI = confidence interval; CRC = colorectal cancer; CC = colon cancer; RC = rectal cancer; PCC = proximal colon cancer; DCC = distal colon cancer; DM = diabetes mellitus; BMI = body mass index; HRT, hormone replacement therapy; NA = not available; ref. = reference.
The measure of RR is a rate ratio (hazard ratio) in all studies, except for one study ( 11 ) in which the RR is a pooled odds ratio.
The RR (and its 95% CI) was derived by pooling the sex- and/or subsite-specific RRs.
Excluding participants who had diabetes before age 30 years.
RR estimates are not available for rectal cancer because there were no cases of rectal cancer among men with diabetes.
Characteristics of cohort studies of diabetes and colorectal cancer based on standardized incidence/mortality ratio *
| Authors, year (ref. No.), country (follow-up period) | Study population | RR † (95% CI) sex, cancer site (No. of case patients among diabetics) | Controlled variables |
|---|---|---|---|
| Colorectal cancer incidence | |||
| Raggozzino et al., 1982 ( 25 ) , United States (1945–1969) | Exposed group: 1135 DM patients (type 2) | 1.3 (0.8 to 1.9) women + men, CRC (22) | Age, sex |
| Comparison group: Rochester population | 1.1 (0.5 to 2.1) women, CRC (10) | ||
| 1.4 (0.7 to 2.5) men, CRC (12) | |||
| Wideroff et al., 1997 ( 12 ) , Denmark (1977–1989) | Exposed group: 109 581 nationwide subjects with a discharge diagnosis of DM (type 1 and 2) | 1.12 (1.00 to 1.25) ‡ women + men, CRC (1275) | Age |
| 1.19 (1.01 to 1.40) ‡ women + men, CC (873) | |||
| Comparison group: Danish population | 1.05 (0.95 to 1.16) ‡ women + men, RC (402) | ||
| 1.07 (0.98 to 1.16) ‡ women, CRC (609) | |||
| 1.20 (1.02 to 1.42) ‡ men, CRC (666) | |||
| Weiderpass et al., 1997 ( 21 ), Sweden (1965–1983) | Exposed group: 153 852 nationwide subjects with a discharge diagnosis of DM (type 1 and 2) | 1.32 (1.18 to 1.47) ‡ women + men, CRC (943) | Age |
| 1.39 (1.31 to 1.49) women + men, CC (943) | |||
| Comparison group: Swedish population | 1.42 (1.16 to 1.74) ‡ women + men, PCC (491) | ||
| 1.30 (1.16 to 1.45) ‡ women + men, DCC (315) | |||
| 1.24 (1.13 to 1.35) women + men, RC (492) | |||
| 1.26 (0.98 to 1.62) ‡ women, CRC (724) | |||
| 1.37 (1.37 to 1.47) ‡ men, CRC (711) | |||
| Colorectal cancer mortality | |||
| Kessler, 1970 ( 29 ), United States (1930–1959) | Exposed group: 21 447 DM patients (type 2) | 0.81 (0.59 to 1.08) § women + men, RC (45) | Age, sex |
| Comparison group: Massachusetts population | |||
| Weiderpass et al., 1997 ( 21 ), Sweden (1965–1983) | Exposed group: 153 852 nationwide subjects with a discharge diagnosis of DM (type 1 and 2) | 1.54 (1.44 to 1.65) ‡ women + men, CRC (NA) | Age |
| 1.46 (1.32 to 1.61) ‡ women, CRC (NA) | |||
| Comparison group: Swedish population | 1.62 (1.50 to 1.75) ‡ men, CRC (NA) |
RR = relative risk; CI = confidence interval; CRC = colorectal cancer; CC = colon cancer; RC = rectal cancer; PCC = proximal colon cancer; DCC = distal colon cancer; DM = diabetes mellitus; NA = not available; ref. = reference.
The measure of RR is a standardized incidence (or mortality) ratio.
The RR (and its 95% CI) was derived by pooling the sex- and/or subsite-specific RRs.
The P value reported in the article was used to calculate the CI.
Colorectal Cancer Incidence
Individual study results and the overall summary results for the six case–control and nine cohort studies of diabetes and colorectal cancer incidence are shown in Fig. 1 . Eight of these 15 studies found a statistically significant positive association between diabetes and colorectal cancer incidence (range of individual RRs = 1.02 to 2.78; summary RR for all 15 studies = 1.30, 95% CI = 1.20 to 1.40). No heterogeneity among studies was found ( Q = 17.9; Pheterogeneity = .21; I2 = 21.8%). In a sensitivity analysis in which one study at a time was excluded and the rest were analyzed, we detected a statistically significant positive association between diabetes and colorectal cancer incidence (range of summary RRs = 1.25 to 1.36; the lower limit of the 95% CI never crossed 1.0).
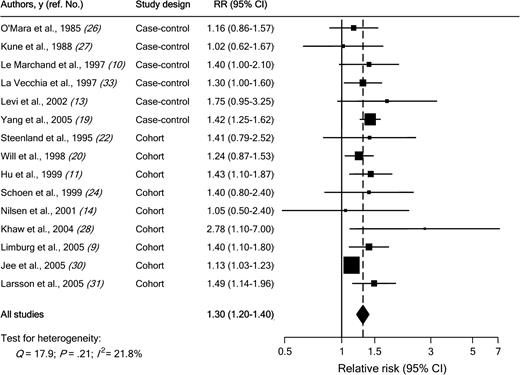
Association between diabetes and colorectal cancer incidence in case–control and cohort studies. Studies are ordered by study design and publication year. RR = relative risk; CI = confidence interval; squares = study-specific RR estimate (size of the square reflects the study-specific statistical weight, i.e., the inverse of the variance); horizontal lines = 95% CI; diamond = summary relative risk estimate and its corresponding 95% CI. All statistical tests were two-sided. Statistical heterogeneity between studies was assessed with Cochran's Q test.
We then conducted subgroup meta-analyses by study design, geographical area, sex, cancer subsite, and duration of follow-up ( Table 4 ). The association between diabetes and colorectal cancer incidence was somewhat stronger in case–control studies (summary RR = 1.36; 95% CI = 1.23 to 1.50) than in cohort studies (summary RR = 1.29; 95% CI = 1.16 to 1.43), but there was no heterogeneity among study types ( Pheterogeneity = .08). In case–control studies, the source of control subjects did not statistically significantly affect the magnitude of the association. Results were consistent for studies conducted in the United States and in Europe. Results were also consistent for studies in women (summary RR among women = 1.33, 95% CI = 1.23 to 1.44) and in men (summary RR among men = 1.29, 95% CI = 1.15 to 1.44) ( Pheterogeneity = .26). For cancer subsites, the summary estimate was similar for colon cancer (RR = 1.43, 95% CI = 1.28 to 1.60) and for rectal cancer (RR = 1.33, 95% CI = 1.14 to 1.54) ( Pheterogeneity = .42). There was also no statistically significant difference between subsites in the colon (i.e., proximal colon versus distal colon). Stratifying cohort studies by duration of follow-up resulted in no evidence of heterogeneity. Finally, the summary estimate was similar ( Pheterogeneity = .73) for studies (four case–control and four cohort) published before 2000 (RR = 1.28, 95% CI = 1.16 to 1.42) and for studies (two case–control and five cohort) published after 2000 (RR = 1.36, 95% CI = 1.17 to 1.58).
Summary relative risk (RR) estimates and 95% confidence intervals (CIs) for case–control and cohort studies of the association between diabetes and colorectal cancer incidence by study design, geographical area, sex, cancer subsite, and duration of follow-up
| Between studies | Between subgroups | |||||||||
|---|---|---|---|---|---|---|---|---|---|---|
| Subgroup | No. of studies | Summary RR (95% CI) | Q | Pheterogeneity | I2 statistics, % * | Q | Pheterogeneity | |||
| Study design | ||||||||||
| Case–control | 6 | 1.36 (1.23 to 1.50) | 3.60 | .61 | 0 | |||||
| Population-based | 3 | 1.39 (1.24 to 1.57) | 1.60 | .45 | 0 | |||||
| Hospital-based | 3 | 1.28 (1.07 to 1.53) | 1.42 | .49 | 0 | 0.58 | .45 † | |||
| Cohort studies | 9 | 1.29 (1.16 to 1.43) | 11.22 | .19 | 16.1 | 3.06 | .08 ‡ | |||
| Geographical area | ||||||||||
| United States | 7 | 1.31 (1.18 to 1.46) | 1.92 | .93 | 0 | |||||
| Europe | 6 | 1.42 (1.28 to 1.57) | 3.70 | .59 | 0 | 1.04 | .31 | |||
| Sex | ||||||||||
| Women | 14 | 1.33 (1.23 to 1.44) | 12.15 | .52 | 0 | |||||
| Men | 13 | 1.29 (1.15 to 1.44) | 18.60 | .10 | 35.5 | 1.25 | .26 | |||
| Cancer subsites | ||||||||||
| Colon | 7 | 1.43 (1.28 to 1.60) | 1.68 | .95 | 0 | |||||
| Proximal colon | 4 | 1.64 (1.31 to 2.05) | 2.73 | .44 | 0 | |||||
| Distal colon | 4 | 1.49 (1.12 to 1.99) | 3.70 | .30 | 19 | 0.28 | .60 § | |||
| Rectum | 7 | 1.33 (1.14 to 1.54) | 6.08 | .41 | 1.3 | 0.66 | .42 ‖ | |||
| Duration of follow-up | ||||||||||
| ≤10 y | 4 | 1.35 (1.04 to 1.76) | 7.50 | .06 | 60.0 | |||||
| >10 y | 5 | 1.32 (1.17 to 1.50) | 1.36 | .85 | 0 | 2.44 | .12 | |||
Percentage variation due to heterogeneity between studies.
Test for heterogeneity between population-based and hospital-based case–control studies. All statistical tests were two-sided.
Test for heterogeneity between case–control and cohort studies.
Test for heterogeneity between proximal colon and distal colon cancer.
Test for heterogeneity between colon and rectal cancer.
Physical activity and body mass index are potentially the most important known confounders of the positive association between diabetes and colorectal cancer risk. When we restricted the meta-analysis to studies that controlled for these variables ( 10 , 11 , 14 , 20 , 22 , 31 , 33 ) , we found a positive association between diabetes and colorectal cancer (summary RR = 1.34, 95% CI = 1.20 to 1.49), without statistically significant heterogeneity among studies ( Q = 2.05; Pheterogeneity = 0.91). Three studies reported both age-adjusted and multivariable-adjusted relative risks ( 11 , 20 , 31 ) . When we restricted the meta-analysis to those studies, the positive association between diabetes and colorectal cancer remained (summary RR adjusted for age only = 1.34, 95% CI = 1.12 to 1.60), and the estimate was identical to estimates that were adjusted for physical activity and body mass index, as well as other potential confounders (RR = 1.34, 95% CI = 1.18 to 1.53), indicating a lack of confounding.
A positive association was observed between diabetes and colorectal cancer incidence in the three cohort studies that reported standardized incidence ratios (summary RR = 1.22, 95% CI = 1.07 to 1.40) ( Table 3 ). The test for heterogeneity among these three studies was not statistically significant ( Q = 4.52; Pheterogeneity = .10; I2 = 55.8%).
Colorectal Cancer Mortality
Of six cohort studies of diabetes and mortality from colon ( 23 ) or colorectal ( 11 , 20 , 28 , 30 , 32 ) cancer, three ( 11 , 30 , 32 ) reported a statistically significant positive association, and one ( 28 ) observed a nonstatistically significant 3.6-fold (RR = 3.60, 95% CI = 0.81 to 15.89) increase in colorectal cancer risk associated with diabetes ( Table 2 ). When all six studies were analyzed, a positive association between diabetes and mortality from colorectal cancer was found (summary RR = 1.26, 95% CI = 1.05 to 1.50). However, there was statistically significant heterogeneity among studies ( Q = 11.59; Pheterogeneity = .04; I 2 = 56.8%). A sensitivity analysis identified the study by Hu et al. ( 11 ) as contributing most to the heterogeneity. In an analysis excluding this study, the association between diabetes and mortality from colorectal cancer was weaker (summary RR = 1.19, 95% CI = 1.10 to 1.28), and the test for heterogeneity was not statistically significant ( Q = 4.03; Pheterogeneity = .40; I 2 = 0.6%). The association between diabetes and colorectal cancer mortality did not differ statistically significantly by sex ( Q = 0.10; Pheterogeneity = .75).
Of two cohort studies that reported standardized mortality ratios ( 21 , 29 ) ( Table 3 ), one ( 21 ) reported a statistically significant approximately 1.5-fold increased risk of death from colorectal cancer among diabetic patients. The other study found no statistically significant association between diabetes and rectal cancer mortality ( 29 ) .
Publication Bias
There was no funnel plot asymmetry for the association between diabetes and colorectal cancer risk (data not shown). P values for Begg's adjusted rank correlation test and Egger's regression asymmetry test were .79 and .28, respectively, indicating a low probability of publication bias.
D ISCUSSION
Findings from this meta-analysis indicate that individuals with diabetes have an approximately 30% increased relative risk of developing colorectal cancer compared with nondiabetic individuals. The results were consistent for case–control and cohort studies and for studies carried out in the United States and in Europe. The association was observed in both women and men and for all subsites in the colorectum.
Our analysis must be interpreted in the context of the limitations of the available data. Most of the studies did not distinguish between type 1 and type 2 diabetes. Because type 1 diabetes [which accounts for 5% to 10% of all diagnosed cases of diabetes ( 1 ) ] may not be related to colorectal cancer ( 12 , 39 ) , the magnitude of the association between diabetes and colorectal cancer risk may have been slightly underestimated. In addition, because diabetes is an underdiagnosed disease, some degree of misclassification of exposure to diabetes is likely to have occurred. Such nondifferential misclassification would also tend to attenuate the true relationship between diabetes and colorectal cancer. As in any meta-analysis, the possibility of publication bias is of concern. However, the results obtained from funnel plot analysis and formal statistical tests did not provide evidence for such bias.
Type 2 diabetes and colorectal cancer share similar risk factors, including physical inactivity and obesity ( 8 ) . Thus, the observed increased risk of colorectal cancer associated with a history of diabetes may reflect confounding by these risk factors. However, a positive association between diabetes and colorectal cancer risk remained when we limited the meta-analysis to studies that controlled for physical activity and body mass index (summary RR = 1.34, 95% CI = 1.20 to 1.49).
Discrepancies among studies investigating the relationship of diabetes with colorectal cancer risk according to sex and cancer subsite may be attributable to small sample sizes that resulted in insufficient statistical power to detect some relationships in the individual studies. Because this meta-analysis included a large number of studies, we could assess the association according to sex and cancer subsite with high precision.
A relationship between diabetes and risk of colorectal cancer is biologically plausible. Type 2 diabetes is characterized by increased insulin concentrations during the early stage of the disease. Hyperinsulinemia ( 8 ) or factors related to insulin resistance, such as hyperglycemia or hypertriglyceridemia ( 40 ) , have been associated with colorectal carcinogenesis. Insulin can stimulate cell proliferation through a minor pathway that involves the direct activation of the insulin receptor or insulin-like growth factor (IGF)-I receptor and a major pathway that acts through the inhibition of IGF binding proteins (in particular, IGFBP-1 and IGFBP-2), which may result in increased free and bioavailable IGF-I ( 41 ) . An important role of insulin and IGF-I in colorectal carcinogenesis is supported by in vitro studies, animal models, and epidemiologic studies ( 41 – 44 ) . Epidemiologic studies of circulating concentrations of insulin, C-peptide (a marker of insulin secretion), or IGF-I have shown two- to threefold increased risks of colorectal cancer for individuals in the highest exposure categories, compared with those in the lowest exposure categories ( 24 , 45 – 48 ) . Furthermore, a recent study reported that chronic insulin therapy was associated with a statistically significant increase in colorectal cancer risk among patients with type 2 diabetes ( 49 ) . Other mechanisms through which diabetes may be linked with the risk of colorectal cancer include slower bowel transit times in patients with diabetes, which could contribute to the increased exposure of colonic mucosa to potential carcinogens, and elevated concentrations of fecal bile acids associated with increased blood glucose and triglyceride concentrations ( 20 , 50 – 52 ) . Fecal bile acids have been shown to promote colorectal cancer in animal models ( 53 ) .
Our results have important clinical and public health implications. In the United States, about 8% of adults have diabetes ( 54 ) , and it has been predicted that the number of Americans with diagnosed diabetes will increase 165%, from 11 million in 2000 (prevalence of 4.0%) to 29 million in 2050 (prevalence of 7.2%) ( 55 ) . Colorectal cancer is the second leading cause of cancer death in the United States and other Western countries ( 2 , 3 ) . The prevalence of diabetes will probably increase as a result of the growing obesity epidemic, and thus this disease may contribute to the development of additional cases of colorectal cancers.
In summary, the results from this meta-analysis strongly support an association between diabetes and increased risk of colon and rectal cancer in both women and men. These findings provide evidence for a role of hyperinsulinemia or factors related to insulin resistance in colorectal carcinogenesis.
Supported by grants from the Swedish Research Council/Longitudinal Studies and the Swedish Cancer Foundation.
References
Engelgau MM, Geiss LS, Saaddine JB, Boyle JP, Benjamin SM, Gregg EW, et al. The evolving diabetes burden in the United States.
Jemal A, Murray T, Ward E, Samuels A, Tiwari RC, Ghafoor A, et al. Cancer statistics, 2005.
Parkin DM, Bray F, Ferlay J, Pisani P. Global cancer statistics, 2002.
Schulze MB, Hu FB. Primary prevention of diabetes: what can be done and how much can be prevented?
Fung TT, Schulze M, Manson JE, Willett WC, Hu FB. Dietary patterns, meat intake, and the risk of type 2 diabetes in women.
World Cancer Research Fund/American Institute for Cancer Research (WCRF/AICR). Food, nutrition and the prevention of cancer: a global perspective. Washington (DC): WCRF/AICR;
Giovannucci E. Modifiable risk factors for colon cancer.
Limburg PJ, Anderson KE, Johnson TW, Jacobs DR, Jr., Lazovich D, Hong CP, et al. Diabetes mellitus and subsite-specific colorectal cancer risks in the Iowa Women's Health Study.
Le Marchand L, Wilkens LR, Kolonel LN, Hankin JH, Lyu LC. Associations of sedentary lifestyle, obesity, smoking, alcohol use, and diabetes with the risk of colorectal cancer.
Hu FB, Manson JE, Liu S, Hunter D, Colditz GA, Michels KB, et al. Prospective study of adult onset diabetes mellitus (type 2) and risk of colorectal cancer in women.
Wideroff L, Gridley G, Mellemkjaer L, Chow WH, Linet M, Keehn S, et al. Cancer incidence in a population-based cohort of patients hospitalized with diabetes mellitus in Denmark.
Levi F, Pasche C, Lucchini F, La Vecchia C. Diabetes mellitus, family history, and colorectal cancer.
Nilsen TI, Vatten LJ. Prospective study of colorectal cancer risk and physical activity, diabetes, blood glucose and BMI: exploring the hyperinsulinaemia hypothesis.
Adami HO, McLaughlin J, Ekbom A, Berne C, Silverman D, Hacker D, et al. Cancer risk in patients with diabetes mellitus.
La Vecchia C, Negri E, Franceschi S, D'Avanzo B, Boyle P. A case-control study of diabetes mellitus and cancer risk.
La Vecchia C, D'Avanzo B, Negri E, Franceschi S. History of selected diseases and the risk of colorectal cancer.
Williams JC, Walsh DA, Jackson JF. Colon carcinoma and diabetes mellitus.
Yang YX, Hennessy S, Lewis JD. Type 2 diabetes mellitus and the risk of colorectal cancer.
Will JC, Galuska DA, Vinicor F, Calle EE. Colorectal cancer: another complication of diabetes mellitus?
Weiderpass E, Gridley G, Nyren O, Ekbom A, Persson I, Adami HO. Diabetes mellitus and risk of large bowel cancer.
Steenland K, Nowlin S, Palu S. Cancer incidence in the National Health and Nutrition Survey I. Follow-up data: diabetes, cholesterol, pulse and physical activity.
Smith GD, Egger M, Shipley MJ, Marmot MG. Post-challenge glucose concentration, impaired glucose tolerance, diabetes, and cancer mortality in men.
Schoen RE, Tangen CM, Kuller LH, Burke GL, Cushman M, Tracy RP, et al. Increased blood glucose and insulin, body size, and incident colorectal cancer.
Ragozzino M, Melton LJ, 3rd, Chu CP, Palumbo PJ. Subsequent cancer risk in the incidence cohort of Rochester, Minnesota, residents with diabetes mellitus.
O'Mara BA, Byers T, Schoenfeld E. Diabetes mellitus and cancer risk: a multisite case-control study.
Kune GA, Kune S, Watson LF. Colorectal cancer risk, chronic illnesses, operations, and medications: case control results from the Melbourne Colorectal Cancer Study.
Khaw KT, Wareham N, Bingham S, Luben R, Welch A, Day N. Preliminary communication: glycated hemoglobin, diabetes, and incident colorectal cancer in men and women: a prospective analysis from the European prospective investigation into cancer-Norfolk study.
Jee SH, Ohrr H, Sull JW, Yun JE, Ji M, Samet JM. Fasting serum glucose level and cancer risk in Korean men and women.
Larsson SC, Giovannucci E, Wolk A. Diabetes and colorectal cancer incidence in the cohort of Swedish men.
Coughlin SS, Calle EE, Teras LR, Petrelli J, Thun MJ. Diabetes mellitus as a predictor of cancer mortality in a large cohort of US adults.
La Vecchia C, Negri E, Decarli A, Franceschi S. Diabetes mellitus and colorectal cancer risk.
Greenland S. Quantitative methods in the review of epidemiologic literature.
DerSimonian R, Laird N. Meta-analysis in clinical trials.
Higgins JP, Thompson SG. Quantifying heterogeneity in a meta-analysis.
Egger M, Davey Smith G, Schneider M, Minder C. Bias in meta-analysis detected by a simple, graphical test.
Egger M, Smith GD, Altman DG. Systematic Reviews in Health Care: Meta-Analysis in Context. London (UK): BMJ Publishing Group;
Zendehdel K, Nyren O, Ostenson CG, Adami HO, Ekbom A, Ye W. Cancer incidence in patients with type 1 diabetes mellitus: a population-based cohort study in Sweden.
McKeown-Eyssen G. Epidemiology of colorectal cancer revisited: are serum triglycerides and/or plasma glucose associated with risk?
Giovannucci E. Insulin, insulin-like growth factors and colon cancer: a review of the evidence.
Sandhu MS, Dunger DB, Giovannucci EL. Insulin, insulin-like growth factor-I (IGF-I), IGF binding proteins, their biologic interactions, and colorectal cancer.
Wu Y, Yakar S, Zhao L, Hennighausen L, LeRoith D. Circulating insulin-like growth factor-I levels regulate colon cancer growth and metastasis.
Renehan AG, Zwahlen M, Minder C, O'Dwyer ST, Shalet SM, Egger M. Insulin-like growth factor (IGF)-I, IGF binding protein-3, and cancer risk: systematic review and meta-regression analysis.
Ma J, Pollak MN, Giovannucci E, Chan JM, Tao Y, Hennekens CH, et al. Prospective study of colorectal cancer risk in men and plasma levels of insulin-like growth factor (IGF)-I and IGF-binding protein-3.
Kaaks R, Toniolo P, Akhmedkhanov A, Lukanova A, Biessy C, Dechaud H, et al. Serum C-peptide, insulin-like growth factor (IGF)-I, IGF-binding proteins, and colorectal cancer risk in women.
Ma J, Giovannucci E, Pollak M, Leavitt A, Tao Y, Gaziano JM, et al. A prospective study of plasma C-peptide and colorectal cancer risk in men.
Giovannucci E, Pollak MN, Platz EA, Willett WC, Stampfer MJ, Majeed N, et al. A prospective study of plasma insulin-like growth factor-1 and binding protein-3 and risk of colorectal neoplasia in women.
Yang YX, Hennessy S, Lewis JD. Insulin therapy and colorectal cancer risk among type 2 diabetes mellitus patients.
Rafter JJ, Eng VW, Furrer R, Medline A, Bruce WR. Effects of calcium and pH on the mucosal damage produced by deoxycholic acid in the rat colon.
Yang R, Arem R, Chan L. Gastrointestinal tract complications of diabetes mellitus. Pathophysiology and management.
Stadler J, Yeung KS, Furrer R, Marcon N, Himal HS, Bruce WR. Proliferative activity of rectal mucosa and soluble fecal bile acids in patients with normal colons and in patients with colonic polyps or cancer.
Debruyne PR, Bruyneel EA, Li X, Zimber A, Gespach C, Mareel MM. The role of bile acids in carcinogenesis.
Mokdad AH, Ford ES, Bowman BA, Dietz WH, Vinicor F, Bales VS, et al. Prevalence of obesity, diabetes, and obesity-related health risk factors, 2001.

