


Abstract
Background: Nonreported and selectively reported information and the use of different definitions may introduce biases in the literature of prognostic factors. We probed these biases in a meta-analysis of a prognostic factor for head and neck squamous cell cancer (HNSCC) mortality that has drawn wide attention—the status of the tumor suppressor protein TP53. Methods: We compared results of meta-analyses that included published data plus unpublished data retrieved from investigators; published data; and only published data indexed with “survival” or “mortality” in MEDLINE/EMBASE, with or without standardized definitions. We also evaluated whether previously published meta-analyses on mortality predictors for various malignancies addressed issues of retrieval and standardized information. All statistical tests were two-sided. Results: For the 18 studies with 1364 patients that included published and indexed data, we obtained a highly statistically significant association between TP53 status and mortality. When we used the definitions preferred by each publication, the association was stronger (risk ratio [RR] = 1.38, 95% confidence interval [CI] = 1.13 to 1.67; P = .001) than when we standardized definitions (RR = 1.27, 95% CI = 1.06 to 1.53; P = .011). The addition of 13 studies with 1028 subjects that included published but not indexed data reduced the observed association (RR = 1.23, 95% CI = 1.03 to 1.47; P = .02). Finally, when we obtained data from investigators (11 studies with 996 patients) and analyzed it with all other data, statistical significance was lost (RR = 1.16, 95% CI = 0.99 to 1.35; P = .06). Among 18 published meta-analyses of 37 cancer prognostic factors, 13 (72%) did not use standardized definitions and 16 (89%) did not retrieve additional information. Conclusions: Selective reporting may spuriously inflate the importance of postulated prognostic factors for various malignancies. We recommend that meta-analyses thereof should maximize retrieval of information and standardize definitions.
An enormous amount of data is produced on prognostic factors of outcomes for cancer and other diseases ( 1 ) , and the pace is accelerating as a result of discovery-driven high-throughput research ( 2 ) . Summarizing and making sense of this literature through meta-analyses is a daunting task ( 3 , 4 ) . Although meta-analyses of prognostic factors are being undertaken and published at an increasing rate ( 4 ) , there are several unanswered issues about the validity of the literature on prognostic factors and about the problems that underlie prognostic evidence. In contrast to randomized trials, for which the process of conducting systematic reviews is standardized and major biases are well recognized ( 5 ) , data on prognostic factors poses poorly understood challenges for those conducting meta-analyses. For example, information on a specific prognostic relationship may be presented as a key indexed finding in one study, appear in the “small print” (i.e., is incidentally mentioned) in another study, not be presented at all in yet another study, or be mentioned but not presented with data. Moreover, investigators define outcomes, predictors, and analyses in various nonstandardized ways ( 6 ) , and this may introduce biases depending on which information is synthesized.
The purpose of this study was to assemble empirical evidence on the importance of selective reporting biases for prognostic evidence in malignant diseases. First, we focused on a prognostic factor for head and neck cancer that has received extensive attention in the biomedical literature—the status of the tumor suppressor protein TP53. We evaluated whether the indexed, published, and unpublished data gave different results and whether the use of standardized definitions instead of those preferred by each publication influenced the final inferences. Second, we examined whether issues of retrieval of information and standardization of definitions and analyses are adequately addressed across published meta-analyses of prognostic factors for cancer mortality.
S TUDIES AND M ETHODS
Meta-Analysis Design and Search for Data
The tumor suppressor protein TP53 and its gene have been widely studied as regulators of carcinogenesis and cancer outcomes ( 7 ) . A PubMed search showed 31 899 entries for “p53” or “TP53” as of April 25, 2004. We performed a meta-analysis of the available evidence on whether TP53 status (as measured with various immunohistochemical or molecular techniques) is a predictor of mortality in patients with head and neck squamous cell cancer (HNSCC), a cancer for which TP53 status has been frequently analyzed. We examined whether meta-analysis results would differ depending on the level of inclusion and standardization of eligible data. The following three levels of information search were considered.
First, we tried to identify studies with any allusion to TP53 status and HNSCC that were indexed with “mortality” OR “survival” in MEDLINE and EMBASE (last update April 2004, search terms for the malignancy and prognostic factor available on request from the authors). We classified the identified studies as the “published and indexed data.” We then removed the “mortality” OR “survival” limiting terms to obtain studies classified as all the “published data.” Finally, when a report suggested that mortality data had been collected, but no usable data were available in the publication, we communicated with the primary investigators. When there was no response within 2 months, a second communication attempt was made. We classified the additional recovered information as the “retrieved” data. When studies overlapped, only the largest available study was retained.
Definitions and Standardizations
We used a priori defined standardized outcomes and definitions for TP53 status to avoid subjective selection of outcomes and definitions across studies as much as possible ( 6 ) . The level of TP53, measured by immunohistochemistry, is associated only modestly with TP53 mutations detected by reverse transcription–polymerase chain reaction (RT-PCR) in exons 4–9 ( 8 ) . When a study provided data for both methods, we used the immunohistochemistry information. For immunohistochemistry, we defined a TP53-positive status as nuclear staining in at least 10% of tumor cells or at least moderate staining in qualitative scales. This cutoff point is the same as the one that we used in a previous meta-analysis of TP53 status ( 9 ) . If different definitions of a TP53-positive status were used, we accepted the cutoff closest to 10%. In sensitivity analyses, we used RT-PCR data instead of immunohistochemistry data, when both were available.
The main outcome was all-cause mortality. To avoid bias that may arise, if investigators select the follow-up period to report according to the results at each follow-up period, we standardized definitions to include 24 months of follow-up in all studies (because most studies had at least this much follow-up) and categorized patients as dead within 24 months or as surviving for at least 24 months. Cox models that allow estimation of a hazard ratio for the whole follow-up are not routinely presented in this TP53 literature. The very few patients censored before 2 years were counted as alive. In sensitivity analyses, these patients were excluded.
As a secondary outcome, we also recorded published information on the presence of lymph node metastasis at the time of diagnosis, which is the strongest known predictor of outcome in HNSCC ( 10 ) . Lymph node metastasis was defined as the involvement of at least one lymph node.
Data Extraction
Two authors (PK and KL) extracted data independently and reached a consensus on the classification of all data. For each report, we recorded author name, journal and year of publication, country of origin, sample size, staging, demographics, tumor location, antibodies and cutoff points for immunohistochemistry analyses, exons analyzed with RT-PCR, definition of a TP53-positive status, prospective versus retrospective design, and use of blinding during the analysis. We created 2 × 2 contingency tables for 2-year survival compared with death according to TP53 status and for the presence of lymph node metastasis compared with its absence, according to TP53 status. For indexed studies, we also recorded the mortality data as defined by each published report.
Analysis
Risk ratios (RRs) for 2-year mortality associated with TP53 status were combined for the various levels of information examined (published and indexed, all published, and all published and retrieved) ( 11 ) . For indexed studies, we also estimated risk ratios for mortality according to the definitions preferred by each report. Between-study heterogeneity was assessed with the Q statistic ( 12 ) . Fixed effects models, such as the Mantel–Haenszel model ( 12 ) , assume that differences between studies are due to chance. Random effects models, such as the DerSimonian and Laird model ( 12 ) , allow that results may differ genuinely between studies. Unless stated otherwise, random effects estimates are reported. We also performed subgroup analyses for blinding (theoretically, blinded studies are less likely to be biased), type of design (prospective, retrospective, or unclear), geographic area (North America, Europe, or Asia), type of measurement, sample size, and source of data. Heterogeneity between subgroups was quantified with the I2 statistic ( 13 ) , which takes values from 0% to 100%. The larger the value, the larger the heterogeneity; values of 75% or higher indicate very large heterogeneity.
For each group of studies, we examined whether results differed between small and larger studies. This result may be a hint for publication bias or other biases ( 14 ) . We assessed inverted funnel plots that show the natural logarithm of the risk ratio on the horizontal axis and the inverse standard error on the vertical axis ( 15 ) , their regression equivalent ( 14 ) , and the Begg–Mazumdar correlation test (considered statistically significant for P <.10) ( 16 ) . We also evaluated whether adjusted estimates were available from the primary studies for data synthesis and synthesized the available data on the relationship between TP53 status and lymph node status. Analyses were conducted with the SPSS package of programs, version 11.0 (SPSS, Chicago, IL), and Meta-Analyst (Joseph Lau, Boston, MA). All P values are from two-sided statistical tests.
Evaluation of Published Meta-Analyses of Prognostic Factors
Selective reporting biases may arise for any prognostic factor. To assess the extent to which these problems are appreciated and properly handled in published meta-analyses on cancer prognostic factors, we identified relevant English-language meta-analyses in MEDLINE with a search algorithm based on “prognosis” AND “meta-analysis” AND “cancer.” We accepted meta-analyses that examined potential prognostic factors for any malignancy and examined their association with mortality. For each eligible meta-analysis, three independent investigators recorded the author, year, journal of publication, malignancy and prognostic factors addressed, and whether the summary results were statistically significant ( P <.05) for each prognostic factor, as reported by the meta-analysis authors. We also collected information on limiting terms posed to the literature search, efforts made to retrieve additional information (unpublished data or data not presented in sufficient enough detail for quantitative synthesis), mentions to the amount of data not amenable to quantitative synthesis, efforts made to use standardized and consistent definitions for mortality and for the prognostic factor across studies, performance of tests for potential publication bias, and use of adjusted and/or unadjusted effects for data synthesis.
Contributions
The original idea for biases in prognostic factor meta-analyses was generated by J.P.A.I., and the protocol was developed by J.P.A.I. and P.A.K. and commented on by K.T.L. P.A.K. and K.T.L. performed the data extraction on the TP53 meta-analysis, and all three authors performed data extraction on the published meta-analyses. P.A.K. and J.P.A.I. performed the statistical analyses, and all three authors interpreted the findings. P.A.K. and J.P.A.I. drafted the final manuscript, and K.T.L. revised it critically.
R ESULTS
Eligible and Available Data for TP53 Meta-Analysis
We examined the full text of 116 reports addressing TP53 status in HNSCC. Of those, 20 were excluded because they overlapped with another study. Another 17 studies with 1342 patients had apparently collected no clinical data on either lymph node involvement or mortality. Of the 79 potentially eligible studies ( 17 – 95 ) with some clinical information and with 5854 patients ( Table 1 ), 64 with 4824 patients clearly alluded to mortality information. For 22 of 64 studies, even though we contacted their primary investigators, we could not retrieve any additional data. Seventeen of the primary investigators did not reply at all; and five responded and stated that they were not able to retrieve the raw data. Thus, only 42 studies with 3388 patients could eventually be analyzed, including 18 studies with 1364 patients that had readily available published data and survival or mortality as an indexed term; 13 with 1028 patients that had readily available published data that were not appropriately indexed; and 11 studies with 996 patients that had data retrieved from the investigators ( Fig. 1 and Table 2 ).
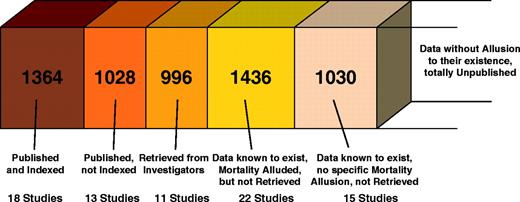
Number of patients for each type of data considered in the meta-analysis of TP53 status and the risk of death in patients with head and neck squamous cell cancer.
Characteristics of eligible studies *
| Author [year–country (ref)] | No. analyzed | Age, y | % Male | % Clinical staging I + II | Location, No. oropharynx/No. larynx | Method(s) | Antibody | IHC cutoff point, % | Exons | Blinding |
|---|---|---|---|---|---|---|---|---|---|---|
| Sauter [1992–USA ( 17 ) ] | 20 | 59 Md | NR | NR | 20/0 | IHC | 1801 | NR | — | Yes |
| Leedy [1994–USA ( 18 ) ] † | 56 | 60 Mn | 70 | NR | 56/0 | IHC | NR | >10 | — | NR |
| Frank [1994–USA ( 19 ) ] | 43 | NR | NR | 17 | 43/0 | IHC | DO7 | >10 | — | NR |
| Ahomadegbe [1995–France ( 20 ) ] | 65 | NR | NR | NR | 58/17 | PCR | — | — | 5–9 | NR |
| Wilson [1995–UK ( 21 ) ] † | 99 | NR | NR | NR | NR | IHC | DO7 | >5 | — | NR |
| Bradford [1995–USA ( 22 ) ] | 178 | NR | NR | NR | 0/178 | IHC | BP53–12 | >20 | — | Yes |
| Nadal [1995–Spain ( 23 ) ] | 88 | 61 Mn | 95 | 24 | 0/88 | IHC | 1801 | >0 | — | NR |
| Spafford [1996–USA ( 24 ) ] | 66 | 60 Mn | NR | 41 | 0/66 | IHC | DO7 | ‡ | — | Yes |
| Caminero [1996–Spain ( 25 ) ] | 106 | 55 Md | NR | 8 | 106/0 | IHC | M-7001 | >10 | — | NR |
| Chiba [1996–Japan ( 26 ) ] | 38 | 63 Mn | 71 | 50 | 38/0 | PCR | — | — | 5–8 | NR |
| Awwad [1996–UK ( 27 ) ] | 79 | 64 Mn | 65 | 61 | 39/40 | IHC | DO7 | >0 | — | Yes |
| Koch [1996–USA ( 28 ) ] § | 110 | 63 Mn | 81 | 17 | 66/44 | PCR | — | — | 5–9 | Yes |
| Kokoska [1996–USA ( 29 ) ] | 70 | NR | 84 | NR | 0/70 | IHC | DO1 | Moderate | — | Yes |
| Kusama [1996–Japan ( 30 ) ] † | 57 | 64 Mn | 72 | 58 | 57/0 | IHC, PCR | 1801 | >5 | 5–8 | NR |
| Haraf [1996–USA ( 31 ) ] | 48 | 61 Md | 53 | 29 | 48/0 | PCR | — | — | 5–9 | NR |
| Dunphy [1997–USA ( 32 ) ] | 36 | 57 Md | NR | 0 | 32/4 | IHC | BP53 | >25 | — | NR |
| Hirvikoski [1997–Finland ( 33 ) ] | 99 | 63 Md | 97 | 38 | 0/99 | IHC | DO7 | >20 | — | Yes |
| Cutilli [1997–Italy ( 34 ) ] | 15 | NR | NR | 0 | 15/0 | PCR | — | — | NR | NR |
| Veneroni [1997–Italy ( 35 ) ] ∥ | 36 | NR | 83 | NR | 36/0 | IHC | 1801 | >10 | — | NR |
| Sommer [1997–Norway ( 36 ) ] ∥ | 64 | 64 Md | 70 | 44 | 64/0 | IHC | DO7 | >10 | — | Yes |
| Olshan [1997–USA ( 37 ) ] | 27 | 72 Mn | 74 | NR | 16/11 | PCR | — | — | 4–9 | NR |
| Stoll [1998–Germany ( 38 ) ] | 107 | 57 Mn | 78 | NR | 107/0 | IHC | Ab6 | Moderate | — | NR |
| Tatemoto [1998–Japan ( 39 ) ] | 150 | 67 Mn | 61 | 38 | 150/0 | IHC | DO7 | >10 | — | NR |
| Hegde [1998–USA ( 40 ) ] | 39 | NR | 77 | 35 | 31/8 | PCR | — | — | 5–9 | Yes |
| Mineta [1998–Sweden ( 41 ) ] | 77 | NR | NR | 39 | 77/0 | IHC, PCR | DO7 | >10 | 5–8 | NR |
| Pruneri [1998–Italy ( 42 ) ] | 149 | 61 Mn | 97 | 55 | 0/149 | IHC | CM1 | >10 | — | NR |
| Erber [1998–Germany ( 43 ) ] | 86 | 54 Md | 85 | 24 | 66/20 | PCR | — | — | 5–8 | NR |
| Riethdorf [1998–Germany ( 44 ) ] ∥ | 99 | 58 Md | NR | NR | 97/2 | PCR | — | — | 5–8 | Yes |
| Kaur [1998–India ( 45 ) ] † | 120 | NR | 68 | NR | 120/0 | IHC | 1801/421 | >5 | — | NR |
| Ma [1998–Germany ( 46 ) ] † | 50 | 58 Md | 78 | 13 § | 42/6 ¶ | IHC, PCR | DO7 | >5 | 5–9 | NR |
| Gandour-Edwards [1998–USA ( 47 ) ] | 50 | NR | NR | NR | 33/17 | IHC | DO1 | >10 | — | NR |
| Maeda [1998–Japan ( 48 ) ] | 45 | 64 Mn | 62 | 42 | 45/0 | PCR | — | — | 5–8 | Yes |
| Jin [1998–USA ( 49 ) ] | 82 | 61 Mn | 90 | NR | 0/82 | IHC | DO7 | >75 | — | Yes |
| Lera [1998–Spain ( 50 ) ] | 57 | 59 Md | 100 | 16 | 0/57 | IHC | BP23 | >25 | — | NR |
| Pai [1998–Canada ( 51 ) ] † | 86 | 64 Md | 86 | NR | 0/86 | IHC | DO7 | >10 | — | NR |
| Ibrahim [1999–Norway ( 52 ) ] † | 21 | 66 Mn | 64 | 51 | 21/0 | IHC | DO7 | >10 | — | NR |
| Yao [1999–Japan ( 53 ) ] | 52 | NR | NR | 77 | 52/0 | IHC | DO7 | >5 | — | NR |
| Unal [1999–Turkey ( 54 ) ] † | 70 | 52 Mn | 54 | 54 | 70/0 | IHC | 1801 | >0 | — | Yes |
| Haas [1999–Germany ( 55 ) ] | 43 | 57 Mn | NR | NR | 36/7 | IHC | BP53–11 | >10 | — | Yes |
| Pulkkinen [1999–Finland ( 56 ) ] ∥ | 66 | 65 Md | 90 | NR | 0/68 | IHC | DO7 | >10 | — | Yes |
| Taylor [1999–USA ( 57 ) ] § | 85 | NR | NR | NR | NR | IHC | DO7 | >30 | — | Yes |
| Welkoborsky [1999–Germany ( 58 ) ] | 42 | 57 Mn | 67 | 100 | 42/0 | IHC | 1801 | >25 | — | NR |
| Chomchai [1999–USA ( 59 ) ] | 45 | NR | 69 | 18 | 0/45 | PCR | — | — | 5–8 | NR |
| Chiang [1999–Taiwan ( 60 ) ] | 81 | NR | 85 | 36 | 81/0 | IHC | DO7 | >10 | — | NR |
| Xie [1999–Norway ( 61 ) ] | 85 | 63 Mn | 60 | NR | 85/0 | IHC | DO7 | >5 | — | Yes |
| Fujieda [1999–Japan ( 62 ) ] | 60 | 64 Mn | 66 | 30 | 60/0 | IHC | DO7 | >10 | — | Yes |
| Kurokawa [1999–Japan ( 63 ) ] ∥ | 51 | NR | NR | NR | 51/0 | IHC | NR | >10 | — | NR |
| Narayana [2000–USA ( 64 ) ] ∥ | 102 | 64 Md | 96 | 100 | 0/102 | IHC | DO7 | >10 | — | Yes |
| Obata [2000–Japan ( 65 ) ] | 38 | 65 Mn | 95 | 21 | 38/0 | PCR | — | — | 4–9 | NR |
| Jeannon [2000–UK ( 66 ) ] | 60 | 66 Mn | 83 | NR | 0/60 | IHC | DO7 | >25 | — | NR |
| Cabelguenne [2000–France ( 67 ) ] † | 106 | 59 Mn | 87 | 27 | 106/0 | PCR | — | — | 4–9 | Yes |
| Riedel [2000–Germany ( 68 ) ] † | 33 | 58 Mn | 79 | 12 | 24/9 | PCR | — | — | 5–9 | NR |
| Shima [2000–Japan ( 69 ) ] † | 46 | 65 Md | 70 | NR | 46/0 | PCR | — | — | 5–8 | NR |
| Jackel [2000–Germany ( 70 ) ] | 68 | 62 Mn | 91 | 56 | 0/68 | IHC | DO1 | >100 ‡ | — | Yes |
| Ostwald [2000–Germany ( 71 ) ] | 94 | NR | 81 | NR | 94/0 | PCR | — | — | 5–8 | NR |
| Grabenbauer (2000–Germany ( 72 ) ) | 84 | 53 Md | 79 | NR | 84/0 | IHC | DO7 | >10 | — | NR |
| Lam [2000–Hong Kong ( 73 ) ] | 56 | 64 Mn | 80 | 39 | 56/0 | IHC | DO7 | >5 | — | NR |
| Gonzales-Moles [2001–Spain ( 74 ) ] | 78 | 63 Mn | NR | 58 | 78/0 | IHC | BP53–12 | >25 | — | NR |
| Friedman [2001–USA ( 75 ) ] | 69 | 61 Mn | 86 | 0 | 0/69 | IHC | Ab-6 | >10 | — | Yes |
| Kerdpon [2001–Thailand ( 76 ) ] † | 106 | NR | 75 | 40 | 106/0 | IHC | DO7 | >10 | — | Yes |
| Kazkayasi [2001–Turkey ( 77 ) ] | 27 | 56 Mn | 92 | 41 | 0/27 | IHC | NR | >10 | — | NR |
| Koelbl [2001–Germany ( 78 ) ] | 88 | 54 Mn | 84 | NR | 88/0 | IHC | DO7 | >20 | — | NR |
| Alsner [2001–Denmark ( 79 ) ] | 114 | NR | 78 | 52 | 77/37 | PCR | — | — | 5–9 | Yes |
| Georgiou [2001–Greece ( 80 ) ] ∥ | 38 | 63 Mn | 99 | 53 | 0/38 | IHC | DO7 | Moderate | — | Yes |
| Smith [2001–USA ( 81 ) ] ∥ | 56 | NR | 82 | 9 | 56/0 | IHC | DO7 | >10 | — | Yes |
| Grammatica [2001–Italy ( 82 ) ] ∥ | 43 | NR | NR | NR | 43/0 | IHC | DO7 | >10 | — | NR |
| Couture [2002–Canada ( 83 ) ] ∥ | 320 | NR | 79 | NR | 214/90 | IHC | 1801 | >10 | — | Yes |
| Nagler [2002–Israel ( 84 ) ] | 55 | 67 Md | 55 | 60 | 55/0 | IHC | BP53–12 | >10 | — | NR |
| Kuropkat [2002–USA ( 85 ) ] | 35 | 56 Mn | 71 | 35 # | 35/0 | IHC, PCR | DO1 | >10 | 4–9 | Yes |
| Sisk [2002–USA ( 86 ) ] | 32 | NR | NR | 9 | 23/9 | PCR | — | — | 5–8 | NR |
| Geisler [2002–USA ( 87 ) ] | 171 | 60 Mn | 79 | 36 ** | 116/55 | IHC | DO7 | >50 | — | Yes |
| Tabor [2002–Netherlands ( 88 ) ] † | 23 | 59 Mn | 65 | 9 | 23/0 | PCR | — | — | 5–9 | NR |
| Khademi [2002–Iran ( 89 ) ] † | 53 | 60 Md | 81 | 6 | 53/0 | IHC | DO7 | >10 | — | NR |
| Takes [2002–Netherlands ( 90 ) ] † | 105 | 59 Mn | 70 | NR | 69/36 | IHC | DO7 | >15 | — | NR |
| Teppo [2003–Finland ( 91 ) ] | 98 | 67 Mn | 85 | 56 | 0/98 | IHC | DO7 | >10 | — | Yes |
| Vora [2003–India ( 92 ) ] | 84 | NR | 92 | 25 | 84/0 | IHC | DO7 | >0 | — | Yes |
| Vielba [2003–Spain ( 93 ) ] | 62 | NR | NR | 37 | 0/62 | IHC | DO7 | >5 | — | NR |
| De Vicente [2004–Spain ( 94 ) ] | 91 | 60 Mn | 77 | 41 | 91/0 | IHC | DO7 | >10 | — | Yes |
| Jayasurya [2004–India ( 95 ) ] ∥ | 121 | 60 Mn | 59 | 35 | 121/0 | IHC | DO7/240 | >10 | — | Yes |
Mn = mean; Md = median; NR = not reported; PCR = polymerase chain reaction; IHC = immunohistochemistry; — = no data.
No specific allusion to mortality.
Percentage of cancer cells with positive immunostaining × intensity of the immunostaining.
Unclear whether Koch ( 28 ) and Taylor ( 57 ) partly or fully overlap; analyses excluding one of the two yield similar results (not shown).
Retrieved data.
No data for two patients.
No data for four patients.
No data for three patients.
Characteristics of eligible studies for meta-analysis of TP53 status in head and neck cancer *
| No. of studies that addressed survival (No. of patients) | ||||||||||
|---|---|---|---|---|---|---|---|---|---|---|
| Characteristic | All | All available | Published and indexed | Published, not indexed | Retrieved | No. of studies with published lymph node data (No. of patients) | ||||
| Total | 64 (4824) | 42 (3388) | 18 (1364) | 13 (1028) | 11 (996) | 39 (2641) | ||||
| Blinding | ||||||||||
| Stated | 30 (2616) | 20 (1980) | 7 (711) | 5 (403) | 8 (866) | 10 (863) | ||||
| Not stated | 34 (2208) | 22 (1408) | 11 (653) | 8 (625) | 3 (130) | 29 (1778) | ||||
| Method | ||||||||||
| IHC | 49 (3975) | 31 (2789) | 12 (1030) | 9 (862) | 10 (897) | 26 (1905) | ||||
| Cutoff 10% | 28 (2292) | 20 (1775) | 6 (434) | 4 (444) | 10 (897) | 14 (979) | ||||
| Other cutoff | 21 (1683) | 11 (1014) | 6 (596) | 5 (418) | — | 23 (1587) | ||||
| PCR | 16 (907) | 12 (657) | 7 (392) | 4 (166) | 1 (99) | 14 (786) | ||||
| Location | ||||||||||
| Oropharynx | 32 (2102) | 20 (1353) | 8 (593) | 5 (290) | 7 (470) | 22 (1411) | ||||
| Larynx | 18 (1426) | 13 (1046) | 3 (273) | 7 (567) | 3 (206) | 5 (364) | ||||
| Both | 14 (1296) | 9 (989) | 7 (498) | 1 (171) | 1 (320) | 12 (866) | ||||
| Sample size per study | ||||||||||
| ≥100 subjects | 11 (1630) | 11 (1630) | 5 (659) | 3 (426) | 3 (545) | 4 (453) | ||||
| <100 subjects | 53 (3194) | 31 (1758) | 13 (705) | 10 (602) | 8 (451) | 35 (2188) | ||||
IHC = immunohistochemistry; PCR = polymerase chain reaction; — = no study.
The 22 studies with eventually unavailable mortality data were not statistically significantly smaller on average than the 42 studies with usable data (mean number of patients = 65.2 and 80.7, respectively; Mann–Whitney P = .90) and were not statistically significantly more likely to use immunohistochemistry (18 of 22 studies versus 31 of 42 studies; chi-square P = .47) to measure TP53. Published and indexed, published–not indexed, and retrieved studies with available mortality data did not differ statistically significantly in any characteristics ( P >.05 for all) ( Table 2 ).
Of the 22 studies with nonretrievable analyzable information on survival, TP53-negative status was claimed to be associated with worse 5-year survival in two studies with 104 patients. One study with 57 patients showed a non–statistically significant trend in the same direction, and four studies with 511 patients showed at a non–statistically significant trend in the opposite direction. Two studies with 88 patients made no comment, and 13 studies with 692 patients stated that there was no statistically significant difference in survival without further details.
In 10 of the 18 studies with readily available and indexed data, investigators used definitions in the mortality analyses that differed from those in this meta-analysis. All 10 studies used a follow-up of other than 2 years (i.e., 5-year survival); in one study, the TP53 definition also differed from the one we used (i.e., the authors used PCR instead of immunohistochemistry data).
Data Synthesis
When only the 18 published and indexed data were considered, positive TP53 status was highly statistically significantly associated with mortality when we used the definitions preferred by each publication (risk ratio [RR] = 1.38, 95% confidence interval [CI] = 1.13 to 1.67, P = .001; and statistically significant between-study heterogeneity, P = .02). The strength of the relationship between TP53 status and mortality decreased when we used standardized, prespecified definitions of TP53 status and used 2-year mortality data (RR = 1.27, 95% CI = 1.06 to 1.53, P = .01; and non–statistically significant between-study heterogeneity, P = .13). When we considered published but not indexed survival data from 13 studies, the strength of the relationship between TP53 status and mortality was reduced even more (RR = 1.23, 95% CI = 1.03 to 1.47, P = .02; and statistically significant between-study heterogeneity, P <.001), because published but not indexed survival data did not show any clear association between TP53 status and mortality (RR = 1.13, 95% CI = 0.81 to 1.59, P = .47; and statistically significant between-study heterogeneity, P <.001). The data retrieved from the investigators for 11 studies actually showed a statistically significant trend for an association in the opposite direction (RR = 0.97, 95% CI = 0.72 to 1.29, P = .81; and statistically significant between-study heterogeneity P = .05). Finally, when all available data were considered, positive TP53 status was no longer associated with worse mortality (RR = 1.16, 95% CI = 0.99 to 1.35, P = .06; statistically significant between-study heterogeneity P <.001) ( Table 3 and Fig. 2 ).
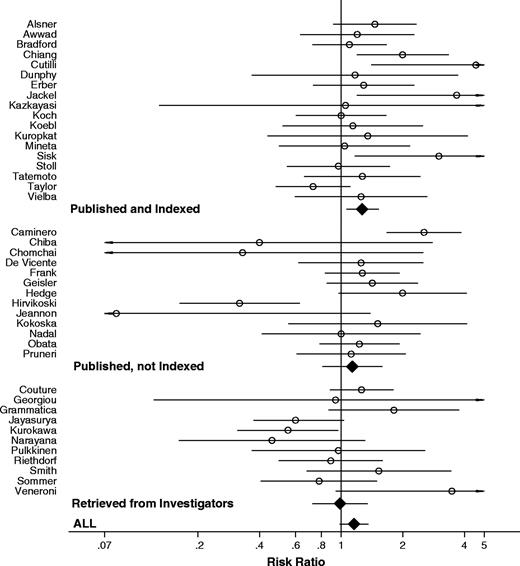
Meta-analysis of the association between TP53 status and the risk of death at 2 years. Each study is shown by the name of the first author and the risk ratio with 95% confidence intervals. RR is shown with open circle and 95% CI with continuous line . Summary risk ratio and 95% confidence intervals (according to random effects calculations) are also shown: RR is shown with solid diamonds and 95% CI with continuous line . Data are separated into published and indexed; published but not indexed; and retrieved. For CIs that extend beyond the visible range, arrows have been placed.
Risk ratio for association between TP53 status and death rate in 24 months *
| Levels of synthesized information | No. of studies (No. of patients) | Random effects risk ratio estimates (95% CI) | Q ( P value) | Fixed-effects risk ratio estimates (95% CI) |
|---|---|---|---|---|
| All | 42 (3388) | 1.16 (0.99 to 1.35) | 84.14 † (<.001) | 1.13 (1.03 to 1.25) |
| All published | 31 (2392) | 1.23 (1.03 to 1.47) | 61.23 † (<.001) | 1.20 (1.06 to 1.34) |
| Published and indexed | 18 (1364) | 1.27 (1.06 to 1.53) | 23.57 (.13) | 1.23 (1.06 to 1.43) |
| Published, not indexed | 13 (1028) | 1.13 (0.81 to 1.59) | 35.22 † (<.001) | 1.19 (0.99 to 1.42) |
| Retrieved | 11 (996) | 0.97 (0.72 to 1.29) | 18.17 † (.05) | 0.98 (0.81 to 1.19) |
| Blinding | ||||
| Stated | 20 (1980) | 1.05 (0.86 to 1.28) | 35.68 † (.01) | 1.05 (0.92 to 1.20) |
| Not stated | 22 (1408) | 1.32 (1.06 to 1.65) | 40.20 † (.007) | 1.29 (1.11 to 1.50) |
| Design | ||||
| Prospective | 6 (564) | 1.01 (0.71 to 1.43) | 11.06 † (.05) | 0.98 (0.78 to 1.22) |
| Retrospective | 31 (2386) | 1.22 (1.00 to 1.49) | 66.64 † (<.001) | 1.19 (1.06 to 1.35) |
| Unclear | 5 (438) | 1.18 (0.91 to 1.53) | 6.62 (.15) | 1.17 (0.88 to 1.54) |
| Geographic Area | ||||
| North America | 14 (1318) | 1.18 (0.97 to 1.43) | 17.36 (.18) | 1.15 (0.98 to 1.35) |
| Europe | 21 (1567) | 1.23 (0.96 to 1.57) | 47.04 † (<.001) | 1.20 (1.03 to 1.39) |
| Asia | 7 (503) | 0.97 (0.63 to 1.51) | 16.90 † (.009) | 0.97 (0.76 to 1.24) |
| Method | ||||
| IHC | 31 (2789) | 1.12 (0.93 to 1.34) | 66.13 † (<.001) | 1.12 (1.00 to 1.26) |
| Cutoff = 10% | 20 (1775) | 1.19 (0.96 to 1.48) | 38.94 † (.004) | 1.20 (1.05 to 1.39) |
| Other cutoff | 11 (1014) | 0.95 (0.68 to 1.33) | 24.13 † (.007) | 0.95 (0.78 to 1.15) |
| PCR | 12 (657) | 1.46 (1.10 to 1.95) | 20.57 † (.03) | 1.30 (1.06 to 1.58) |
| Location | ||||
| Oropharynx | 20 (1353) | 1.23 (0.98 to 1.55) | 43.54 † (<.001) | 1.21 (1.05 to 1.40) |
| Larynx | 13 (1046) | 0.93 (0.64 to 1.34) | 22.44 † (.03) | 0.91 (0.73 to 1.14) |
CI = confidence interval; IHC = immunohistochemistry; PCR = polymerase chain reaction; Q = Q statistic.
P <.10 for between-study heterogeneity by the chi-square–based Q statistic.
Sensitivity Analyses
Sensitivity analyses that excluded living patients censored before 2 years of follow-up showed even less evidence for any prognostic association between TP53 status and mortality (for analyses of published and indexed data, RR = 1.14, 95% CI = 0.93 to 1.40; for analyses of all published data, RR = 1.15, 95% CI = 0.97 to 1.38; and for analyses that included all data retrieved from investigators, RR = 1.11, 95% CI = 0.95 to 1.29). Sensitivity analyses of studies that used data from RT-PCR instead of data from immunohistochemistry, when both were available, provided estimates similar to the main analyses (for the respective datasets, RR = 1.38, 95% CI = 1.12 to 1.71; RR = 1.30, 95% CI = 1.09 to 1.56; and RR = 1.21, 95% CI = 1.03 to 1.42).
Subgroup Analyses
Subgroup analyses showed a statistically significant association in studies that did not state whether they were blinded, but no association in blinded studies ( I2 = 56%). Although the available RT-PCR data showed a statistically significant association ( I2 = 57% compared with immunohistochemistry-derived estimates), this association might be spurious because all four additional RT-PCR studies with 250 patients, for which detailed data could not be retrieved and included in the quantitative synthesis, claimed that there was no association. The overall estimates were similar whether we performed subgroup analyses according to primary tumor location ( I2 = 37%) or immunohistochemistry cutoff ( I2 = 18%). Absolutely no heterogeneity was found between subgroups defined by geographic location or study design ( I2 = 0% for both analyses). Prospective studies showed no association (RR = 1.01, 95% CI = 0.71 to 1.43, P = .95), whereas retrospective studies showed a borderline statistically significant association (RR = 1.22, 95% CI = 1.00 to 1.49, P = .05) ( Table 3 ).
Bias, Adjusted Analyses, and Lymph Node Status Analyses
The estimates provided by larger, more precise indexed studies were more conservative than those provided by smaller indexed studies, as reflected in the asymmetric funnel plot of the data ( Fig. 3, A , P = .09 for the regression equivalent test; and P = .13 for the correlation test, correlation coefficient = .26). The asymmetry decreased when all published data were considered ( Fig. 3, B , P = .13; and P = .56, correlation coefficient = −.07, respectively) and disappeared when all retrieved data were also included ( Fig. 3, C , P = .98; and P = .35, correlation coefficient = −.10, respectively).
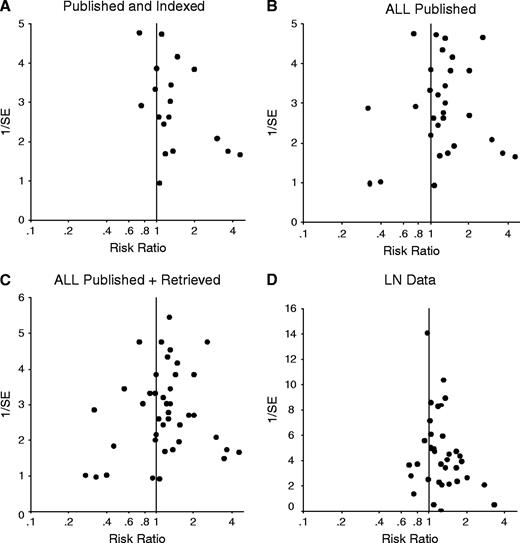
Inverted funnel plots of the relation between risk ratios for survival and 1/standard error (1/SE). Inverted funnel plots show a measure of the effect size on the horizontal axis and a measure of the precision of the estimate on the vertical axis. Asymmetry may signal publication bias, other biases, or other sources of heterogeneity. ( A ) Published and indexed studies. ( B ) All published studies. ( C ) All studies with published or retrieved data. ( D ) Published studies with data for lymph node metastasis at the time of diagnosis.
Some information on adjusted analyses for the association between TP53 status and mortality was given in 18 of the 42 analyzed studies and in six of the 22 studies with nonretrievable analyzable information. However, 13 studies provided only a P value or a statement of whether or not the association was statistically significant. In the 11 studies that provided adjusted estimates of the association between TP53 status and mortality, the adjusting variables were never the same across studies. Lymph node stage was the most commonly used adjusting parameter, and it was used in only five studies.
Positive TP53 status was also statistically significantly associated with the presence of lymph node metastasis when we analyzed the 39 studies with published data (RR = 1.17, 95% CI = 1.08 to 1.27, P <.001; and statistically significant between-study heterogeneity). Subgroup analyses are listed in Table 4 . We found a statistically significant difference between the estimates provided by large, more precise studies and those provided by smaller studies (for the regression analysis, P = .01; for the correlation test P = .04. correlation coefficient = .24; Fig. 3, D ).
Risk ratio for association between TP53 status and lymph node status *
| Studies (No. of patients) | Random-effects risk ratio estimates (95% CI) | Q ( P value) | Fixed-effects risk ratio estimates (95% CI) | |
|---|---|---|---|---|
| Total | 39 (2641) | 1.17 (1.08 to 1.27) | 50.63 † (<.001) | 1.25 (1.15 to 1.35) |
| Survival not retrieved/LN data only | 16 (1224) | 1.23 (1.06 to 1.43) | 17.09 ‡ (.3) | 1.29 (1.2 to 1.49) |
| No survival data apparently/LN data only | 20 (1266) | 1.16 (1.04 to 1.29) | 25.61 ‡ (.14) | 1.21 (1.10 to 1.34) |
| Blinding | ||||
| Stated | 10 (863) | 1.15 (1.02 to 1.30) | 7.40 ‡ (.59) | 1.16 (1.01 to 1.34) |
| Not Stated | 29 (1778) | 1.18 (1.06 to 1.32) | 43.23 † (.03) | 1.29 (1.17 to 1.42) |
| Method | ||||
| IHC | 26 (1905) | 1.22 (1.09 to 1.37) | 43.20 † (.03) | 1.31 (1.19 to 1.44) |
| Cutoff = 10% | 14 (979) | 1,27 (1.05 to 1.55) | 30.80 † (.003) | 1.40 (1.21 to 1.62) |
| Other cutoff | 12 (926) | 1.19 (1.09 to 1.28) | 16.23 ‡ (.8) | 1.19 (1.08 to 1.30) |
| PCR | 14 (786) | 1.04 (0.93 to 1.17) | 10.23 ‡ (.67) | 1.07 (0.94 to 1.22) |
| Location | ||||
| Oropharyngeal SCC | 22 (1411) | 1.20 (1.06 to 1.37) | 33.98 † (.03) | 1.30 (1.16 to 1.45) |
| Laryngeal SCC | 5 (364) | 1.23 (0.63 to 2.42) | 7.23 ‡ (.12) | 1.43 (0.98 to 2.09) |
CI = confidence interval; LN = lymph node; IHC = immunohistochemistry; PCR = polymerase chain reaction; SCC = squamous cell carcinoma.
P <.1 for between-study heterogeneity in the chi-square–based Q statistic.
P >0.1 for between-study heterogeneity in the chi-square–based Q statistic.
Published Meta-Analyses of Prognostic Factors for Various Cancers
Among 593 entries obtained by the initial search, our screening strategy identified 18 English-language meta-analyses ( 96 – 113 ) that targeted potential predictors of mortality in various malignant diseases ( Table 5 ). Most analyzed prognostic factors (28 [76%] of the 37 factors) were eventually found to be statistically significantly associated with mortality. Although only two (5%) of the 37 meta-analyses explicitly used “survival” as a limiting term in the search algorithm, 16 of the 18 stated that the presentation of survival data in the text was considered as an eligibility criterion. Language was used as a limiting term in 12 (67%) of the 18 meta-analyses. Only two (13%) of the 18 meta-analyses stated an effort to retrieve data from the primary investigators, and only one of them actually presented the number of patients for whom data were retrieved. One of these two meta-analyses also presented the number of patients for whom informative data existed, but these data could not be retrieved. Another nine meta-analyses reported on the number of studies with eligible but not evaluable data; however, defining studies with eligible but not evaluable data was limited to studies that reported survival data in a nonusable form, and studies that clearly had collected follow-up information but did not present survival data at all in their publications were not considered.
Characteristics of evaluated meta-analyses of prognostic factors for various malignancies *
| Prognostic factor (No. of studies/statistical significance) | Limiting search terms | Standardization | |||||||||
|---|---|---|---|---|---|---|---|---|---|---|---|
| Author (ref), year of publication | Malignancy | Survival | Other (specific) | Data retrieval | No. nonretrieved studies/No. patients | Mortality | Predictor | PB test | |||
| Meert et al. ( 96 ) , 2002 | Lung cancer | EGFR (11/NS) | No | Yes (EFL) | No | 5/625 † | No | No | No | ||
| Meert et al. ( 97 ) , 2002 | Lung cancer | MVD (23/S) | No | Yes (EFL) | No | 9/779 † | No | No | No | ||
| Meert et al. ( 98 ) , 2003 | Lung cancer | HER-2 (21/S) | No | Yes (EFL) | No | 9/1024 † | No | No | No | ||
| Pakos et al. ( 99 ) , 2003 | Osteosarcoma | Pgp (8/S) | No | No | Yes | No data | Yes | Yes | Yes | ||
| Caro et al. ( 100 ) , 2001 | Cancer (various) | Anemia (60/S) | Yes | No | No | No data | No | No | Yes | ||
| Huncharek et al. ( 101 ) , 2000 | NSCLC | TP53 (8/S) | No | Yes (EL) | No | 1/31 † | Yes | No | No | ||
| Mitsudomi et al. ( 102 ) , 2000 | NSCLC | TP53 (43/S) | No | Yes (EL) | No | 14/? † | Yes | No | Yes | ||
| Martin et al. ( 105 ) , 2003 | Lung cancer | Bcl-2 (25/NS) | No | Yes (EFL) | No | 3/459 † | No | No | No | ||
| Uzzan et al. ( 106 ) , 2004 | Breast cancer | MVD (33/S) | No | Yes (EFGL) | Yes | 14/1196 † | No | No | No | ||
| Funke et al. ( 107 ) , 1998 | Cancer (various) | BMM (20/S) | No | Yes (N>20) | No | No data | No | No | No | ||
| Choma et al. ( 108 ) , 2001 | NSCLC | DNA (35/S) | No | No | No | 7/? ‡ | No | No | No | ||
| Steels et al. ( 109 ) , 2001 | Lung cancer | TP53 (56/S) | No | Yes (EFL) | No | 18/? † | No | No | No | ||
| Huncharek et al. ( 110 ) , 1999 | NSCLC | K-ras (8/S) | No | Yes (EL) | No | 4/? † | Yes | No | No | ||
| Vanteenkiste et al. ( 103 ) , 1998 | Lung cancer | N stage (5/S), T stage (11/S), histologic type (16/S), MLN (12/S), resection (7/NS) | No | Yes (EL) | No | No data | Yes | No | No | ||
| Riley et al. ( 104 ) , 2004 | Neuroblastoma | MYCN (151/S), DNA (44/S), Chr 1p (40/S), VMA (36/NS), HVA (26/NS), VMA/HVA (20/NS), TrkA (16/S), NSE (28/S), LDH (26/S), ferritin (33/S), MRP (16/S) | No | Yes (EL) | No | No data | No | No | No | ||
| Riley et al. ( 111 ) , 2003 | Ewing sarcoma | LDH (15/S), NSE (12/S), S-100 (4/NS), cytokeratin (3/S), Leu-7 (6/NS), CD99 (5/NS) | No | No | No | No data | No | No | Yes | ||
| Ryu et al. ( 113 ) , 2001 | Breast cancer | Body mass index (12/S) | Yes | Yes (EL) | No | No data | No | No | Yes | ||
| Pharoah et al. ( 114 ) , 1999 | Breast cancer | TP53 (11/S) | No | No | No | No data | No | No | No | ||
S = statistically significant association with mortality risk ( P <.05); NS = not statistically significant association with mortality risk ( P ≥.05); PB = publication bias; EL = English language; EFL = English or French language; EFGL = English or French or German language; EGFR = epidermal growth factor receptor; MVD = microvessel density; Her-2 = Her-2/neu dominant gene; TP53 = tumor protein 53 and its gene; Bcl-2 = B-cell lymphoma-2 gene; K-ras = K-ras oncogene; Pgp = P-glycoprotein; BMM = bone marrow micrometastases; DNA = DNA index; MLN = mediastinal lymph nodes; Chr 1p = chromosome 1p; VMA = vanylmandelic acid; HVA = hydrated mandelic acid; TrkA = nerve growth factor receptor; NSE = neuron-specific enolase; LDH = lactate dehydrogenase; MRP = multidrug resistance/associated protein; S-100 = S-100 protein; Leu-7 = leukocyte surface antigen 7; CD99 = cluster designator 99; MYCN = MYCN oncogene; ? = total number of patients not stated.
Survival data were not reported in sufficient detail to be included in quantitative synthesis (eligible but not evaluable) and did not count studies with clinical follow-up but no presentation of survival data.
Data with clinical follow-up, without presentation of survival data in the text.
Only five (28%) of the 18 meta-analyses used a standardized follow-up time, and only one (6%) attempted to use a standardized definition for the expression of the prognostic factor to the extent possible. None, however, converted the data from all studies to exactly the same definition. Five (28%) of the 18 papers considered the possibility of publication bias. The applied test was statistically significant in three of them; another study claimed a symmetric funnel plot, whereas the data showed the contrary. Five meta-analyses used adjusted estimates from the primary studies, and 13 meta-analyses apparently used unadjusted estimates. No meta-analysis performed separate analyses for both adjusted and unadjusted estimates.
D ISCUSSION
Selective reporting has the potential to threaten the validity of the literature on postulated prognostic factors. In our case study, readily accessible published data would have been misleading because it indicated that TP53 status is a strong prognostic factor for outcome of HNSCC. When we made no effort to standardize data across studies but rather relied only on the definitions used in each publication, we found that the association was particularly strong, reaching a P value of .001. When we standardized the definitions of TP53 status and outcomes and retrieved additional information that was mentioned in only a cursory fashion or was not published at all, the statistical significance of the association was abrogated. We should caution that the confidence intervals of the risk ratio for readily indexed, nonindexed, and unpublished retrievable information overlapped. However, we believe that readily available information on prognostic factors may be the tip of the iceberg and that superficial perusal of the literature may lead to erroneous conclusions.
An overview of meta-analyses on prognostic factors revealed that the use of nonstandardized information is almost ubiquitous in meta-analyses and typically only readily presented data are used. Thus, most meta-analyses of prognostic factors published to date appear to be susceptible to the biases that we observed for the association between TP53 and HNSCC.
Potential publication bias is a problem across biomedical research ( 5 , 14 , 15 ) . Bias diagnostics may suggest the existence of this problem, when large studies differ in their results from smaller studies, but these diagnostics are neither very sensitive nor specific ( 114 ) . Moreover, given the plethora of candidate predictors and outcomes, extensive prognostic analyses may be generated by a study team ( 115 ) , but only a fraction of those analyses may be published and even fewer of those analyses may be reported in adequate detail. Investigators may select definitions of outcomes and prognostic factors that yield most impressive, statistically significant results ( 6 ) . Selective reporting and presentation bias are not uncommon even in randomized trials ( 116 ) , but they may be even more prominent in the prognostic factor literature. Prognostic factor studies are increasing rapidly across various biomedical fields, and thousands of articles are published for various predictors of the outcome of malignant diseases. In this TP53 meta-analysis, an exhaustive search showed that half of the studies that definitely had collected survival data failed to provide information that would be sufficient for any additional analysis. Differential measurement error through lack of blinded measurements and the flexible use of definitions for outcome measurements and cutoff points for interpretation of prognostic markers can introduce additional bias and create spurious findings ( 1 , 117 ) . In fact, many prognostic studies target outcomes other than mortality, and these outcomes can be susceptible to selective choice of definitions. Even mortality, the most definitive clinical endpoint possible, may occasionally be manipulated (e.g., with cause-specific deaths, including different variants of nonlethal disease progression, or with variable censoring methods).
In the absence of a single large study, these deficiencies may be overcome by prospective registration of data on specific prognostic factors and by meta-analyses of prospectively collected individual-level data ( 118 ) . Some fields are already moving toward standardized reporting and archiving. Standardization is particularly important for discovery-driven research, where hundreds or thousands of potential molecular predictors may be measured in minimal time ( 119 ) . Yet comprehensive registration often will not be feasible. Because prognostic factors are easy to probe in clinical samples without any requirements for rigorous study design, many investigators will continue to generate data, and much of the data will remain unpublished or will be selectively presented.
Our study had several limitations. It is almost certain that some pertinent information could not be retrieved, and it is not possible to know the effect of including these missing data. Moreover, despite our efforts to standardize data, complete standardization was not feasible. It was not possible, for example, to synthesize standardized information on hazard ratios or to find data with the same TP53 cutoff across all studies. These limitations point to the unavoidable problems that other meta-analyses of prognostic factors are likely to face, even with the best of intentions and efforts.
Given these unavoidable biases, meta-analyses of the prognostic literature offer an opportunity to scrutinize the possible extent of bias and uncertainty. This type of investigation is even more important than arriving at summary estimates ( 120 ) . Our results indicate that the conduct and reporting of prognostic meta-analyses need to be improved ( 121 ) . Otherwise, meta-analyses may spuriously shrink the confidence intervals of biased findings. Searches should be broad, including as many studies, because much of the relevant information from the analyses may be buried in the small print or barely alluded to in the published papers. Efforts to retrieve additional unpublished information are strongly recommended. It would be useful to know how much information is missing at a minimum, and it may be prudent to contact all investigators who are known to work in the wider field. Standardization of outcomes and prognostic factors across studies may further reduce bias. Bias diagnostics should be performed, but they are not definitive.
Finally, a prognostic marker may be of scientific interest but may be clinically useless if the conveyed prognostic information has also been captured by other prognostic factors that are more easily assessed. For example, the prognostic association between some molecular markers and mortality may be entirely mediated through parameters such as lymph node involvement or tumor size. Our empirical evaluation suggests that properly and consistently adjusted estimates are the exception in the prognostic factor literature and in meta-analyses thereof. Incorporation of molecular and other predictors into clinical practice should require large-scale validation in both unadjusted and adjusted analyses.
We conclude that major reporting biases may be operating in the literature of prognostic markers for cancer outcomes. Unless they are recognized and dealt with appropriately, these biases may create a spurious knowledge base ( 122 ) of cancer predictors that may be of no use and may be potentially harmful.
We are grateful to Drs. S. Kannan (Division of Cancer Research, Regional Cancer Centre, Thiruvananthapuram, Kerala, India), J. Olofsson (Klinik für Hals-, Nasen- und Ohrenheilkunde der Universität, Bergen, Haukeland Krankenhaus, Norwegen), B.D. Smith (Department of Therapeutic Radiology, Yale University, School of Medicine, New Haven, CT), I. Gomatos (Laboratory of Surgical Research, First Department of Propaedeutic Surgery, Hippokration Hospital, Athens, Greece), S. Reddy (Department of Radiotherapy, Loyola University Medical Center, Maywood, IL), J. Pulkkinen (Department of Otorhinolaryngology, Turku University Hospital, Turku, Finland), A. Paradiso (National Cancer Institute, Bari, Italy), J. Ware (Department of Pathology, Medical College of Virginia, Richmond, VA), R. Nagler (Department of Oral and Maxillofacial Surgery, Rambam Medical Center and Faculty of Medicine, Technion-Israel Institute of Technology, Haifa, Israel), H. Welkoborsky (Department of Otorhinolaryngology Head and Neck Surgery, Nordstadt Clinic-Academic Hospital, Hannover), A. Fortin (Laval University Cancer Research Center, Quebec, Canada), and Q. Wei (Department of Epidemiology, The University of Texas M. D. Anderson Cancer Center, Houston, TX) for kindly providing us additional data, or useful information about their studies, upon request.
References
Simon R, Altman DG. Statistical aspects of prognostic factor studies in oncology.
Ransohoff DF. Rules of evidence for cancer molecular-marker discovery and validation.
Altman DG, Lyman GH. Methodological challenges in the evaluation of prognostic factors in breast cancer.
Dickersin K, Chan S, Chalmers TC, Sacs HS, Smith HJ. Publication bias and clinical trials.
Altman DG, Lausen B, Sauerbrei W, Schumacher M. Dangers of using “optimal” cutpoints in the evaluation of prognostic factors.
Eliyahu D, Michalovitz D, Eliyahu S, Pinhasi-Kimhi O, Oren M. Wild-type p53 can inhibit oncogene-mediated focus formation.
Soussi T, Beroud C. Assessing TP53 status in human tumours to evaluate clinical outcome.
Pakos EE, Kyzas AP, Ioannidis JP. Prognostic significance of TP53 tumor suppressor gene expression and mutations in human osteosarcoma: a meta-analysis.
Greenberg JS, El Naggar AK, Mo V, Roberts D, Myers JN. Disparity in pathologic and clinical lymph node staging in oral tongue carcinoma. Implication for therapeutic decision-making.
Pettiti DB. Meta-analysis, decision analysis and cost-effectiveness analysis. 2nd edition, New York (NY), Oxford University Press;
Lau J, Ioannidis JP, Schmid CH. Quantitative synthesis in systematic reviews.
Higgins JP, Thompson SG. Quantifying heterogeneity in a meta-analysis.
Sterne JA, Gavaghan D, Egger M. Publication and related bias in meta-analysis: power of statistical tests and prevalence in the literature.
Egger M, Davey Smith G, Schneider M, Minder C. Bias in meta-analysis detected by a simple, graphical test.
Begg CB, Mazumdar M. Operating characteristics of a rank correlation test for publication bias.
Sauter ER, Ridge JA, Gordon J, Eisenberg BL. p53 overexpression correlates with increased survival in patients with squamous carcinoma of the tongue base.
Leedy DA, Trune DR, Kronz JD, Weidner N, Cohen JI. Tumor angiogenesis, the p53 antigen, and cervical metastasis in squamous carcinoma of the tongue.
Frank JL, Bur ME, Garb JL, Kay S, Ware JL, Sismanis A, et al. p53 tumor suppressor oncogene expression in squamous cell carcinoma of the hypopharynx.
Ahomadegbe JC, Barrois M, Fogel S, Le Bihan ML, Douc-Rasy S, Duvillard P, et al. High incidence of p53 alterations (mutation, deletion, overexpression) in head and neck primary tumors and metastases; absence of correlation with clinical outcome. Frequent protein overexpression in normal epithelium and in early non-invasive lesions.
Wilson GD, Richman PI, Dische S, Saunders MI, Robinson B, Daley FM, et al. p53 status of head and neck cancer: relation to biological characteristics and outcome of radiotherapy.
Bradford CR, Zhu S, Wolf GT, Poore J, Fisher SG, Beals T, et al. Overexpression of p53 predicts organ preservation using induction chemotherapy and radiation in patients with advanced laryngeal cancer.
Nadal A, Campo E, Pinto J, Mallofre C, Palacin A, Arias C, et al. p53 expression in normal, dysplastic, and neoplastic laryngeal epithelium. Absence of a correlation with prognostic factors.
Spafford MF, Koeppe J, Pan Z, Archer PG, Meyers AD, Franklin WA. Correlation of tumor markers p53, bcl-2, CD34, CD44H, CD44v6, and Ki-67 with survival and metastasis in laryngeal squamous cell carcinoma.
Caminero MJ, Nunez F, Suarez C, Ablanedo P, Riera JR, Dominguez F. Detection of p53 protein in oropharyngeal carcinoma. Prognostic implications.
Chiba I, Shindoh M, Yasuda M, Yamazaki Y, Amemiya A, Sato Y, et al. Mutations in the p53 gene and human papillomavirus infection as significant prognostic factors in squamous cell carcinomas of the oral cavity.
Awwad S, Jaros E, Somes J, Lunec J. P53 overexpression in head and neck carcinoma and radiotherapy results.
Koch WM, Brennan JA, Zahurak M, Goodman SN, Westra WH, Schwab D, et al. p53 mutation and locoregional treatment failure in head and neck squamous cell carcinoma.
Kokoska MS, Piccirillo JF, el-Mofty SK, Emami B, Haughey BH, Schoinick SB. Prognostic significance of clinical factors and p53 expression in patients with glottic carcinoma treated with radiation therapy.
Kusama K, Okutsu S, Takeda A, Himiya T, Kojima A, Kidokoro Y, et al. p53 gene alterations and p53 protein in oral epithelial dysplasia and squamous cell carcinoma.
Haraf DJ, Nodzenski E, Brachman D, Mick R, Montag A, Graves D, et al. Human papilloma virus and p53 in head and neck cancer: clinical correlates and survival.
Dunphy CH, Dunphy FR, Boyd JH, Varvares MA, Kim HJ, Lowe V, et al. Expression of p53 protein in advanced head and neck squamous cell carcinoma before and after chemotherapy.
Hirvikoski P, Kumpulainen E, Virtaniemi J, Johansson R, Haapasalo H, Marin S, et al. p53 expression and cell proliferation as prognostic factors in laryngeal squamous cell carcinoma.
Cutilli T, Papola F, Corbacelli A. p53 overexpression and mutation, chemoresistance and patient survival in oral and maxillofacial squamous cell carcinoma.
Veneroni S, Silvestrini R, Costa A, Salvatori P, Faranda A, Molinari R. Biological indicators of survival in patients treated by surgery for squamous cell carcinoma of the oral cavity and oropharynx.
Sommer T, Olofsson J. Significance of p53, PCNA and Ki-67 in the prognosis of squamous cell carcinoma of the oral cavity.
Olshan AF, Weissler MC, Pei H, Conway K, Anderson S, Fried DB, et al. Alterations of the p16 gene in head and neck cancer: frequency and association with p53, PRAD-1 and HPV.
Stoll C, Baretton G, Lohrs U. The influence of p53 and associated factors on the outcome of patients with oral squamous cell carcinoma.
Tatemoto Y, Osaki T, Yoneda K, Yamamoto T, Ueta E, Kimura T. Expression of p53 and p21 proteins in oral squamous cell carcinoma: correlation with lymph node metastasis and response to chemoradiotherapy.
Hegde PU, Brenski AC, Caldarelli DD, Hutchinson J, Panje WR, Wood NB, et al. Tumor angiogenesis and p53 mutations: prognosis in head and neck cancer.
Mineta H, Borg A, Dictor M, Wahlberg P, Akervall J, Wennerberg J. p53 mutation, but not p53 overexpression, correlates with survival in head and neck squamous cell carcinoma.
Pruneri G, Pignataro L, Carboni N, Ronchetti D, Cesana BM, Ottaviani A, et al. Clinical relevance of p53 and bcl-2 protein over-expression in laryngeal squamous-cell carcinoma.
Erber R, Conradt C, Homann N, Enders C, Finckh M, Dietz A, et al. TP53 DNA contact mutations are selectively associated with allelic loss and have a strong clinical impact in head and neck cancer.
Riethdorf S, Friedrich RE, Suhwold J, Ostwald C, Barten M, Gogacz P, et al. [p53 mutations and HPV infections in squamous epithelial carcinomas of the head-neck region. Long-term follow-up].
Kaur J, Srivastava A, Ralhan R. Prognostic significance of p53 protein overexpression in betel- and tobacco-related oral oncogenesis.
Ma L, Ronai A, Riede UN, Kohler G. Clinical implication of screening p53 gene mutations in head and neck squamous cell carcinomas.
Gandour-Edwards R, Trock BJ, Gumerlock P, Donald PJ. Heat shock protein and p53 expression in head and neck squamous cell carcinoma.
Maeda T, Matsumura S, Hiranuma H, Jikko A, Furukawa S, Ishida T, et al. Expression of vascular endothelial growth factor in human oral squamous cell carcinoma: its association with tumour progression and p53 gene status.
Jin YT, Kayser S, Kemp BL, Ordonez NG, Tucker SL, Clayman GL, et al. The prognostic significance of the biomarkers p21WAF1/CIP1, p53, and bcl-2 in laryngeal squamous cell carcinoma.
Lera J, Lara PC, Perez S, Cabrera JL, Santana C. Tumor proliferation, p53 expression, and apoptosis in laryngeal carcinoma: relation to the results of radiotherapy.
Pai HH, Rochon L, Clark B, Black M, Shenouda G. Overexpression of p53 protein does not predict local-regional control or survival in patients with early-stage squamous cell carcinoma of the glottic larynx treated with radiotherapy.
Ibrahim SO, Lillehaug JR, Johannessen AC, Liavaag PG, Nilsen R, Vasstrand EN. Expression of biomarkers (p53, transforming growth factor alpha, epidermal growth factor receptor, c-erbB-2/neu and the proliferative cell nuclear antigen) in oropharyngeal squamous cell carcinomas.
Yao L, Iwai M, Furuta I. Correlations of bcl-2 and p53 expression with the clinicopathological features in tongue squamous cell carcinomas.
Unal OF, Ayhan A, Hosal AS. Prognostic value of p53 expression and histopathological parameters in squamous cell carcinoma of oral tongue.
Haas S, Bosch FX, Klein-Kuhne W, Nollert J, Rudat V, Conradt C, et al. [Prognostic significance of cell-cycle regulatory proteins for outcome after primary radiochemotherapy in patients with advanced head and neck cancer].
Pulkkinen JO, Klemi P, Martikainen P, Grenman R. Apoptosis in situ, p53, bcl-2 and AgNOR counts as prognostic factors in laryngeal carcinoma.
Taylor D, Koch WM, Zahurak M, Shah K, Sidransky D, Westra WH. Immunohistochemical detection of p53 protein accumulation in head and neck cancer: correlation with p53 gene alterations.
Welkoborsky HJ, Gluckman JL, Jacob R, Bernauer H, Mann W. Tumor biologic prognostic parameters in T1N0M0 squamous cell carcinoma of the oral cavity.
Chomchai JS, Du W, Sarkar FH, Li YW, Jacobs JR, Ensley JF, et al. Prognostic significance of p53 gene mutations in laryngeal cancer.
Chiang CP, Huang JS, Wang JT, Liu BY, Kuo YS, Hahn LJ, et al. Expression of p53 protein correlates with decreased survival in patients with areca quid chewing and smoking-associated oral squamous cell carcinomas in Taiwan.
Xie X, Clausen OP, De Angelis P, Boysen M. The prognostic value of spontaneous apoptosis, Bax, Bcl-2, and p53 in oral squamous cell carcinoma of the tongue.
Fujieda S, Inuzuka M, Tanaka N, Sunaga H, Fan GK, Ito T, et al. Expression of p27 is associated with Bax expression and spontaneous apoptosis in oral and oropharyngeal carcinoma.
Kurokawa H, Yamashita Y, Takeda S, Miura K, Murata T, Kajiyama M. The expression of proliferating cell nuclear antigen (PCNA) and p 53 protein correlate with prognosis of patients with oral squamous cell carcinoma.
Narayana A, Vaughan AT, Kathuria S, Fisher SG, Walter SA, Reddy SP. P53 overexpression is associated with bulky tumor and poor local control in T1 glottic cancer.
Obata A, Eura M, Sasaki J, Saya H, Chikamatsu K, Tada M, et al. Clinical significance of p53 functional loss in squamous cell carcinoma of the oropharynx.
Jeannon JP, Soames J, Lunec J, Awwad S, Ashton V, Wilson JA. Expression of cyclin-dependent kinase inhibitor p21(WAF1) and p53 tumour suppressor gene in laryngeal cancer. [published erratum appears in: Clin Otolaryngol 2000;25:431.]
Cabelguenne A, Blons H, de Waziers I, Carnot F, Houllier AM, Soussi T, et al. p53 alterations predict tumor response to neoadjuvant chemotherapy in head and neck squamous cell carcinoma: a prospective series.
Riedel F, Gotte K, Schwalb J, Schafer C, Hormann K. Vascular endothelial growth factor expression correlates with p53 mutation and angiogenesis in squamous cell carcinoma of the head and neck.
Shima K, Kobayashi I, Saito I, Kiyoshima T, Matsuo K, Ozeki S, et al. Incidence of human papillomavirus 16 and 18 infection and p53 mutation in patients with oral squamous cell carcinoma in Japan.
Jackel MC, Sellmann L, Dorudian MA, Youssef S, Fuzesi L. Prognostic significance of p53/bcl-2 co-expression in patients with laryngeal squamous cell carcinoma.
Ostwald C, Gogacz P, Hillmann T, Schweder J, Gundlach K, Kundt G, et al. p53 mutational spectra are different between squamous-cell carcinomas of the lip and the oral cavity.
Grabenbauer GG, Muhlfriedel C, Rodel F. Squamous cell carcinoma of the oropharynx: Ki-67 and p53 can identify patients at high risk for local recurrence after surgery and postoperative radiotherapy.
Lam KY, Ng IO, Yuen AP, Kwong DL, Wei W. Cyclin D1 expression in oral squamous cell carcinomas: clinicopathological relevance and correlation with p53 expression.
Gonzalez-Moles MA, Galindo P, Gutierrez-Fernandez J, Sanchez-Fernandez E, Rodriguez-Archilla A, Ruiz-Avila I, et al. P53 protein expression in oral squamous cell carcinoma. Survival analysis.
Friedman M, Lim JW, Manders E, Schaffner AD, Kirshenbaum GL, Tanyeri HM, et al. Prognostic significance of Bcl-2 and p53 expression in advanced laryngeal squamous cell carcinoma.
Kerdpon D, Sriplung H, Kietthubthew S. Expression of p53 in oral squamous cell carcinoma and its association with risk habits in southern Thailand.
Kazkayasi M, Hucumenoglu S, Siriner GI, Hucumenoglu M. Over-expression of p53 and c-erbB-2 oncoproteins in laryngeal carcinoma.
Koelbl O, Rosenwald A, Haberl M, Muller J, Reuther J, Flentje M. p53 and Ki-67 as predictive markers for radiosensitivity in squamous cell carcinoma of the oral cavity? an immunohistochemical and clinicopathologic study.
Alsner J, Sorensen SB, Overgaard J. TP53 mutation is related to poor prognosis after radiotherapy, but not surgery, in squamous cell carcinoma of the head and neck.
Georgiou A, Gomatos IP, Ferekidis E, Syrigos K, Bistola V, Giotakis J, et al. Prognostic significance of p53, bax and bcl-2 gene expression in patients with laryngeal carcinoma.
Smith BD, Smith GL, Carter D, DiGiovanna MP, Kasowitz KM, Sasaki CT, et al. Molecular marker expression in oral and oropharyngeal squamous cell carcinoma.
Grammatica L, Piepoli S, D'Auria C, Achille G, Marzullo F, Zito FA, et al. Primary tumours neoangiogenesis and P53 expression in oral carcinoma patients.
Couture C, Raybaud-Diogene H, Tetu B, Bairati I, Murry D, Allard J, et al. p53 and Ki-67 as markers of radioresistance in head and neck carcinoma.
Nagler RM, Kerner H, Laufer D, Ben-Eliezer S, Minkov I, Ben-Itzhak O. Squamous cell carcinoma of the tongue: the prevalence and prognostic roles of p53, Bcl-2, c-erbB-2 and apoptotic rate as related to clinical and pathological characteristics in a retrospective study.
Kuropkat C, Venkatesan TK, Caldarelli DD, Panje WR, Hutchinson J, Preisler HD, et al. Abnormalities of molecular regulators of proliferation and apoptosis in carcinoma of the oral cavity and oropharynx.
Sisk EA, Soltys SG, Zhu S, Fisher SG, Carey TE, Bradford CR. Human papillomavirus and p53 mutational status as prognostic factors in head and neck carcinoma.
Geisler SA, Olshan AF, Weissler MC, Cai J, Funkhouser WK, Smith J, et al. p16 and p53 Protein expression as prognostic indicators of survival and disease recurrence from head and neck cancer.
Tabor MP, van Houten VM, Kummer JA, Vosjan MJ, Vlasblom R, Snow GB, et al. Discordance of genetic alterations between primary head and neck tumors and corresponding metastases associated with mutational status of the TP53 gene.
Khademi B, Shirazi FM, Vasei M, Doroudchi M, Gandomi B, Modjtahedi H, et al. The expression of p53, c-erbB-1 and c-erbB-2 molecules and their correlation with prognostic markers in patients with head and neck tumors.
Takes RP, Baatenburg De Jong RJ, Alles MJ, Meeuwis CA, Marres HA, Knegt PP, et al. Markers for nodal metastasis in head and neck squamous cell cancer.
Teppo H, Soini Y, Melkko J, Koivunen P, Alho OP. Prognostic factors in laryngeal carcinoma: the role of apoptosis, p53, proliferation (Ki-67) and angiogenesis.
Vora HH, Shah NG, Patel DD, Trivedi TI, Chikhlikar PR. Prognostic significance of biomarkers in squamous cell carcinoma of the tongue: multivariate analysis.
Vielba R, Bilbao J, Ispizua A, Zabalza I, Alfaro J, Rezola R, et al. p53 and cyclin D1 as prognostic factors in squamous cell carcinoma of the larynx.
Carlos de Vicente J, Junquera Gutierrez LM, Zapatero AH, Fresno Forcelledo MF, Hernandez-Vallejo G, Lopez Arranz JS. Prognostic significance of p53 expression in oral squamous cell carcinoma without neck node metastases.
Jayasurya R, Francis G, Kannan S, Lekshminarayanan K, Nalinakumari KR, Abraham T, et al. p53, p16 and cyclin D1: molecular determinants of radiotherapy treatment response in oral carcinoma.
Meert AP, Martin B, Delmotte P, Berghmans T, Lafitte JJ, Mascaux C, et al. The role of EGF-R expression on patient survival in lung cancer: a systematic review with meta-analysis.
Meert AP, Paesmans M, Martin B, Delmotte P, Berghmans T, Verdebout JM, et al. The role of microvessel density on the survival of patients with lung cancer: a systematic review of the literature with meta-analysis.
Meert AP, Martin B, Paesmans M, Berghmans T, Mascaux C, Verdebout JM, et al. The role of HER-2/neu expression on the survival of patients with lung cancer: a systematic review of the literature.
Pakos EE, Ioannidis JP. The association of P-glycoprotein with response to chemotherapy and clinical outcome in patients with osteosarcoma. A meta-analysis.
Caro JJ, Salas M, Ward A, Goss G. Anemia as an independent prognostic factor for survival in patients with cancer: a systematic, quantitative review.
Huncharek M, Kupelnick B, Geschwind JF, Caubet JF. Prognostic significance of p53 mutations in non-small cell lung cancer: a meta-analysis of 829 cases from eight published studies.
Mitsudomi T, Hamajima N, Ogawa M, Takahashi T. Prognostic significance of p53 alterations in patients with non-small cell lung cancer: a meta-analysis.
Vansteenkiste JF, De Leyn PR, Deneffe GJ, Lerut TE, Demends MG. Clinical prognostic factors in surgically treated stage IIIA-N2 non-small cell lung cancer: analysis of the literature.
Riley RD, Heney D, Jones DR, Sutton AJ, Lambert PC, Abrams KR, et al. A systematic review of molecular and biological tumor markers in neuroblastoma.
Martin B, Paesmans M, Berghmans T, Branle F, Ghisdal L, Mascaux C, et al. Role of Bcl-2 as a prognostic factor for survival in lung cancer: a systematic review of the literature with meta-analysis.
Uzzan B, Nicolas P, Cucherat M, Perret GY. Microvessel density as a prognostic factor in women with breast cancer: a systematic review of the literature and meta-analysis.
Funke I, Schraut W. Meta-analyses of studies on bone marrow micrometastases: an independent prognostic impact remains to be substantiated.
Choma D, Daures JP, Quantin X, Pujol JL. Aneuploidy and prognosis of non-small-cell lung cancer: a meta-analysis of published data.
Steels E, Paesmans M, Berghmans T, Branle F, Lemaitre F, Mascaux C, et al. Role of p53 as a prognostic factor for survival in lung cancer: a systematic review of the literature with a meta-analysis.
Huncharek M, Muscat J, Geschwind JF. K-ras oncogene mutation as a prognostic marker in non-small cell lung cancer: a combined analysis of 881 cases.
Riley RD, Burchill SA, Abrams KR, Heney D, Sutton AJ, Jones DR, et al. A systematic review of molecular and biological markers in tumours of the Ewing's sarcoma family.
Pharoah PD, Day NE, Caldas C. Somatic mutations in the p53 gene and prognosis in breast cancer: a meta-analysis.
Ryu SY, Kim CB, Nam CM, Park JK, Kim KS, Park J, et al. Is body mass index the prognostic factor in breast cancer? A meta-analysis.
Macaskill P, Walter SD, Irwig L. A comparison of methods to detect publication bias in meta-analysis.
Chan AW, Hrobjartsson A, Haahr MT, Gotzsche PC, Altman DG. Empirical evidence for selective reporting of outcomes in randomized trials: comparison of protocols to published articles.
Bogardus ST Jr, Concato J, Feinstein AR. Clinical epidemiological quality in molecular genetic research: the need for methodological standards.
Ioannidis JP, Rosenberg PS, Goedert JJ, O'Brien TR. Commentary: meta-analysis of individual participants' data in genetic epidemiology.
Ntzani EE, Ioannidis JP. Predictive ability of DNA microarrays for cancer outcomes and correlates: an empirical assessment.
Lau J, Ioannidis JP, Schmid CH. Summing up evidence: one answer is not always enough.
Stroup DF, Berlin JA, Morton SC, Olkin I, Williamson GD, Rennie D, et al. Meta-analysis of observational studies in epidemiology: a proposal for reporting. Meta-analysis Of Observational Studies in Epidemiology (MOOSE) group.

