


Abstract
Background Epidemiological studies have shown that asthma is positively associated with depression. Most of this evidence stems from individual studies conducted in Western populations (e.g. Europe, North America and Australia). It is still unclear whether such findings generalize to non-Western countries. To address this question, the present study investigated the association of asthma and wheezing with depression in a large multi-national sample.
Methods We used data from the 2002 World Health Survey. Participants reported physician-diagnosed asthma and attacks of wheezing within the past 12 months. Questions on depressive symptoms, their duration and persistence were used to define presence of a major depressive episode (MDE) within the past 12 months. ORs and 95% CIs were estimated by logistic regression for the entire sample, by continent (Australia, Europe, South America, Asia and Africa) and by country. Complete information was available for 57 countries.
Results Both asthma and wheezing were associated with MDE in the entire sample (OR = 2.37, 95% CI = 2.10–2.66 and OR = 3.06, 95% CI = 2.75–3.40, respectively). Similar associations were found for all continents with generally stronger ORs in South America, Asia and Africa for both asthma (ORs ≥ 1.8) and wheezing (ORs ≥ 2.8). On the country level, wheezing showed a consistent pattern of association with MDE. Similar patterns were found for asthma.
Conclusions Despite a range of country differences that could affect the association of asthma with depression, such as access to health care, the results of this study indicate that the co-occurrence of asthma and depression is a universal phenomenon.
Introduction
It has been observed that individuals with asthma are more likely than those without asthma to suffer from depression.1,2 Significantly, comorbid depression is associated with poorer health outcomes in asthma patients including reduced asthma control and asthma-specific quality of life, as well as increased asthma severity, rates of hospitalization and mortality.3–6 The adverse effect of depression on asthma morbidity may be mediated, among others, through behavioural pathways (e.g., poor adherence and self-management) and/or physiological pathways that may involve dysregulation of immunological and neuroendocrine pathways.7
The majority of previous epidemiological studies on the co-occurrence of asthma and depression were conducted in Western populations, i.e. Europe, North America and Australia.1,2,8,9 It is still elusive whether findings from those Western populations can be generalized to non-Western continents and countries. For instance, countries differ with respect to the dominant treatment approaches to asthma.10–12 In many African and Asian countries, the vast majority of the population relies on traditional medicine for primary health care.13 Further, the availability and level of access to health services vary considerably between countries and could alter the strength of the asthma–depression relationship: it is conceivable that such differences may affect the likelihood of receiving an asthma diagnosis as well as the level of patients’ asthma control. Poor asthma control is predictive of incident depression.14 Furthermore, cultural features of depression may affect the rate of co-occurrence of asthma and depression across countries: although research has suggested a universal set of depressive symptoms (e.g., tiredness and sleep problems),15 the conceptualization, experience and expression of depression seem to differ strongly between cultures.16–21
To date, only one multi-national population study addressed the association between asthma and depression in adults,2 i.e. the World Mental Health Surveys (WMHS). That study comprised a total of 17 countries, only seven of which were from South America, Asia and Africa. Moreover, low-income countries were not at all included in the WMHS, and the definition of asthma was based on self-reports of a physician diagnosis. Unlike self-reports of key asthma symptoms (e.g. wheezing), reporting of physician diagnoses of asthma may be affected by differences between countries concerning procedures of diagnosing asthma and/or access to health care.22,23
The aim of the current study was to examine the association of asthma and depression in Western countries and, more importantly, to explore whether similar co-occurrence is observed in non-Western countries. To do so, we drew on a data set, which included representative samples from a large number of countries, including various low-income countries. Further, we were able to operationalize asthma in terms of both self-reported physician diagnoses and wheezing.
Methods
Study population
The 2002 World Health Survey (WHS) was conducted in 70 countries across five continents (Europe, Australia, South America, Asia and Africa).24 In 10 countries, a single-stage random sample was drawn, whereas the sampling procedures in the other 60 countries were based on multi-stage stratified procedures. The sampling process was stratified by gender, age and residential area (rural/urban). In most countries, enumeration areas and households were used as additional stratification units. Any individual who was considered member of a selected household and was aged ≥18 years was eligible. Each member of a selected household had an equal opportunity of being asked for participation (ensured by using Kish tables). More detailed information on the sampling approach can be found elsewhere.24–26
Questionnaire data
Asthma and wheezing
Asthma was assessed by the following questionnaire item: ‘Have you ever been diagnosed with asthma (an allergic respiratory disease)?’ Response categories were ‘yes’, ‘no’ and ‘don’t know’. Individuals specifying ‘don’t know’ were excluded from the analysis. Wheezing was considered present if an affirmative answer was provided to the following question: ‘During the last 12 months, have you experienced any of the following? Attacks of wheezing or whistling breathing […]’ (yes—no—don’t know). Individuals responding ‘don’t know’ were excluded from the analysis.
Depression
A total of seven items from the 2002 WHS interview can be used to define presence of a major depressive episode (MDE). A standardized algorithm was applied, which was based on the criteria of the Diagnostic and Statistical Manual of Mental Disorders, 4th Edition (DSM-IV) and had been used in previous publications from the WHS.25 First, participants provided answers (yes—no—don’t know) to the following five items:
‘During the last 12 months have you experienced any of the following:
A period lasting several days when you felt sad, empty or depressed?
A period lasting several days when you lost interest in most things you usually enjoy such as hobbies, personal relationships or work?
A period lasting several days when you have been feeling your energy level decreased or that you were tired all the time?
Did you lose your appetite?
Did you notice any slowing down in your thinking?’
Respondents providing four or more affirmative answers were considered possible MDE cases. All other respondents were categorized negative for MDE. Possible MDE cases replied to two additional questions:
Was this period for more than 2 weeks?
Was this period most of the day, nearly every day?
Possible cases who answered ‘yes’ on both these questions were considered positive for MDE. Otherwise they were considered to be free of MDE.
Statistical analysis
Country samples that were recruited based on single-stage random sampling (n = 10) were excluded from the analyses because they had missing values on some of the weights that are required for statistical analyses of the multi-stage random samples. Further, exclusions were made due to quasi-complete separation in the data (n = 2) and due to missing data (n = 1). In total, we used data from 57 samples for the current analysis.
All analyses were performed using the Complex Samples module of SPSS 19. This module allows accounting for increased variance in the data due to the multi-stage probability sampling structure. We used logistic regressions to estimate odds ratios (ORs) and 95% confidence intervals (CIs) for the association between asthma or wheezing (exposure variable) and MDE (outcome variable). The following analyses were conducted separately for asthma and wheezing. First, ORs were estimated for the entire WHS sample and, second, by continent. The United Nations’ classification system27 was used to categorize countries into continents. In a third step, those analyses were stratified by sex. The potential effect-modification by sex was tested by inclusion of sex × asthma or sex × wheezing interaction terms in the statistical model. Fourth, using the entire WHS sample and continent-specific samples, we explored the association between asthma or wheezing with individual symptoms of MDE (labelled ‘mood problems’, ‘lost interest’, ‘tiredness’, ‘reduced appetite’, ‘slower thinking’, respectively). Finally, we ran analyses to estimate the OR for asthma or wheezing and MDE by country.
The selection of confounders was based on potential or documented associations with asthma and MDE.28,29 ORs were initially adjusted for age, sex and education, and in a second step, they were adjusted for lifestyle variables. However, additional adjustment for body mass index (BMI) (which was available for all country samples) and further adjustment for smoking and physical activity (this information was not available in all samples) did not substantially alter the observed associations (data not shown). Therefore, only the age-sex-and-education-adjusted models are shown, as these are based on the largest and likely the most representative samples. Unadjusted analyses yielded modestly higher ORs compared with the adjusted analyses (data not shown).
Results
The sample sizes ranged from n = 700 (Luxembourg) to n = 38 745 (Mexico). The mean age in years of national samples ranged from mid-30s to early 50s, and the proportion of female participants varied from 0.5 and 0.6 in most country samples. Averaged over all continents, the prevalence of asthma equalled 6.4%, ranging from 3.9% (Africa) to 19.0% (Australia). The mean prevalence of wheezing was 10.3% in the entire sample, with a range from 8.2% (Africa) to 18.0% (Australia). The mean prevalence of 12-month MDE was 8.4%, with the lowest prevalence being observed in Australia (6.6%) and the highest prevalence in South America (17.1%). Country-specific information can be found in the Supplementary Table 1 (Supplementary Table 1 is available at IJE online).
Asthma
In pooled analyses, individuals with asthma had higher odds of depression than those without asthma (OR = 2.37, 95% CI = 2.10–2.66) (Table 1). On the continent level, asthma and MDE showed the expected positive association in Australia (OR = 1.66, 95% CI = 1.14–2.41) and Europe (OR = 1.74, 95% CI = 1.32–2.30). This association was comparable or even stronger in South America (OR = 2.86, 95% CI = 2.28–3.60), Asia (OR = 2.39, 95% CI = 1.99–2.88) and Africa (OR = 1.77, 95% CI = 1.38–2.26). Associations between asthma and depression did not considerably differ between men and women from Europe, Australia and Africa. Pronounced sex differences were found in South America and in Asia with higher ORs in men than in women (Table 1).
Odds ratios (ORs) and 95% confidence intervals (CIs) for a major depressive episode (MDE) according to asthma (overall sample and by continent)
| Women and men | Women | Men | ||||
|---|---|---|---|---|---|---|
| n | % with asthma | % with MDE | OR (95% CI)a | OR (95% CI)a | OR (95% CI)a | |
| Overall sample | 245 727 | 6.4 | 8.4 | 2.37 (2.10–2.66) | 1.97 (1.70–2.28) | 3.18 (2.63–3.83) |
| P for interaction = 0.00 | ||||||
| Europe | 29 083 | 6.6 | 7.3 | 1.74 (1.32–2.30) | 1.66 (1.22–2.26) | 2.14 (1.13–4.07) |
| P for interaction = 0.50 | ||||||
| Australia | 3599 | 19.0 | 6.6 | 1.66 (1.14–2.41) | 1.61 (1.04–2.48) | 1.80 (0.90–3.56) |
| P for interaction = 0.90 | ||||||
| South America | 61 053 | 8.7 | 17.1 | 2.86 (2.28–3.60) | 2.48 (1.85–3.32) | 4.04 (2.74–5.97) |
| P for interaction = 0.06 | ||||||
| Asia | 77 882 | 5.4 | 7.1 | 2.39 (1.99–2.88) | 1.65 (1.28–2.13) | 3.44 (2.64–4.48) |
| P for interaction = 0.00 | ||||||
| Africa | 74 110 | 3.9 | 8.0 | 1.77 (1.38–2.26) | 1.60 (1.17–2.19) | 2.05 (1.41–3.00) |
| P for interaction = 0.41 | ||||||
aAdjusted for age, sex and education.
Table 2 presents the association of asthma with specific depressive symptoms. Asthma was associated with mood problems, lost interest and most strongly with tiredness across all continents. Associations with a reduced appetite and cognitive complaints were only meaningful in Asia and weaker in all the other continent samples.
Odds ratios (ORs) and 95% confidence intervals (CIs) for individual depressive symptoms according to asthma (overall sample and by continent)
| Mood problems | Lost interest | Tiredness | Reduced appetite | Slower thinking | |
|---|---|---|---|---|---|
| OR (95% CI)a | OR (95% CI)a | OR (95% CI)a | OR (95% CI)a | OR (95% CI)a | |
| Overall sample | 1.74 (1.78–2.11) | 1.99 (1.81–2.18) | 2.27 (2.07–2.49) | 1.59 (1.41–1.81) | 1.66 (1.45–1.89) |
| Europe | 1.66 (1.32–2.08) | 1.69 (1.30–2.18) | 1.85 (1.46–2.35) | 1.30 (0.91–1.87) | 0.98 (0.71–1.34) |
| Australia | 1.31 (1.07–1.62) | 1.43 (1.16–1.76) | 1.57 (1.29–1.93) | 1.62 (1.24–2.14) | 1.06 (0.81–1.39) |
| South America | 2.15 (1.84–2.51) | 2.23 (1.89–2.62) | 3.95 (3.29–4.73) | 1.32 (1.03–1.69) | 1.57 (1.20–2.04) |
| Asia | 2.01 (1.74–2.33) | 2.07 (1.77–2.42) | 2.12 (1.83–2.46) | 1.84 (1.54–2.20) | 2.01 (1.64–2.45) |
| Africa | 1.76 (1.47–2.11) | 1.58 (1.33–1.88) | 1.77 (1.51–2.06) | 1.31 (1.03–1.66) | 1.27 (1.01–1.60) |
aAdjusted for age, sex and education.
Figure 1 shows analyses by country. The associations between asthma and MDE were of positive and of reasonable magnitude in the majority of countries, i.e. an OR of 1.5 or higher was observed in 39 of 57 countries.
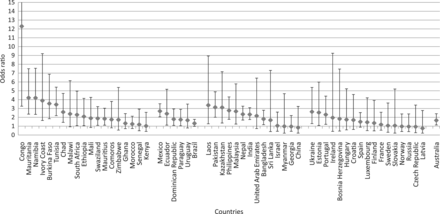
Odds ratio (OR) and 95% confidence intervals for a major depressive episode according to asthma by country; adjusted for age, sex and education
Wheezing
Reported attacks of wheezing or whistling breathing showed positive association with MDE (Table 3) in the overall sample (OR = 3.06, 95% CI = 2.75–3.40). Also, in this analysis, somewhat stronger associations were observed in South America, Asia and Africa (3- to 4-fold increased odds of MDE) than in Australia and Europe (about 2.5-fold increased odds). Associations did not substantially vary by sex in the pooled samples from Europe and Australia. In South America and Africa, associations tended to be stronger for men than for women. In Asia, men with asthma had considerably higher odds of depression than women with asthma (OR for men = 4.06, 95% CI = 3.08–5.34; OR for women = 2.04, 95% CI = 1.55–2.69; P for interaction = 0.00).
Odds ratios (ORs) and 95% confidence intervals (CIs) for a major depressive episode according to wheezing (overall sample and by continent)
| Women and men | Women | Men | ||||
|---|---|---|---|---|---|---|
| n | % with wheezing | % with MDE | OR (95% CI)a | OR (95% CI)a | OR (95% CI)a | |
| Overall sample | 245 727 | 10.3 | 8.4 | 3.06 (2.75–3.40) | 2.70 (2.35–3.10) | 3.72 (3.12–4.43) |
| P for interaction = 0.02 | ||||||
| Europe | 29 083 | 10.6 | 7.3 | 2.46 (1.97–3.08) | 2.57 (1.99–3.31) | 2.32 (1.44–3.75) |
| P for interaction = 0.70 | ||||||
| Australia | 3599 | 18.0 | 6.6 | 2.58 (1.83–3.63) | 2.75 (1.84–4.11) | 2.25 (1.19–4.27) |
| P for interaction = 0.55 | ||||||
| South America | 61 053 | 12.2 | 17.1 | 3.67 (3.01–4.48) | 3.42 (2.69–4.35) | 4.27 (3.04–5.98) |
| P for interaction = 0.31 | ||||||
| Asia | 77 882 | 9.5 | 7.1 | 2.81 (2.31–3.43) | 2.04 (1.55–2.69) | 4.06 (3.08–5.34) |
| P for interaction = 0.00 | ||||||
| Africa | 74 110 | 8.2 | 8.0 | 3.36 (2.81–4.02) | 3.01 (2.36–3.85) | 3.95 (2.95–5.29) |
| P for interaction = 0.27 | ||||||
aAdjusted for age, sex and education.
As Table 4 shows, wheezing was associated with all five individual MDE symptoms across all continents. Associations with tiredness were generally most pronounced.
OR and 95% CIs for individual depressive symptoms according to wheezing (overall sample and by continent)
| Mood problems | Lost interest | Tiredness | Reduced appetite | Slower thinking | |
|---|---|---|---|---|---|
| OR (95% CI)a | OR (95% CI)a | OR (95% CI)a | OR (95% CI)a | OR (95% CI)a | |
| Overall sample | 2.64 (2.43–2.87) | 2.72 (2.50–2.95) | 3.22 (2.95–3.51) | 1.97 (1.76–2.20) | 2.18 (1.97–2.42) |
| Europe | 2.50 (2.09–2.99) | 2.45 (2.02–2.98) | 2.78 (2.22–3.48) | 1.80 (1.40–2.31) | 1.43 (1.13–1.80) |
| Australia | 1.62 (1.32–1.99) | 1.73 (1.40–2.13) | 2.25 (1.85–2.74) | 2.22 (1.70–2.90) | 1.31 (1.01–1.70) |
| South America | 2.72 (2.34–3.16) | 3.10 (2.66–3.61) | 5.88 (4.89–7.08) | 1.73 (1.38–2.17) | 2.12 (1.69–2.66) |
| Asia | 2.58 (2.21–3.01) | 2.56 (2.21–2.96) | 2.87 (2.50–3.28) | 1.98 (1.67–2.35) | 2.46 (2.10–2.87) |
| Africa | 3.34 (2.92–3.81) | 3.36 (2.92–3.85) | 3.86 (3.37–4.42) | 1.69 (1.43–1.99) | 1.88 (1.61–2.20) |
aAdjusted for age, sex and education.
Analyses of the association between wheezing and MDE by country (Figure 2) showed few negative finding, and moderate to strong positive associations were generally observed across countries.
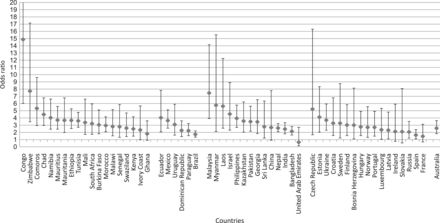
Odds ratios (ORs) and 95% confidence intervals for a major depressive episode according to wheezing by country; adjusted for age, sex and education
Discussion
The main finding of this study was that the co-occurrence of asthma or wheezing with depression is a universal phenomenon that can be observed in Australia, European, South American, Asian and African countries alike. This is despite the many differences between countries that may affect the rate of co-occurrence. Furthermore, asthma and wheezing were generally associated with MDE in both sexes. In the non-Western continents, these associations tended to be more pronounced in men than in women. Asthma showed strongest associations with mood problems, lost interest and tiredness across all continents, whereas wheezing was consistently related to each MDE symptom.
The positive relationship between wheezing and depression seemed to be more consistent across individual countries than the asthma–depression association. This is likely to be due to the higher prevalence of wheezing as compared with asthma, resulting in smaller CIs and thus an increased ability to detect an association. In addition to being more robust, the findings for wheezing are likely to have a higher validity than the results for self-reported physician diagnoses of asthma. First, a diagnosis requires access to health care. If, for example, a rural sub-sample of a national sample lacks access to health care, only very few individuals (some of which are classified as MDE, whereas others are not) may receive a diagnosis of asthma. As a result, any true association of asthma with MDE may be diluted. Second, there is no established gold standard for the diagnosis of asthma22,30; thus, differences in diagnostic criteria between countries may bias international comparisons when self-reports of a physician diagnosis are used. Wheezing, on the other hand, is a symptom rather than a physician diagnosis and is less likely to be affected by access to health care or diagnostic protocols. This core asthma symptom is therefore frequently used for cross-country prevalence comparisons, such as in the large multi-centre International Study of Asthma and Allergies in Childhood.31
Our findings are generally in line with those from the WMHS.2 As mentioned before, relevant methodological differences between the WHS and the WHMS include the definition of asthma, which was solely based on self-reported physician diagnosis in the WHMS report. Also, the range of countries was more restricted in the WMHS than in the WHS and lacked low-income countries. However, in the WMHS, depressive disorders were based on a fully structured diagnostic interview using DSM-IV criteria. The OR for all samples included in the WMHS indicated positive associations of asthma with both major depression (OR = 1.6, 95% CI = 1.4–1.8) and dysthymia (OR = 1.7, 95% CI = 1.4–2.1). Our pooled OR for the WHS sample might have been somewhat stronger because it was based on a relatively larger proportion of low-income countries. The asthma–depression association was generally higher in those countries in the WHS.
Our study suggested that associations between asthma and MDE might be somewhat more pronounced in men than in women in non-Western countries. One may speculate that in non-Western countries the context under which asthma and depression co-occur varies by sex (e.g., workplace-related exposures) or that the measurement approach to depression is not equally appropriate for both sexes, as has been documented for other widely used depression scales.32 Further, sex differences in reporting behaviour during interviews may partly explain the findings. This would imply, however, a greater propensity to over-report symptoms and disease in men than in women from non-Western countries. This would be in contrast with the widely held, but probably unfounded,33 expectation that in Western societies, higher over-reporting is observed in women than in men. More research is needed into the potential effect-modification of the asthma–depression association by sex and into potential explanations of this finding.
The main limitation of the WHS is its cross-sectional study design, which does not allow inferring causality from the observed associations. In this respect, it is important to note that both directions of causality have been suggested by longitudinal studies from Western countries, i.e. an effect of asthma leading to incident depression6,14 as well as an effect of depression predicting asthma through psychobiological and/or behavioural pathways.8,34–36 Longitudinal studies are needed to explore potential directions of causality in non-Western countries. Our estimates were not substantially affected by adjustment for BMI, smoking and physical activity, suggesting that these lifesytle-related variables are unlikely to provide explanations for the observed associations in the WHS. However, residual confounding, as well as unknown or unmeasured confounding, cannot be ruled out. For instance, data on identified shared physiological risk factors of asthma and depression were not available, which include genetic factors, inflammatory processes and autonomic nervous system dysregulation activity.37–44 Another potential limitation of the current study is that the sample sizes were small for some countries, which limited the statistical power and yielded a less robust estimate of association. Strengths of the WHS include the large pooled sample sizes, use of a diagnostic tool to classify MDE and the opportunity to explore the association between asthma and depression in 57 countries.
Our findings of a universal co-occurrence of asthma and depression are important in light of the frequently documented adverse impact of depression on asthma morbidity.7 Based on this evidence, potential screening of asthma patients for depression has gained attention.6,45 Although initial evidence is promising,46 it seems still unclear whether the screening for, and subsequent treatment of, depression in asthma patients is able to improve their asthma outcomes.7 If this was found to be the case, however, it must be kept in mind that asthma and depression seem to co-occur as much, or even more so, in non-Western as in Western regions of the world.
Supplementary Data
Supplementary Data are available at IJE online.
Acknowlegements
We thank David Litaker, MD, PhD, from Heidelberg University, Germany, and Case Western Reserve University, Cleveland, OH, USA, for providing comments on an early draft of this manuscript.
Conflict of interest: None declared.
Epidemiological studies in Western populations have established that asthma and wheezing are positively associated with depression. Until now very little data have been available about this comorbidity in non-Western countries.
Based on samples from 57 countries, we found that the co-occurrence of asthma and wheezing with depression is a universal phenomenon that can be observed in Western and non-Western countries alike.
For both asthma and wheezing, associations with depression tended to be stronger in South America, Asia and Africa than in Australia and Europe.

