


Abstract
Background The Millennium Cohort Study of UK babies born this century obtained maternal report of birth weight and data on the family's characteristics, including parental ethnicity, education, and social circumstances. Parental permission to link babies to their birth registration data provided the opportunity to investigate factors affecting accuracy of maternal recall of birth weight and to determine possible causes of error.
Methods Logistic regression was used to investigate the relationship between maternal factors and recall of birth weight. Numerical and graphical methods were used to identify potential causes for birth weight discrepancies.
Results Data were obtained from the birth registry and Millennium Cohort Study for 11 890 of the 14 294 cohort children born in England and Wales. Weight was reported in imperial units by 84% of mothers and this was more common in younger mothers. Accuracy within 100 g was 92% overall, varying from 94% among British/Irish white mothers to 69–89% for other ethnic groups and was lower among the long-term unemployed and those living in disadvantaged or ethnic wards. Explanations (mostly rounding and transcription errors) were identified for 27% of the discrepancies of 100 g or more.
Conclusion Mothers' reports of their infants' birth weight showed high level of agreement with registration data, the mean discrepancy being consistently close to zero. However, the variance of the discrepancy differed according to ethnic group, ward type, and socioeconomic status. These sources of differential variability should be taken into account in analyses using birth weight, and possibly other reported data, from socially mixed populations.
Birth weight is an important measure for assessing future growth patterns, and investigating both immediate health risks and those in later life. It is thus a key variable in any longitudinal study of child health. The weight is often obtained from maternal report. Several studies have shown that mothers recall their infants' birth weight with reasonable accuracy, with ∼90% of mothers reporting a figure within 200 g of that recorded on the birth register, even when the mother is interviewed several years after the birth.1–5 However, the extent to which accuracy is affected by ethnicity and social class in socially mixed populations is unclear. The Millennium Cohort Study (MCS) was disproportionally stratified in order to focus on characteristics of families living in disadvantaged areas of England, Wales, Scotland, and Northern Ireland, and in areas with a high ethnic minority in England. A large proportion of mothers agreed to linkage with the child's birth registration data. This allowed comparison of the birth weight reported by the mother with the registered weight, and an assessment of the factors that affect a mother's report of her child's birth weight in a contemporary multicultural sample.
Methods
Study population
The MCS is a longitudinal survey of social, economic, and health-related factors among babies born in the UK between September 2000 and January 2002. Stratification was based on electoral wards, defined as minority ethnic (≥30% of the total population ‘Black’ or ‘Asian’), disadvantaged (top quartile of the ward-based Child Poverty Index) or advantaged (not in the upper quartile of this index). Full information on the MCS and its sample design is described elsewhere.6
The cohort comprises 18 819 children (from 18 553 families) who were living in the UK at age 9 months. In this report we focus on children born in England and Wales since these are the only two UK countries where birth weight is recorded on the birth register. Interviews were conducted with 14 294 families, 11 533 in England and 2761 in Wales. These included 188 sets of twins and 6 sets of triplets, but, in order that each family was represented only once, analysis was restricted to the first born cohort child. Mothers were interviewed when the child was ∼9 months old and questioned on a large number of factors including the child's birth weight, whether the child was the first born, mother's age, socioeconomic status, self-reported ethnic group and educational qualifications, and whether English was the only language spoken at home. The mother's socioeconomic status was classified in accordance with the National Statistics Socio-economic Classification (NS-SEC). 7 Educational qualifications were categorized as degree, diploma in higher education, A/AS/S level, O level/GCSE grade A-C, GCSE grade D–G, other academic qualification (mainly from overseas), or none of these. Ethnicity was categorized in accordance with guidelines from the Office for National Statistics (ONS):8 British/Irish White, Other White, Mixed, Indian, Pakistani, Bangladeshi, Black Caribbean, Black African, and ‘Other’ ethnic group. Further information about these variables is available via the UK Data Archive (http://www.data-archireac.uk). Parents were given the option of reporting the weight in pounds or ounces (which was then converted into metric), or kilograms and grams. Most interviews were conducted in English, but if necessary and possible bilingual interviewers were specifically provided. If this was not possible a member of the family translated the questions.
Data linkage
At the end of the interview the mother was given a form asking for permission for researchers to have access to birth registration records. This form was provided in several languages. In England and Wales birth weight is obtained from the maternity hospital and recorded (in kilograms) on the birth register. Full details of the birth registration procedures have been reported elsewhere. 9 Birth weight is now measured routinely in metric units usually to 1 or 2 decimal places. Data linkage, for all those who agreed, was carried out by the ONS using the NHS number, baby's name, and mother's and baby's date of birth. Registration birth weights are routinely checked by the ONS office for implausible values, which if possible, are corrected in consultation with the registrar.
Statistical analysis
The characteristics of families for whom no registration data were available were examined and any significant differences (P ≤ 0.05) between the proportions were identified using Pearson's chi-square statistic with the Rao and Scott10 second order correction.
Multiple logistic regression, using a combination of forward and backward feature selection, was used to relate the odds of having a discrepancy ≥100 g with ethnic characteristics and social circumstances. The figure of 100 g was chosen as a difference in birth weight having physiological significance. Adjusted Wald tests were used to test for differences in means and regression coefficients.
In order to determine possible causes of discrepancy, MCS birth weights, which differed from those on the birth register by 100 g or more, were examined for any obvious recording errors. A check was made to see if the birth weight had been incorrectly entered as imperial rather than metric, or vice versa by dividing birth weights that had been reported in metric by 0.4536, and those originally recorded as imperial by 1/0.4536 and comparing the resulting figure with the registration birth weight. To check if pounds and ounces had been transposed in error, the original pounds and ounces figures were swapped and re-converted into kilograms. A scatterplot of the two weights, and a Bland Altman plot11 of their means and differences, were then examined in order to identify any other patterns of discrepancy (between the MCS and the registration birth weight).
All analyses were conducted using STATA 8.2 (Stata Corporation, Texas, USA), using sample weights and including SVY commands to allow for the design effect.12
Results
Birth registration data were obtained for 11 919 of the 14 294 children.
Registration data were unavailable at the time of this study if no valid consent was obtained from the mother (n = 1438), or if there were administrative (n = 859) or linkage problems (n = 78). Of those successfully linked, 11 890 had birth weights from both sources; 14 were missing from MCS and 15 from the birth register.
Overall 86% (weighted) of mothers reported the birth weight in pounds and ounces, with younger mothers more likely to use the imperial [mean age 28.7 years (95% confidence interval (CI) 28.5–29.0)] than the metric measure [mean age 30.2 years (29.7–30.7)].
Figure 1 shows a scatter plot of the MCS and registration weights for each baby. The mean weight of 3.36 kg was the same for both, and the mean difference between the MCS and registration weights was −1 g (SD 151 g) (Table 1). The mean MCS birth weight differed significantly between ethnic groups (P ≤ 0.001, Wald test adjusted for gestational age) with white mothers tending to have heavier babies than the other ethnic groups. However, within each ethnic group, the mean difference between the maternal report and registry recorded birth weight (shown in Table 1 in grams) was very small and did not differ significantly from zero. These differences were similar across all ethnic groups (although there was a significant (P < 0.001) difference between the absolute differences). Examination of histograms of the difference (MCS-registry weight) revealed that the distributions for all groups were symmetric, with very long tails with roughly the same number of negative differences (i.e. underestimates) as positive differences (overestimates) in each group.
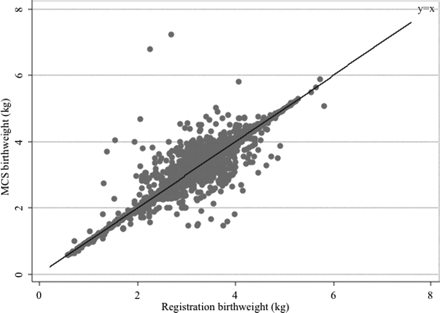
Scatter plot showing the MCS and registration weight for each baby with line of identity
Mean (SD) of the MCS and registration birth weights and their difference, MCS-register, by mother's ethnic group
| Ethnic group | MCS (kg) | Registration (kg) | Difference (g) |
|---|---|---|---|
| British/Irish white | 3.38 (0.58) | 3.38 (0.57) | −1 (135) |
| Other white | 3.43 (0.54) | 3.44 (0.52) | −8 (180) |
| Mixed | 3.27 (0.70) | 3.27 (0.71) | −41 (226) |
| Indian | 3.04 (0.61) | 3.04 (0.66) | 14 (207) |
| Pakistani | 3.12 (0.57) | 3.10 (0.55) | 10 (254) |
| Bangladeshi | 3.07 (0.58) | 3.11 (0.47) | 0 (214) |
| Black Caribbean | 3.17 (0.61) | 3.18 (0.58) | 15 (222) |
| Black African | 3.31 (0.62) | 3.33 (0.57) | −8 (249) |
| Other | 3.26 (0.60) | 3.27 (0.52) | −7 (230) |
| Total | 3.36 (0.58) | 3.36 (0.57) | −1 (151) |
Over 82% of mothers reported their baby's weight to within 30 g (∼1 oz) of the registration weight and 92% reported to within 100 g (Table 2). There was marked ethnic variation in the cumulative frequency of these absolute differences. For example, there was a significant difference (P ≤ 0.001) for a discrepancy of 100 g; with the proportion being 94% among infants of British/Irish White mothers as compared with 69% of infants of Bangladeshi mothers (Figure 2), 73% of Black Africans, 87% of ‘Other White’ (68% of those who stated that they were European) and 89% of Black Caribbeans.
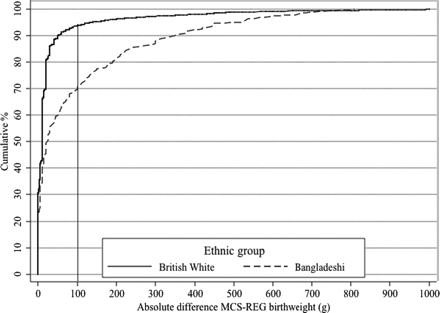
The cumulative distribution of absolute difference between MCS and register (REG) birth weight for the white and Bangladeshi mothers. The vertical line indicates a difference of 100 g between the birth weights
Absolute difference between the MCS and registration birth weight: frequency and percentage
| Absolute difference (g) | Frequency | Percentage (weighted) | Cumulative percentage |
|---|---|---|---|
| ≤10 | 9 543 | 82.4 | 82.4 |
| 30–60 | 867 | 7.0 | 89.4 |
| 60–100 | 391 | 3.0 | 92.4 |
| 100–200 | 397 | 2.8 | 95.1 |
| 200–300 | 197 | 1.3 | 96.4 |
| 300–400 | 128 | 0.9 | 97.3 |
| 400–500 | 116 | 0.9 | 98.3 |
| >500 | 251 | 1.7 | 100.0 |
| Total | 11 919 |
In 8% of infants the birth weights were discrepant by at least 100 g (referred to here as a discrepant weight), with the MCS weight lower than the registration weight in 53% of infants. The percentage of mothers with discrepant weights varied significantly according to ward type and ethnic group (Table 3) being highest for mothers in ethnic wards and for those not from a British/Irish White background. Mothers who had never worked and those with no academic qualifications had more discrepant weights, as did those who spoke a language other than English at home. The percentage of discrepant weights was higher among mothers reporting the weight in metric units. The mean age of mothers with discrepant weights was the same (29 years) as of those without.
Total numbers for each factor together with the (weighted) percentage of mothers reporting a birth weight ≥100 g different from that on the birth register
| Factor | Total in group | Percentage with 100 g difference | ||
|---|---|---|---|---|
| Country | ||||
| England | 9556 | 8 | ||
| Wales | 2334 | 6 | ||
| Ward Type | ||||
| Advantaged | 4695 | 6 | ||
| Disadvantaged | 5486 | 8 | ||
| Ethnic | 1709 | 21 | ||
| Ethnic Group | ||||
| British/Irish White | 9563 | 6 | ||
| Other white | 254 | 13 | ||
| Mixed | 150 | 13 | ||
| Indian | 325 | 12 | ||
| Pakistani | 606 | 18 | ||
| Bangladeshi | 245 | 31 | ||
| Black Caribbean | 188 | 11 | ||
| Black African | 269 | 27 | ||
| Other | 265 | 23 | ||
| Socioeconomic Status | ||||
| Managerial and professional | 3029 | 7 | ||
| Intermediate occupations | 1966 | 5 | ||
| Small employers | 460 | 8 | ||
| Lower supervisory and technical | 646 | 8 | ||
| Semi-routine and routine occupations | 4371 | 8 | ||
| Never worked and long-term unemployed | 1282 | 17 | ||
| Education | ||||
| Degree | 1758 | 7 | ||
| Diploma in higher education | 1038 | 6 | ||
| A/AS/S level | 983 | 7 | ||
| O level/GCSE grade A–C | 40% | 7 | ||
| GCSE grade D–G | 1404 | 6 | ||
| Other academic qualification | 343 | 18 | ||
| None of these | 2253 | 12 | ||
| Home language | ||||
| English only | 9938 | 6 | ||
| Other language | 1952 | 19 | ||
| Family order | ||||
| Cohort baby first born | 4896 | 6 | ||
| Cohort baby not first born | 6884 | 9 | ||
| Measure used | ||||
| Kilograms and grams | 1777 | 11 | ||
| Pounds and ounces | 10113 | 7 | ||
Missing number of cases for: ward type (0), country(0), ethnic group (40), socioeconomic status (197), education (49), language (0), family order (216).
Babies with discrepant weights had a slightly lower mean register birth weight (3.3 kg vs 3.4 kg (P ≤ 0.001)). The proportion of discrepant weights was significantly (P ≤ 0.001) higher among the 793 babies with registry weight <2.5 kg (11%) than among the 9857 weighing 2.5–4 kg (8%) or the 1240 weighing >4 kg (5%). Mothers with lighter babies tended to overestimate the weight and those with heavier babies to underestimate. The mean difference of MCS-registration weight was 45 g, −3 g, and −12 g, respectively for the above three birth weight categories and these differed significantly between the groups (P ≤ 0.001).
Table 4 shows adjusted odds ratios for the factors that significantly predicted a discrepant weight when the above factors were taken into account. Discrepant weights were significantly less likely for British/Irish White mothers, but significantly more likely for mothers who had other children or who lived in an ethnic ward. The likelihood of a discrepant weight decreased linearly with an increase in the registered weight of the baby. Employment was significant, with mothers who had recently worked in any type of employment being less likely to have discrepant weights than the long-term unemployed or never employed, but maternal education level was not significant after adjusting for socioeconomic status. The odds of a discrepancy when birth weight was reported in metric changed from 1.7 (95% CI 1.3–2.1) to 1.2 (1.0–1.5) when ethnicity was taken into account, since mothers who were not British/Irish White were more likely to report in metric. There was no evidence for difference according to mother's age at the child's birth.
Results of logistic regression showing odds ratios associated with an absolute difference ≥100 g between the registration and MCS birth weight
| Adjusted ORa | (95%CI) | |||
|---|---|---|---|---|
| Ward Type | ||||
| Advantaged | 1 | |||
| Disadvantaged | 1.1 | (0.9–1.4) | ||
| Ethnic | 16 | (1.2–2.2) | ||
| Registration birth weight | ||||
| For each 1 kg increase | 0.8 | (0.7–0.9) | ||
| Ethnic Group | ||||
| British/Irish white | 1 | |||
| Other white | 2.3 | (1.5–3.2) | ||
| Mixed | 2.03 | (1.1–3.7) | ||
| Indian | 1.63 | (1.0–2.6) | ||
| Pakistani | 2.1 | (1.5–3.1) | ||
| Bangladeshi | 3.65 | (2.4–5.7) | ||
| Black Caribbean | 1.37 | (0.9–2.2) | ||
| Black African | 4.1 | (2.8–6.0) | ||
| Other | 3.21 | (2.0–5.1) | ||
| Socio-economic status | ||||
| Managerial | 0.73 | (0.55–0.97) | ||
| Intermediate | 0.6 | (0.4–0.8) | ||
| Small employers | 0.8 | (0.5–1.2) | ||
| Lower supervisory | 0.8 | (0.5–1.2) | ||
| Semi-routine | 0.7 | (0.6–0.9) | ||
| Never worked and long-term unemployed | 1 | |||
| Whether first born | ||||
| Yes | ||||
| No | 1.5 | (1.3–1.8) | ||
Adjusted for the factors shown in this table.
When the logistic regression was repeated to include only the British/Irish White mothers, the odds ratios remained within one decimal point of those shown in Table 4, with the exception of the odds ratio for ethnic ward which increased from 1.6 to 2.0 ]. When the analysis was repeated after excluding the British/Irish White mothers, all the odds ratios that had been significant in Table 4 remained within one or two decimal places of the original odds ratios and all were now only significant at the 0.1 level, except for the odds ratio for registration birth weight which was no longer significant (P = 0.5). In addition, it was found that speaking another language other than English at home was significantly related to having a discrepant weight among minority ethnic mothers [OR = 1.62 (1.01–2.60)].
Explanations for birth weight discrepancies
Possible causes were identified for 295 (27%) of the 1089 discrepant weights (see Figure 3). The most common cause was rounding or truncating the MCS weight to the nearest kilogram (n = 52) or pound (n = 86) or half kilogram (n = 6) or half pound (n = 28). There were 27 cases where the pounds and ounces appeared to have been transposed and six with the weight recorded incorrectly as pounds and ounces instead of kilograms. A further 29 had a leading zero missing after the decimal point e.g. written as 1.2 kg rather than 1.02 kg. In 59 cases MCS weights had been recorded with a difference of one or more units from the registration weight; 19 in kilograms and 40 in pounds. This was the cause of the two large outliers at the top of Figure 1 which had been recorded by interviewers as 14 lb 15 oz and 15 lb 15 oz instead of 4 lb 15 oz and 5 lb 15 oz, respectively. The other identifiable cause was incorrect linkage of two children of multiple births due to misrecording of the birth order, either by the interviewer or the birth register. Explanations were found for 24% of the discrepant weights reported in imperial and 37% of those reported in metric.
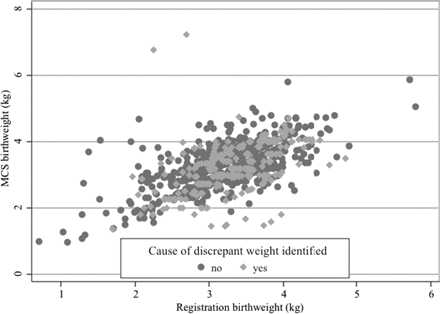
Scatter plot of discrepant birth weights, showing those with an identifiable cause
The only factors found to be independently related to having an identifiable error (given a discrepant weight) were; speaking another language at home [OR = 2.0 (95% CI 1.3–3.2)], reporting in kilograms [1.8 (1.2–2.6)], and mother's age at MCS birth [1.2 (1.1–1.4) for every 5 year increase].
Discussion
This large data set from the MCS provided the opportunity to investigate the influence of ethnic and social factors on mother's recall of birth weight. Over 92% of MCS mothers reported within 100 g of the weight recorded on the birth register which compares well with other recent UK studies, albeit that most studies were carried out when the children were older.
For example, O'Sullivan et al.4 interviewed mothers of 649 children aged 6–15 years and found that 85% recalled the birth weight to within 100 g of the hospital record weight. They found no significant association between the difference in birth weight (mother – hospital) with social class, but this may have been because they looked only at the means of the actual differences (which were symmetrically distributed around, and therefore close to, zero), rather than the magnitudes of the differences. Walton et al.5 reported that 85% of parents of 1015 children aged 12–15 years recalled the weight within 220 g of the computerized child health record. They looked at absolute differences and (as we did) found a significant relationship between accuracy and social class, with parents from manual occupations more likely to have greater discrepancies. In common with MCS mothers, parents of children with particularly low (<2.5 kg) birth weight reported their child's weight less accurately than those of ‘normal’ weight (2.5–4 kg) and tended to report them as heavier than the recorded weight. However, unlike MCS mothers, parents of children of high birth weight (>4 kg) were also less accurate.
Ours is the first UK study to consider maternal recall of birth weight in relation to ethnicity and language. The results suggest that ethnicity is a major influence, with British/Irish White mothers much more likely than any other ethnic group to accurately recall their child's birth weight. This could be due to difficulties in written or spoken English in other ethnic groups which may have caused miscommunication.
For example the midwife may have given the mother an accurate figure but the mother may have recorded or recalled it wrongly, or the interviewer may have misunderstood the mother. Alternatively, it could be due to cultural differences since remembering the exact weight, for example to report to family, friends and neighbours, may be more important in some cultures than others. We could find no reason (e.g. home language or partner's ethnicity) why mothers living in ethnic wards were more likely to have discrepancies than those living in advantaged or disadvantaged wards and can only surmise that this may be due to the cultural influences of living in an ethnically mixed neighbourhood.
Other factors relating to recall were socioeconomic status and birth order, with mothers who were long-term unemployed and whose baby was not the first born, being the most likely to have a significant discrepancy of 100 g or more.
It is surprising that so many, particularly, young mothers still report the weight in pounds and ounces, despite all babies being weighed in grams at birth and the fact that metric measures have been taught in British schools since 1974. One source of error could be incorrect conversion of the weight from grams into pounds and ounces, either by the mother or the midwife at the time of delivery. However, a higher proportion of discrepant weights were found among mothers who reported the weight in kilograms. This could be partly explained by the fact that ethnic groups were more likely to use metric measures. Another explanation is that rounding errors to the nearest kilogram would lead to a larger discrepancy between birth weights than rounding to the nearest pound. Of birth weights reported in pounds, 0.9% were identified as being rounded up or down to the nearest pound or half pound as opposed to 3.3% of those reported in kilograms.
It was not possible in this study to identify whether the discrepancies between the MCS and registration weight arose from incorrect recording by the interviewer or incorrect reporting by the mother. There was also no way of knowing if discrepancies were due to mother's incorrect recall, or due to an erroneous birth weight being provided at the time of birth.
A limitation of this study is that registration weights were obtained for only 84% of the MCS babies born in England and Wales. A preliminary investigation of the factors related to successful linkage (to be reported elsewhere) showed that most of the factors that were related to discrepancy in birth weight were also significantly related to non-linkage. For example, successful linkage differed according to ethnic group being highest among mothers who were British/Irish White (87%), and lowest among Asian women (≤72%).
We hope to have minimized any bias in the results of the logistic regression due to unequal linkage by including these factors in our model. There is also the issue of non-response bias. In an attempt to adjust for this in our analysis, the sample weights were modified to account for non-response.13 However, this had very little effect on the odds ratios and their confidence intervals, indicating that the factors identified as related to non-response (e.g. social and ethnic factors) were already accounted for in the original logistic regression analysis.
An issue that needs to be addressed is whether to use the mother's or registration birth weight in future analyses of the MCS data. One could use the registration figure when available, or alternatively use it just when there is a discrepant weight. However, this could lead to biased results, since registration data are available for only 64% of the MCS children. Also, we have no way of confirming that the registration weights themselves are correct. The register and reported weights had very similar mean values within each ethnic group, so using the reported weight should only introduce relatively random error rather than systematic bias. Therefore there is an advantage in using the reported weights which are more complete. We suggest that the registration weight should only be used if there is a very obvious error, for example, the two weights that were identified as having a discrepancy of 10 lbs, and that discrepant weights could be tagged so that they can be identified in future analyses.
The results of this study show that although mother's report of birth weight is generally very good, accuracy does differ according to individual factors such as maternal ethnicity, socioeconomic status and parity as well as the ethnic composition of the community in which they live. It is possible that these factors will also affect accuracy of other reported measures, not only birth weight, (a topic for further research) and this should be taken into account when designing studies or analysing data from socially mixed populations.
Reproduced with permission from Salisbury Maternity Services.
In a large birth cohort study of a socially and ethnically diverse population accuracy of birth weight was found to be generally high with 92% of cohort mothers reporting the weight within 100 g of the registration weight.
However, accuracy varies according to socioeconomic status and is significantly less in some ethnic groups.
This should be taken into account when designing surveys and analysing birth weight and other data from socially mixed populations.
We would like to thank all the Millennium Cohort families who provided the data for this study, Christine Hockley for providing us with the linked registration data, Lisa Calderwood for answering our numerous questions about the MCS data set and Alison Macfarlane on her helpful explanations of current birth weight recording processes. We also thank Professor Heather Joshi, director, and members of the Millennium Cohort Study Management Team at the Centre for Longitudinal Studies, Institute of Education, University of London and the ONS and Birth registration departments. The other members of the Millennium Cohort Study Child Health Group who contributed to this work are; Helen Bedford, Neville Butler, Lucy Griffiths, Catherine Peckham, Lamiya Samad and Suzanne Walton.
References
Tilley BC, Barnes AB, Bergstralh E et al. A comparison of pregnancy history recall and medical records—implications for retrospective studies.
Gayle HD, Yip R, Frank MJ, Nieburg P, Binkin NJ. Validation of maternally reported birth weights among 46,637 Tennessee WIC program participants.
Casey R, Rieckhoff M, Beebe SA, Pintomartin J. Obstetric and perinatal events—the accuracy of maternal report.
O'Sullivan JJ, Pearce MS, Parker L. Parental recall of birth weight: how accurate is it?
Walton KA, Murray LJ, Gallagher AM, Cran GW, Savage MJ, Boreham C. Parental recall of birthweight: A good proxy for recorded birthweight?
Centre for Longitudinal Studies. Millennium Cohort Study. Technical report. London: CLS, Institute of Education, University of London,
Rose D, Pevalin DA. A Researcher's Guide to the National Statistics Socio-economic Classification. London: Sage Publications,
ONS. Ethnic group statistics. a guide for the collection and classification of ethnicity data. Technical report.
Macfarlane A, Mugford M, Henderson J. Birth Counts: Statistics of Pregnancy and Childbirth. Norwich: The Stationery Office,
Rao JNK, Scott AJ. On chi-squared tests for multiway contingency-tables with cell proportions estimated from survey data.
Bland JM, Altman DG. Statistical-methods for assessing agreement between 2 methods of clinical measurement.

