


Abstract
Background Studies in several countries have estimated the prevalence of diarrhoea in the community. However, the use of different study designs and varying case definitions has made international comparisons difficult.
Methods Similar cross-sectional telephone surveys were conducted in Australia, Canada, Ireland (including Northern Ireland), and the United States over 12 month periods between 2000 and 2002. Each survey asked about diarrhoea in the four weeks before the interview. For this comparative analysis, uniform definitions were used.
Results Questionnaires were completed for 6087 respondents in Australia, 3496 in Canada, 9903 in Ireland, and 14 647 in the United States. In the four weeks prior to interview, at least one episode of diarrhoea was reported by 7.6% of respondents in Canada, 7.6% in the United States, 6.4% in Australia, and 3.4% in Ireland. The prevalence of diarrhoea was consistently higher in females. In all countries, the prevalence of diarrhoea was highest in children <5 years and lowest in persons ≥65 years of age. When diarrhoea and vomiting was considered, the prevalence was almost identical in the four studies (range: 2.0–2.6%). Despite different health care structures, a similar proportion of respondents sought medical care (approximately one in five). Antibiotic usage for the treatment of diarrhoea was reported by 8.3% of respondents in the United States, 5.6% in Ireland, 3.8% in Canada, and 3.6% in Australia.
Conclusions Diarrhoea is a common illness among persons in the community in Australia, Canada, Ireland, and the United States. With similar methodologies and a standard case definition, age and sex patterns and health care seeking behaviour were remarkably consistent between countries.
Diarrhoeal illness is common world-wide, causing a wide spectrum of signs and symptoms ranging from minor discomfort to dehydration which may result in death. Episodes of diarrhoea can also lead to subsequent ill health,1–3 particularly in more vulnerable groups such as children, older people, or those with an underlying disease. There are also substantial social and economic costs associated with the high frequency of diarrhoeal illness.4–6 Many of the cases are infectious, and are caused by a variety of viruses, bacteria, or protozoa.
Some information on the frequency of diarrhoeal illness is available from laboratory-based communicable disease reporting, outbreak surveillance, and other routine public health surveillance activities. However, these sources underestimate the burden of diarrhoeal illness as they usually only represent persons coming into contact with health services. For this reason, population-based studies have been conducted in several countries to obtain more comprehensive estimates of the prevalence of diarrhoeal illness in the community.7–17 While these studies provide important information on the epidemiology of diarrhoeal illness, the use of different study designs and varying case definitions has made international comparisons difficult.
Recently, several population-based studies to determine the burden of diarrhoeal illness have been conducted in Australia, Canada, Ireland (including Northern Ireland), and the United States. These employed similar methodologies and examined the epidemiology of diarrhoea, describing its frequency and the health-seeking behaviour of those reporting diarrhoeal illness. We used those data with standardized definitions to compare the community prevalence of diarrhoea with associated health-seeking behaviour in each of these four studies.
Methods
Cross-sectional telephone surveys were conducted in Australia, Canada, Ireland, and the United States over 12 month periods between 2000 and 2002. In each survey, a sample of telephone numbers was generated using random digit dialling or randomly selected from a list of residential telephone numbers. Within each private household contacted, one household member was selected for interview using the Kish grid18 or by asking to speak to the person next/last to celebrate a birthday. All interviews were conducted by non-medical, professional interviewers. Table 1 summarizes the study methodology employed in each survey; these methods are described in detail elsewhere.15–17,19
Telephone survey methodology, sample sizes, and co-operation rate
| Country | ||||||||
|---|---|---|---|---|---|---|---|---|
| Australia | Canada | Ireland (Northern Ireland and the Republic of Ireland) | United States | |||||
| Study period | September 2001–August 2002 | February 2001–January 2002 | December 2000–November 2001 | February 2000–January 2001 | ||||
| Study area | Entire population | Population of one municipality | Entire population | Population of selected counties in nine states | ||||
| Population in study area (million) | 19.0 | 0.5 | 5.3 | 32.9 | ||||
| Sampling method | ||||||||
| Household | Random digit dialling | Randomly selected telephone numbers | Random digit dialling | Random digit dialling | ||||
| Individual | Chosen by last birthday | Chosen by next birthday | Chosen by next birthday | Chosen by Kish grid18,a | ||||
| Sampling frame | All persons resident in private households with a fixed line telephone | All persons resident in private households with a telephone number in the electronic directory | All persons resident in private households with a fixed line telephone | All persons resident in private households with a fixed line telephone | ||||
| Languages | Arabic, Cantonese, English, Greek, Italian, Vietnamese, Mandarin | English | English | English | ||||
| Timing of interviews | Daytime/evenings/weekends | Daytime/evenings/weekends | Evenings/weekends | Daytime/evenings/weekends | ||||
| Contact attempts | up to 10 | up to 5 | up to 4 | up to 20 | ||||
| Sample size | 6087 | 3496 | 9903 | 14 647 | ||||
| Co-operation rate (%)b11 | 68.2 | 34.7 | 84.1 | 37.1 | ||||
| Statistical weighting | by area (i.e. states/territories), age, sex, household size, number of telephone lines in each household to the population of Australia | by age and sex to the population of study area | by age, sex, and jurisdiction to the population of Northern Ireland and the Republic of Ireland | by age, sex, site, and the number of residential telephone lines in each household to the population of the United States | ||||
A computer algorithm is used to select one household member, based upon the total number of males and females in the household.
The number of completed interviews divided by the number of completed interviews plus the number of non-interviews that involved the identification of, and contact with, an eligible respondent.
In Australia, OzFoodNet and the National Centre for Epidemiology and Population Health conducted a nationwide survey, covering a population of 19.0 million. The Canadian survey involved one municipality in Ontario and was carried out as part of Health Canada's ‘National Studies on Acute Gastrointestinal Illness’. The municipality was selected on the basis of convenience, as well as the fact that it contained a population of approximately 500 000 including both urban and rural populations. The study conducted in Ireland surveyed respondents in both Northern Ireland and the Republic of Ireland (total population of 5.3 million) and was a collaborative study involving surveillance, public health, food safety, and academic public health organizations. The survey in the United States was the third such survey to be conducted by the Centers for Disease Control and Prevention's (CDC) Foodborne Diseases Active Surveillance Network (FoodNet). FoodNet is the principal foodborne disease component of CDC's Emerging Infections Program (EIP), and the survey was administered in EIP sites (selected counties and states with a population of 32.9 million).
Each of the four surveys asked respondents about episodes of diarrhoea in the four weeks prior to interview. Respondents reporting diarrhoea in Australia, Canada, and the United States were asked to document the maximum number of stools in any 24 h period, while respondents in Ireland were asked to specify if they had ≥3 loose stools in any 24 h period. Those reporting diarrhoea were asked if they sought medical care and, if they had diarrhoea, whether or not they were asked to submit a stool sample, and if so, whether they had complied with that request. Antibiotic usage for the treatment of diarrhoea was determined in all of the surveys, and in Australia, Canada, and Ireland respondents were also asked about the use of other medication. In Canada, Ireland, and the United States all interviews were conducted in English. The Australian survey was conducted in English or six other languages (Table 1).
International comparison
We compared results from each of the four population surveys using uniform case definitions for diarrhoea and other key variables. Diarrhoea was defined as ≥3 loose stools or bowel movements in any 24 h period. Respondents who met the case definition reported having diarrhoea in the four weeks prior to interview. Respondents who said their diarrhoea was due to a chronic illness were excluded. The excluded cases represent only 0.9% (322/34 133) of the total number of respondents interviewed.
In Australia, Ireland, and the United States, data were weighted by age, sex and geographic location to make survey responses nationally representative (Table 1). The Canadian survey was weighted by age and sex to the population in the study area/municipality. In the United States data were also weighted by the number of residential telephone lines in each household. Data from the Australian survey were weighted by the number of residential telephone lines and the household size. Datasets were analysed independently in each country, and summary data were compiled for comparison.
A co-operation rate was used to compare the respondent's response in each survey. The co-operation rate was defined as the number of completed interviews divided by the number of completed interviews plus the number of non-interviews that involved the identification of, and contact with, an eligible respondent. Non-interviews included refusals, break-offs, interviews not conducted because of a language barrier, illness, or disability.
Results
Over a 12 month period, 6087 respondents were interviewed in Australia, 3496 in Canada, 9903 in Ireland, and 14 647 in the United States. The co-operation rate was highest in Ireland (84.1%), followed by Australia (67.5%), the United States (36.4%), and Canada (34.7%) (Table 1).
The prevalence of diarrhoea was highest in Canada and the United States, where 7.6% of respondents reported at least one episode of diarrhoea in the four weeks prior to interview (Table 2). Australia reported a prevalence of 6.4%. The lowest prevalence of diarrhoea was in Ireland (3.4%). The corresponding rates of diarrhoea per person per year were: Canada 0.99 (95% confidence interval (CI) 0.87–1.11), United Sates 0.99 (95% CI 0.90–1.01), Australia 0.83 (95% CI 0.70–0.90), and Ireland 0.44 (95% CI 0.40–0.49). Age standardization to the world population resulted in only a marginal change to the prevalence of diarrhoea in each country (Table 2).20
Prevalence of reporting diarrhoea in the four weeks prior to interview
| Country | ||||||||||||||||
|---|---|---|---|---|---|---|---|---|---|---|---|---|---|---|---|---|
| Australia | Canada | Ireland (Northern Ireland and the Republic of Ireland) | United States | |||||||||||||
| % | 95% CI | % | 95% CI | % | 95% CI | % | 95% CI | |||||||||
| Prevalencea in the four weeks prior to interview | 6.4 | 5.4–6.9 | 7.6 | 6.7–8.5 | 3.4 | 3.1–3.8 | 7.6 | 6.9–8.3 | ||||||||
| Standardized to the world population | 6.5 | – | 7.9 | – | 3.6 | – | 7.8 | – | ||||||||
| Sex | ||||||||||||||||
| Male | 5.5 | 4.2–6.3 | 6.2 | 5.1–7.4 | 2.7 | 2.3–3.2 | 7.2 | 6.1–8.3 | ||||||||
| Female | 7.2 | 5.9–7.9 | 9.0 | 7.6–10.3 | 4.2 | 3.7–4.8 | 8.0 | 7.2–8.8 | ||||||||
| Age group (years) | ||||||||||||||||
| <5 | 8.2 | 3.5–10.7 | 11.7 | 7.3–16.2 | 7.6 | 5.9–9.8 | 11.2 | 7.1–15.3 | ||||||||
| 5–14 | 4.8 | 2.4–6.1 | 5.2 | 3.2–7.2 | 4.7 | 3.8–5.8 | 8.3 | 5.5–11.1 | ||||||||
| 15–24 | 6.9 | 4.4–8.3 | 9.6 | 6.9–12.3 | 2.7 | 2.0–3.6 | 6.6 | 4.7–8.5 | ||||||||
| 25–44 | 7.8 | 5.8–8.9 | 8.2 | 6.6–9.9 | 3.8 | 3.2–4.6 | 8.6 | 7.5–9.7 | ||||||||
| 45–64 | 6.1 | 4.5–7.0 | 8.4 | 6.5–10.3 | 2.1 | 1.6–2.8 | 7.2 | 6.0–8.4 | ||||||||
| ≥65 | 3.6 | 1.8–4.5 | 3.9 | 2.2–5.6 | 1.7 | 1.1–2.6 | 3.9 | 2.8–5.0 | ||||||||
| Actual number of respondents reporting diarrhoea | 414 | 261 | 311 | 1064 | ||||||||||||
Weighted as specified in Table 1.
The prevalence of diarrhoea was consistently higher in females than in males (Table 2). As shown in Figure 1, age-specific patterns were also similar between countries. The highest prevalence of diarrhoea in all countries was among children <5 years of age. After the age of five, the prevalence declined, increased again in middle age and then declined in persons ≥65 years of age. In the United States, Australia, and Ireland a peak in the prevalence of diarrhoea was reported among persons 25–44 years of age. No such peak was identified in Canada. The lowest reported prevalence of diarrhoea in each country was among persons ≥65 years of age.
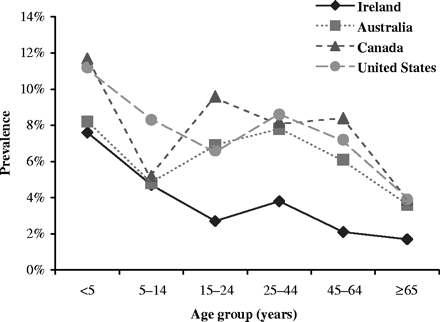
Age-specific prevalence of reporting diarrhoea in the four weeks prior to interview (age groups are unequal).
Three approaches were used to explore reasons for the lower prevalence of diarrhoea in Ireland. In the first approach, we attempted to correct for non-response by assuming that everyone who refused or was unable to participate in the surveys was symptom-free. Re-calculating the prevalence on this basis gave a prevalence of diarrhoea of 4.3% in Australia, 2.9% in Ireland, 2.8% the United States, and 2.6% in Canada.
In the second approach, we included additional symptoms to make a stricter case definition (Table 3). Including vomiting produced a similar prevalence in each country. In Australia, Canada, and Ireland, 2.0% of respondents reported ≥3 loose stools in any 24 h period for ≥1 day, with vomiting, in the four weeks prior to interview (Table 3). In the United States, 2.6% of respondents met this case definition.
Percentage of respondents eporting diarrhoea and vomiting, fever, or abdominal pain/cramps
| Country | ||||||||
|---|---|---|---|---|---|---|---|---|
| Australia(%) | Canada(%) | Ireland (Northern Ireland and the Republic of Ireland)(%) | United States(%) | |||||
| Percentage of respondents reporting ≥3 loose stools in 24 h | ||||||||
| with a duration ≥1 daya | 6.4 | 7.6 | 3.4 | 7.6 | ||||
| with vomiting | 2.0 | 2.0 | 2.0 | 2.6 | ||||
| with fever | 2.2 | 2.9 | 1.1 | 2.5 | ||||
| with abdominal pain/cramps | 4.0 | 6.0 | 2.1 | 5.0 | ||||
| Percentage of respondents reporting ≥3 loose stools in 24 h | ||||||||
| with a duration >3 days | 1.9 | 3.8 | 1.6 | 2.0 | ||||
| with vomiting | 0.6 | 1.2 | 0.9 | 0.8 | ||||
| with fever | 0.7 | 1.7 | 0.6 | 0.8 | ||||
| with abdominal pain/cramps | 1.1 | 3.1 | 1.0 | 1.3 | ||||
Case definition used in this paper.
The third approach narrowed the case definition by considering the duration of diarrhoea. Restricting the case definition to those respondents who reported ≥3 loose stools in any 24 h period for ≥3 days produced a similar prevalence in the United States (2.0%), Australia (1.9%), and Ireland (1.6%), but Canada had a higher prevalence (3.8%) (Table 3).
In each country, between 19.0 and 20.4% of respondents with ≥3 loose stools in any 24 h period reported seeking medical care (Table 4). The proportion seeking medical care was consistently higher in females compared with males. Each country observed an increasing trend in the proportion seeking care over the three age groups defined from age 25 years upwards. In the United States, 21.1% of those persons with diarrhoea who sought medical care were asked to submit a stool sample. This compared with 18.4% in Australia, 14.9% in Ireland, and 14.4% in Canada (Table 4). Of those submitting a stool sample, test results were known by one Canadian (Campylobacter) and four Australian (Campylobacter (3); Clostridium perfringens (1)) respondents. In Ireland, one respondent said a ‘bug’ had been identified, but was unable to recall its name. The survey conducted in the United States did not record information on the outcome of laboratory investigations.
Percentage visiting a medical person, being asked to and submitting a stool sample, and taking medication among respondents reporting diarrhoea
| Country | ||||||||||||||||
|---|---|---|---|---|---|---|---|---|---|---|---|---|---|---|---|---|
| Australia | Canada | Ireland (Northern Ireland and the Republic of Ireland) | United States | |||||||||||||
| Respondents reporting diarrhoea | % | 95% CI | % | 95% CI | % | 95% CI | % | 95% CI | ||||||||
| Who visited a medical person | 19.5 | 13.7–22.7 | 20.4 | 15.6–25.3 | 19.5 | 15.7–24.1 | 19.0 | 15.8–22.3 | ||||||||
| Sex | ||||||||||||||||
| Male | 16.4 | 7.4–21.2 | 18.2 | 10.9–25.6 | 18.2 | 12.5–25.6 | 18.2 | 13.0–23.4 | ||||||||
| Female | 21.9 | 14.3–26.0 | 21.9 | 15.5–28.3 | 20.4 | 15.5–26.3 | 19.7 | 15.7–23.7 | ||||||||
| Age group (years) | ||||||||||||||||
| <5 | 17.0 | 2.8–24.7 | 33.3 | 14.4–52.3 | 26.4 | 16.5–39.7 | 19.2 | 7.4–31.0 | ||||||||
| 5–14 | 49.1 | 24.2–62.6 | 44.6 | 4.9–64.3 | 15.8 | 9.3–25.6 | 16.9 | 10.2–29.6 | ||||||||
| 15–24 | 16.0 | 2.6–23.2 | 17.3 | 6.3–28.4 | 39.1 | 26.4–53.6 | 20.8 | 9.7–31.9 | ||||||||
| 25–44 | 6.6 | 2.2–9.1 | 11.3 | 4.6–18.0 | 8.6 | 4.6–15.5 | 16.2 | 11.6–20.8 | ||||||||
| 45–64 | 24.0 | 11.5–30.8 | 17.4 | 8.4–26.3 | 14.3 | 6.8–27.9 | 21.0 | 14.5–27.5 | ||||||||
| ≥65 | 37.2 | 14.0–49.7 | 32.4 | 11.7–53.1 | 33.3 | 17.2–54.9 | 28.7 | 15.1–42.3 | ||||||||
| Who visited a medical person and were asked to submit a stool sample | 18.4 | 6.2–24.9 | 14.4 | 5.1–23.7 | 14.9 | 8.3–25.4 | 21.1 | 14.1–28.1 | ||||||||
| Who reported taking antibiotics | 3.6 | 1.0–5.0 | 3.8 | 1.5–6.1 | 5.6 | 3.6–8.6 | 8.3 | 6.1–10.5 | ||||||||
| Who reported taking anti-diarrhoeals | 12.8 | 7.8–15.4 | 19.5 | 14.7–24.2 | 18.7 | 14.9–23.1 | – | – | ||||||||
| Who reported taking any medication | 37.9 | 30.6–41.9 | 73.1 | 67.8–78.4 | 45.8 | 40.8–51.1 | – | – | ||||||||
In the United States, 8.3% of respondents with diarrhoea reported taking antibiotics. In Ireland, 5.6% reported antibiotic usage, while a lower frequency of antibiotic use was reported in Canada (3.8%) and Australia (3.6%) (Table 4). The use of anti-diarrhoeal agents was reported by 19.5% of respondents with diarrhea in Canada, 18.7% of respondents in Ireland, and 12.8% in Australia. Data on anti-diarrhoeal agents and other medications were not available for the United States (Table 4).
Discussion
This is the first study comparing the prevalence of diarrhoea in the community in several developed countries. Until now, such comparisons had been hindered by the use of different study designs and case definitions. This study overcame these methodological issues by the use of similar cross-sectional telephone surveys and by standardizing the definition for cases and other key variables. In addition to the similarity in study design, each study was conducted over a 12 month period between 2000 and 2002.
Diarrhoea is a common illness among persons in the community in all four countries. The number of episodes per person per year varied from 0.44 in Ireland and 0.83 in Australia to 0.99 in Canada and the United Sates. Although different methodologies do not allow direct comparisons, these findings are within the range of other population-based studies conducted in other countries which indicate a prevalence of diarrhoea or gastrointestinal illness ranging from 0.18 to 1.51 episodes per person per year.7–12,14
The prevalence of diarrhoea in Ireland was approximately half of that reported in Australia, Canada, and the United States. In an attempt to explain this disparity, we corrected for non-response and modified the case definition by considering a longer duration of illness and incorporating other symptoms. When considering diarrhoea and vomiting together the prevalence was almost identical in all four countries. Because the prevalence was similar when using this stricter case definition, we speculate that cultural differences influenced the reporting of more moderate or mild illness. Thus, in Ireland respondents may not have reported more mild episodes of diarrhoea that were reported in the other three countries.
Although each study asked similar types of questions, there were slight differences in how the questions were worded and the order in which they were asked. For example, in Australia, Canada, and the United States, respondents reporting diarrhoea were asked about the maximum number of stools in any 24 h period, while in Ireland respondents were asked if they had ≥3 loose stools in any 24 h period. While the wording of questions could impact on the responses obtained, differences were relatively minor and are unlikely to explain the observed differences in the prevalence of diarrhoea.
Despite differences in the prevalence of diarrhoea, overall age and sex patterns were strikingly similar in all four countries. Each study reported a higher prevalence in females, the highest age-specific prevalence among children <5 years and the lowest among adults ≥65 years of age. These age and sex patterns have been reported elsewhere.8,9,12,14,21 In Australia, Ireland, and the United States, a peak was also observed in the 25–44 year age group. This has also been reported elsewhere,14,21 and may represent parents with young children who, because of the higher rates of diarrhoea in children, have a greater exposure to gastrointestinal pathogens. The similar prevalence of diarrhoea between countries suggests that age and sex patterns of diarrhoea within each country are valid.
It is interesting that, despite differences in the structure of and access to health care, the proportion of ill respondents seeking medical care was similar in each country. Also in each country, the proportion seeking medical care increased for persons between 25 and 44 years of age and persons ≥65 years of age. The frequency of stool sample requests ranged from 14.4 to 21.1%. Studies in England and Wales have reported rates of between 25 and 27%.8,10,11 We did not assess the impact of different health care systems on health-seeking behaviour and laboratory-testing policies, and future studies should address this issue.
Antibiotics are seldom required for the treatment of diarrhoea.22 However, the use of antibiotics was reported by a small proportion of respondents with diarrhoea in each of the four studies. This use of antibiotics is of particular concern in view of the increase in antibiotic resistant pathogens and the potential complications arising from taking antibiotics. The use of antibiotics is inappropriate for the treatment of diarrhoea of viral origin and is not indicated for the treatment of many bacterial infections, thus the results presented here may represent a greater use of antibiotics than necessary. This highlights the need to increase awareness among physicians and the general public about the limited role of antibiotics in the treatment of diarrhoea.
One limitation inherent in telephone surveys is that they exclude persons who do not have access to a fixed line telephone in their home. This may systematically exclude certain groups of people, such as persons of low socio-economic status. In addition, only those in private households were interviewed therefore excluding people resident in institutions (e.g. persons in jails and chronic healthcare facilities). In Canada, Ireland, and the United States, the study was limited to persons who spoke English, thus excluding a portion of the population. In Australia, the survey was conducted in seven languages. In Canada and the United States, co-operation rates were less then 40%, compared with 84.1% in Ireland and 68.2% in Australia. It is not known how non-responders compared with those who agreed to participate.
Conclusions
Diarrhoea is a common illness among persons in the community in Australia, Canada, Ireland, and the United States. With similar methodologies and a standard case definition for diarrhoea, age and sex patterns and health care seeking behaviour were remarkably consistent between countries. Ongoing disease surveillance and epidemiological studies are needed to identify risk factors and evaluate prevention and control measures aimed at reducing the burden of diarrhoeal illness.
We used standardized definitions to compare the prevalence of diarrhoea from cross-sectional population surveys conducted in Australia, Canada, Ireland, and the United States.
Diarrhoea is a common illness among persons in the community in Australia, Canada, Ireland, and the United States.
With similar methodologies and a standard case definition for diarrhoea, age and sex patterns and health care seeking behaviour were remarkably consistent between countries.
The authors would like to thank the members of the steering committees and working groups in each country who provided support and guidance to each of the surveys: in Australia, the OzFoodNet Working Group; in Canada, the NSAGI Steering Committee; in Northern Ireland and the Republic of Ireland, the Gastro Steering Committee; and in the United States, the Emerging Infections Program FoodNet Working Group.
The following agencies provided funding and support to the surveys. In Australia: the Australian Government Department of Health and Ageing. In Canada: the National Studies for Acute Gastrointestinal Illness (NSAGI) Initiative; the University of Guelph; the Foodborne, Waterborne, and Zoonotic Infections Division (Health Canada); the Centre for Evaluation of Medicines (St. Joseph's Hospital, Hamilton); and the City of Hamilton Social and Public Health Services Department. In Northern Ireland and the Republic of Ireland: the Food Safety Authority of Ireland; the National Disease Surveillance Centre; safefood-Food Safety Promotion Board; the Communicable Disease Surveillance Centre—Northern Ireland; the Department of Public Health Medicine and Epidemiology University College Dublin; and the Food Standards Agency—Northern Ireland. In the United States: the State Health Departments in California, Colorado, Connecticut, Georgia, New York, Maryland, Minnesota, Oregon, and Tennessee; the US Department of Agriculture; and Food and Drug Administration.
References
Neal KR, Hebden J, Spiller R. Prevalence of gastrointestinal symptoms six months after bacterial gastroenteritis and risk factors for development of the irritable bowel syndrome: postal survey of patients.
Cumberland P, Sethi D, Roderick PJ et al. The infectious intestinal disease study of England: a prospective evaluation of symptoms and health care use after an acute episode.
Helms M, Vastrup P, Gerner-Smidt P, Molbak K. Short and long term mortality associated with foodborne bacterial gastrointestinal infections: registry based study.
Roberts JA, Cumberland P, Sockett PN et al. The study of infectious intestinal disease in England: socio-economic impact.
Hellard ME, Sinclair MI, Harris AH, Kirk M, Fairley CK. Cost of community gastroenteritis.
Buzby JC, Roberts T. Economic costs and trade impacts of microbial foodborne illness.
Payment P, Richardson L, Siemiatycki J, Dewar R, Edwardes M, Franco E. A randomized trial to evaluate the risk of gastrointestinal disease due to consumption of drinking water meeting current microbiological standards.
Feldman RA, Banatvala N. The frequency of culturing stools from adults with diarrhoea in Great Britain.
Hoogenboom-Verdegaal AM, de Jong JC, During M, Hoogenveen R, Hoekstra JA. Community-based study of the incidence of gastrointestinal diseases in The Netherlands.
Palmer S, Houston H, Lervy B, Ribeiro D, Thomas P. Problems in the diagnosis of foodborne infection in general practice.
Wheeler JG, Sethi D, Cowden JM et al. Study of infectious intestinal disease in England: rates in the community, presenting to general practice, and reported to national surveillance. The Infectious Intestinal Disease Study Executive.
de Wit MA, Koopmans MP, Kortbeek LM et al. Sensor, a population-based cohort study on gastroenteritis in the Netherlands: incidence and etiology.
Herikstad H, Yang S, Van Gilder TJ et al. A population-based estimate of the burden of diarrheal illness in the United States: FoodNet 1996–1997.
Kuusi M, Aavitsland P, Gondrosen B, Kapperud G. Incidence of gastroenteritis in Norway—a population-based survey.
Imhoff B, Morse D, Shiferaw B et al. Burden of self-reported acute diarrheal illness in FoodNet surveillance areas, 1998–1999.
Majowicz SE, Doré K, Flint JA et al. Magnitude and Distribution of Acute, Self-Reported Gastrointestinal Illness in a Canadian Community.
Scallan E, Fitzgerald M, Collins C et al. Acute gastroenteritis in Northern Ireland and the Republic of Ireland: a telephone survey.
Kish L. A procedure for objective respondent selection within the household.
Hall G, Group OW. How much gastroenteritis is due to food? National Centre for Epidemiology and Population Health Working Paper. Canberra: The Australian National University,
Ahmad OB, Boschi-Pinto C, Lopez AD, Murray CJL, Lozano R, Inoue M. Age standardization of rates: a new WHO standard. GPE Discussion Paper Series No. 31. Geneva: World Health Organization. Available at: http://www3/whi.int/whosis/discussion_papers/discussion_papers.cfm)
Agency FS. A report of the study of infectious intestinal disease in England.

