


ABSTRACT
How has the mean paternal age in the USA changed over the past 4 decades?
The age at which men are fathering children in the USA has been increasing over time, although it varies by race, geographic region and paternal education level.
While the rise in mean maternal age and its implications for fertility, birth outcomes and public health have been well documented, little is known about paternal characteristics of births within the USA.
A retrospective data analysis of paternal age and reporting patterns for 168 867 480 live births within the USA since 1972 was conducted.
All live births within the USA collected through the National Vital Statistics System (NVSS) of the Centers for Disease Control and Prevention (CDC) were evaluated. Inverse probability weighting (IPW) was used to reduce bias due to missing paternal records.
Mean paternal age has increased over the past 44 years from 27.4 to 30.9 years. College education and Northeastern birth states were associated with higher paternal age. Racial/ethnic differences were also identified, whereby Asian fathers were the oldest and Black fathers were the youngest. The parental age difference (paternal age minus maternal age) has decreased over the past 44 years. Births to Black and Native American mothers were most often lacking paternal data, implying low paternal reporting. Paternal reporting was higher for older and more educated women.
Although we utilized IPW to reduce the impact of paternal reporting bias, our estimates may still be influenced by the missing data in the NVSS.
Paternal age is rising within the USA among all regions, races and education levels. Given the implications for offspring health and demographic patterns, further research on this trend is warranted.
No funding was received for this study and there are no competing interests.
N/A.
Introduction
Parental age influences reproductive outcomes. Older women have higher rates of primary and secondary infertility and are more likely to suffer from pregnancy complications such as gestational diabetes, pre-eclampsia and cesarean delivery (Paulson et al., 2012; Sauer, 2015). Recent studies have demonstrated that the mean ages of first union and first birth for women have been rising (Matthews and Hamilton, 2009; Manning et al., 2014). Indeed, women have delayed child-bearing since the 1970s, likely due to increased assimilation into the workforce, improved contraception, and better access to higher education, while ARTs have extended their reproductive window (de la Rochebrochard and Thonneau, 2002). In contrast, literature on paternal demographics remains limited given that most birth data are collected primarily at the maternal level. Since advanced paternal age has been associated with higher rates of chromosomal abnormalities, neurocognitive disorders and spontaneous abortions, there is a need to evaluate temporal trends in paternal demographics within the USA (de la Rochebrochard and Thonneau, 2002; Toriello and Meck, 2008; Wiener-Megnazi et al., 2012a; Reichenberg et al., 2017).
We utilized natality data from the National Center for Health Statistics (NCHS) to identify fathers of live births within the US from 1972 to 2015 and characterized trends in paternal age over time among different races and birth regions.
Materials and Methods
Data source
This study draws on data from the National Vital Statistics System (NVSS), an inter-governmental data sharing program that is provided by the NCHS of the Center for Disease Control (CDC). All institutions and birth attendants are required to file birth certificates reporting on parental demographics, pregnancy and infant health. This national initiative makes certificate data from nearly all live births within the USA publicly available. While legal jurisdiction over vitality records reside with individual states, contracts between the NCHS and vital registration systems within each state permit use of this data for medical research. Comprehensive birth data files were available from 1972 to 2015 (Schoendorf and Branum, 2006). This study was exempt from our Institutional Review Board approval as all data analyzed were de-identified.
Study cohort and outcome variables
Our study population included all reported births within the USA available through the NVSS from 1972 to 2015. Demographic variables for both parents for each birth were extracted, including age, race, education and birth state. The racial categories, provided by the NVSS, were defined by the US Office of Management and Budget (OMB) and are based on how individuals self-identify. States were regionalized as per the United States Census Bureau (Northeast, Midwest, South and West). Data on paternal education and offspring birth state were unavailable between 1994 and 2009, and after 2004, respectively, due to collection policy changes. Since 1985, 100% of births were reported; however, some states submitted a 50% sample of all births between 1972 and 1984. For these states, the reported data were double weighted using the inverse probability weighting (IPW) method to form statistical estimates accounting for births with incomplete reporting (Ali and Altman, 2016). A sensitivity analysis was also performed and presented to evaluate the effects of extreme imputations on the overall paternal age trends.
Statistical analysis
The annual natality data files from 1972 through 2015 were compiled into a single dataset. Temporal trends of paternal age, parental age difference (paternal age minus maternal age), and paternal reporting were calculated and presented in both tabular and graphic forms as means with standard deviations. Given the inconsistent reporting of paternal data on birth certificates by certain demographics, a logistic regression model was constructed to model the probability of paternal reporting for each birth as a function of maternal age, race, education level and reporting period. IPW was applied to observed paternal data in all statistical analyses to adjust for missing paternal data (Rosenbaum and Rubin, 1983; Ali and Altman, 2016). All statistical analysis was carried out using Stata version 14 (College Station, TX).
Results
A weighted total of 168 867 480 births were evaluated within the United States between 1972 and 2015. The mean age of fathers increased from 27.4 years to 30.9 years over the course of the study period (Fig. 1). The percentages of fathers of newborns older than 40 and 50 also increased from 4.1 and 0.5% to 8.9 and 0.9%, respectively (Table I). While mean paternal age of all races/ethnicities increased substantially, Asians were found to be the oldest while Blacks and Hispanics tended to be the youngest. Japanese fathers had the largest increase in mean age from 30.7 years in 1972 to 36.3 years in 2015.
Mean paternal age (in years) by paternal characteristics.
| 1972–1975 | 1976–1980 | 1981–1985 | 1986–1990 | 1991–1995 | 1996–2000 | 2001–2005 | 2006–2010 | 2011–2015 | ||
|---|---|---|---|---|---|---|---|---|---|---|
| Total births | 7 850 694 | 14 596 466 | 17 159 685 | 19 696 341 | 20 049 230 | 19 751 683 | 20 419 525 | 20 997 330 | 19 849 688 | |
| Mean age (SD) | 27.6 (6.3) | 27.9 (6.1) | 28.6 (6.1) | 29.4 (6.3) | 29.8 (6.6) | 30.2 (6.8) | 30.4 (6.8) | 30.6 (7.0) | 31.1 (6.9) | |
| Race/ethnicity | White | 27.6 (6.2) | 27.9 (5.9) | 28.6 (5.9) | 29.5 (6.1) | 29.9 (6.4) | 30.3 (6.6) | 30.5 (6.7) | 30.6 (6.8) | 31.1 (6.6) |
| Black | 27.2 (7.2) | 27.8 (6.9) | 28.3 (6.9) | 28.5 (7.1) | 28.6 (7.3) | 30.0 (7.5) | 29.4 (7.6) | 29.8 (7.9) | 30.4 (7.9) | |
| N. American | 27.6 (7.2) | 27.5 (6.9) | 27.9 (6.8) | 28.3 (6.8) | 28.3 (7.0) | 28.3 (7.2) | 28.4 (7.2) | 28.4 (7.2) | 28.9 (7.1) | |
| Chinese | 32.8 (6.2) | 32.4 (5.7) | 32.9 (5.5) | 33.5 (5.4) | 33.9 (5.5) | 34.4 (5.6) | 34.5 (5.7) | 34.8 (5.8) | 34.7 (6.0) | |
| Japanese | 30.8 (5.9) | 30.9 (5.5) | 31.5 (5.4) | 32.6 (5.6) | 33.6 (5.7) | 34.3 (6.0) | 34.6 (6.2) | 35.9 (6.1) | 36.0 (6.0) | |
| Hawaiian | 27.4 (6.4) | 27.7 (6.5) | 27.8 (6.5) | 28.0 (6.7) | 28.1 (6.9) | 28.4 (7.1) | 28.7 (7.0) | 29.7 (7.3) | 30.4 (7.2) | |
| Filipino | 31.9 (5.6) | 31.3 (5.9) | 31.2 (6.1) | 31.3 (6.1) | 31.4 (6.4) | 31.5 (6.5) | 31.8 (6.4) | 33.1 (7.2) | 33.9 (7.2) | |
| Asian Indian | * | * | * | * | * | * | * | 33.8 (4.8) | 34.2 (4.9) | |
| Korean | * | * | * | * | * | * | * | 34.3 (4.8) | 35.0 (5.0) | |
| Samoan | * | * | * | * | * | * | * | 29.2 (7.1) | 29.3 (6.6) | |
| Vietnamese | * | * | * | * | * | * | * | 35.6 (6.1) | 36.3 (6.7) | |
| Hispanic | * | * | * | 28.4 (6.6) | 28.3 (6.7) | 28.5 (6.8) | 28.7 (6.8) | 29.2 (7.0) | 30.0 (7.1) | |
| Paternal education | <High school | 27.5 (7.8) | 27.0 (7.5) | 26.9 (7.2) | 27.1 (7.1) | 27.1 (7.1)* | * | * | * | 29.2 (7.6) |
| High school | 27.0 (5.7) | 27.4 (5.6) | 28.0 (5.6) | 28.8 (5.8) | 29.2 (6.2)* | * | * | * | 29.8 (6.8) | |
| College | 30.7 (5.0) | 31.5 (4.7) | 32.5 (4.9) | 33.5 (5.2) | 34.1 (5.5)* | * | * | * | 33.5 (6.0) | |
| Region | Northeast | 28.4 (6.3) | 28.8 (6.1) | 29.4 (6.1) | 30.2 (6.2) | 30.9 (6.4) | 31.5 (6.7) | 31.8 (6.8)* | * | * |
| Midwest | 27.5 (6.2) | 27.8 (5.9) | 28.4 (5.8) | 29.3 (6.0) | 29.8 (6.3) | 30.1 (6.5) | 30.3 (6.5)* | * | * | |
| South | 27.3 (6.5) | 27.6 (6.2) | 28.2 (6.1) | 29.0 (6.3) | 29.3 (6.6) | 29.6 (6.8) | 29.8 (6.9)* | * | * | |
| West | 27.6 (6.4) | 28.0 (6.1) | 28.8 (6.2) | 29.5 (6.5) | 29.8 (6.8) | 30.1 (7.0) | 30.4 (7.0)* | * | * | |
| Advanced paternal age | >40 | 4.1% | 3.6% | 3.8% | 4.8% | 5.8% | 6.8% | 7.8% | 8.2% | 8.9% |
| (% of all annual births) | >45 | 1.5% | 1.3% | 1.3% | 1.4% | 1.7% | 2.0% | 2.3% | 2.6% | 2.9% |
| >50 | 0.5% | 0.5% | 0.5% | 0.5% | 0.5% | 0.6% | 0.7% | 0.8% | 0.9% |
*Data was unavailable. Asian Indian, Korean, Samoan, Vietnamese and Hispanic races were not considered specific categories on birth certificates during the earlier years of the study period. Paternal education was not reported nationally between 1994 and 2009 due to unreliability of the data. Regional birth data ceased being publicly available starting in 2004.
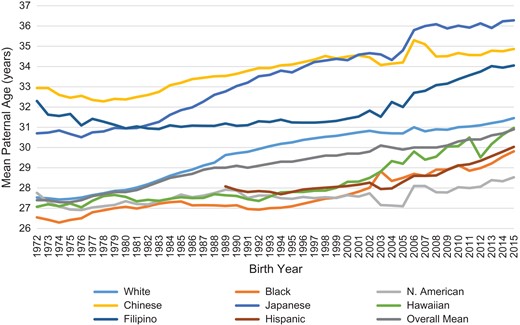
Temporal trend of mean paternal age by race from 1972 to 2015. Asian Indian, Korean, Samoan, and Vietnamese races were not included as they were not collected as distinct races until later in time. The Hispanic trend line begins in 1989, the first year during which this data was collected.
Fathers of less than high school, high school or college level education all displayed increases in mean paternal age over the study period. Fathers with college degrees were older, 33.3 years on average, compared to fathers with only a high school diploma, 29.2 years, between 2011 and 2015. These educational differences at the time of birth were present for all years within our study. Paternal age increased across all regions of the USA as well. On average, the Northeast had the oldest fathers (Table I).
The mean age difference between parents for all births dropped during the study period. In 1972, fathers were an average of 2.7 years older than the mothers of their children compared to 2.3 years in 2015. This trend appeared across all races (White, Black and Asian) (Table II).
Mean difference in parental age (paternal–maternal age, in years) by paternal characteristics.
| 1972–1975 | 1976–1980 | 1981–1985 | 1986–1990 | 1991–1995 | 1996–2000 | 2001–2005 | 2006–2010 | 2011–2015 | ||
|---|---|---|---|---|---|---|---|---|---|---|
| Race/ethnicity | White | 2.7 (3.9) | 2.6 (3.9) | 2.6 (4.1) | 2.5 (4.2) | 2.4 (4.4) | 2.4 (4.4) | 2.4 (4.3) | 2.4 (4.5) | 2.3 (4.4) |
| Black | 3.2 (3.9) | 3.2 (4.0) | 3.1 (4.0) | 3.0 (4.9) | 2.8 (4.0) | 3.0 (4.2) | 3.1 (4.3) | 3.1 (4.7) | 3.0 (4.7) | |
| N. American | 3.3 (4.8) | 3.2 (4.6) | 3.0 (4.7) | 2.9 (5.0) | 2.8 (4.6) | 2.7 (4.6) | 2.7 (4.5) | 2.7 (4.8) | 2.6 (4.7) | |
| Chinese | 4.8 (5.2) | 3.9 (4.6) | 3.5 (4.7) | 3.3 (4.5) | 3.1 (4.8) | 3.1 (4.7) | 3.0 (4.6) | 2.8 (4.5) | 2.8 (4.8) | |
| Japanese | 3.2 (4.2) | 2.8 (4.1) | 2.7 (4.0) | 2.7 (4.3) | 2.8 (4.7) | 2.8 (4.8) | 2.7 (4.6) | 2.7 (5.1) | 2.6 (4.8) | |
| Hawaiian | 2.9 (4.3) | 2.7 (4.5) | 2.6 (4.3) | 2.5 (4.5) | 2.5 (4.4) | 2.4 (4.4) | 2.3 (4.4) | 2.6 (4.9) | 2.6 (5.1) | |
| Filipino | 4.5 (4.6) | 3.4 (4.4) | 2.9 (4.4) | 2.6 (4.8) | 2.5 (4.8) | 2.5 (4.9) | 2.5 (4.9) | 2.6 (5.2) | 2.6 (4.9) | |
| Asian Indian | * | * | * | * | * | * | * | 3.7 (4.2) | 3.5 (4.2) | |
| Korean | * | * | * | * | * | * | * | 2.5 (3.8) | 2.4 (4.0) | |
| Samoan | * | * | * | * | * | * | * | 2.0 (4.8) | 1.6 (4.4) | |
| Vietnamese | * | * | * | * | * | * | * | 4.3 (5.4) | 4.6 (5.4) | |
| Hispanic | * | * | * | 2.7 (4.8) | 2.7 (4.8) | 2.7 (4.8) | 2.7 (4.8) | 2.6 (4.9) | 2.5 (4.9) | |
| Paternal education | <High school | 3.4 (4.6) | 3.2 (4.6) | 3.1 (4.7) | 2.9 (4.6) | 2.7 (4.6)* | * | * | * | 2.6 (4.9) |
| (1995 data not included) | High school | 2.6 (3.5) | 2.6 (3.7) | 2.6 (3.9) | 2.6 (4.2) | 2.5 (4.4)* | * | * | * | 2.5 (4.6) |
| College | 2.6 (3.8) | 2.5 (3.8) | 2.6 (4.1) | 2.7 (4.5) | 2.7 (4.7)* | * | * | * | 2.5 (4.6) | |
| Birth region | Northeast | 2.8 (3.9) | 2.7 (4.1) | 2.7 (4.3) | 2.7 (4.4) | 2.6 (4.5) | 2.6 (4.6) | 2.7 (4.7) | * | * |
| Midwest | 2.6 (3.7) | 2.5 (3.8) | 2.6 (3.9) | 2.5 (4.1) | 2.4 (4.2) | 2.4 (4.3) | 2.4 (4.4) | * | * | |
| South | 2.9 (4.0) | 2.8 (4.1) | 2.8 (4.2) | 2.7 (4.3) | 2.7 (4.4) | 2.7 (4.5) | 2.7 (4.6) | * | * | |
| West | 2.8 (4.2) | 2.7 (4.2) | 2.7 (4.4) | 2.7 (4.6) | 2.6 (4.7) | 2.6 (4.7) | 2.7 (4.7) | * | * |
*Data was unavailable. Asian Indian, Korean, Samoan, Vietnamese and Hispanic races were not considered specific categories on birth certificates during the earlier years of the study period. Paternal education was not reported nationally between 1994 and 2009 due to unreliability of the data. Regional birth data ceased being publicly available starting in 2004.
The proportion of paternal data reporting on all birth certificates is currently at 88.4% which is an increase from the nadir of 85.5% in 1991. The rate of reporting from 1985 to 2015 varied by the mother's race/ethnicity (e.g. White (90–93%), Black (58–71%) and Chinese (96–99%)). Importantly, the rate of paternal reporting for births to Black mothers has increased from 63.9% in 1985 to 70.9% in 2015. The nadir for White mothers was in 2007 at 89.3%. Paternal reporting also varied based on maternal age and education. Over the past decade, mothers younger than 20 years had the lowest proportion of reported paternal identity at 67.7% with Black mothers under 20 years reporting paternity only 50.4% of the time (Table III).
Percent of births with paternal reporting by maternal characteristics beginning in 1986 when 100% of all US births were reported.
| Total births with known paternity (% of reported births) | 1986–1990 | 1991–1995 | 1996–2000 | 2001–2005 | 2006–2010 | 2011–2015 | |
|---|---|---|---|---|---|---|---|
| Total | 17 093 959 (86.8) | 17 187 731 (85.7) | 17 179 742 (87.0) | 17 859 548 (87.5) | 18 293 984 (87.1) | 17 535 164 (88.3) | |
| Race/ethnicity* | White | 14 358 366 (91.8) | 14 382 295 (90.8) | 14 212 268 (90.9) | 12 868 171 (90.3) | 10 034 773 (90.8) | 12 672 012 (91.0) |
| Black | 1 956 769 (61.2) | 1 923 312 (59.1) | 1 927 970 (63.6) | 1 755 500 (65.0) | 1 337 682 (69.1) | 2 014 888 (70.1) | |
| N. American | 133 062 (72.0) | 136 899 (71.3) | 146 215 (73.6) | 149 463 (73.7) | 102 848 (79.77) | 149 054 (78.8) | |
| Chinese | 98 106 (98.7) | 124 370 (97.8) | 144 334 (97.4) | 154 819 (96.1) | 146 920 (96.9) | 250 516 (96.9) | |
| Japanese | 40 887 (97.5) | 43 357 (97.5) | 43 417 (97.6) | 39 432 (97.6) | 32 977 (98.2) | 35 815 (98.5) | |
| Hawaiian | 22 490 (82.8) | 24 793 (84.5) | 26 632 (87.8) | 15 209 (86.8) | 4 634 (87.9) | 4 898 (87.9) | |
| Filipino | 113 016 (96.87) | 140 332 (96.1) | 149 946 (95.7) | 148 311 (95.2) | 135 453 (96.1) | 155 872 (96.3) | |
| Asian Indian | * | * | * | * | 168 264 (98.5) | 290 531 (98.92) | |
| Korean | * | * | * | * | 60 923 (98.1) | 74 792 (98.4) | |
| Samoan | * | * | * | * | 8 183 (87.6) | 9 672 (87.9) | |
| Vietnamese | * | * | * | * | 84 869 (94.1) | 97 954 (94.3) | |
| Guam | * | * | * | * | 5 661 (88.0) | 6 525 (89.2) | |
| Hispanic | 998 419 (87.9) | 2 864 858 (87.3) | 3 244 327 (86.8) | 3 997 455 (87.1) | 4 474 038 (87.4) | 4 060 229 (88.2) | |
| Age of mother | <20 | 1 570 926 (63.2) | 1 635 093 (63.0) | 1 618 263 (65.9) | 1 454 789 (67.5) | 1 440 614 (67.9) | 960 751 (68.4) |
| 20–29 | 10 241 649 (88.1) | 9 357 225 (86.2) | 8 900 170 (86.8) | 9 156 957 (86.3) | 9 511 012 (85.9) | 8 774 001 (86.3) | |
| 30–39 | 5 090 799 (94.6) | 5 908 289 (94.0) | 6 267 759 (94.6) | 6 755 076 (94.8) | 6 813 795 (94.3) | 7 249 021 (94.3) | |
| >40 | 190 585 (93.2) | 287 124 (92.9) | 393 550 (93.3) | 492 726 (93.4) | 528 563 (93.0) | 551 391 (93.1) | |
| Maternal education | <High school | 2 502 162 (71.1) | 3 311 453 (72.4) | 3 162 905 (74.0) | 2 936 151 (76.0) | 2 277 181 (79.1) | 2 239 127 (77.4) |
| High school | 8 624 410 (88.1) | 9 789 127 (87.1) | 9 313 141 (87.7) | 8 093 264 (86.9) | 5 147 121 (86.4) | 7 684 076 (85.8) | |
| College | 2 769 976 (98.3) | 3 793 144 (98.2) | 4 475 717 (98.2) | 4 642 112 (98.1) | 4 033 673 (97.5) | 6 017 277 (97.6) |
*Data was unavailable. Asian Indian, Korean, Samoan, Vietnamese and Hispanic races were not considered specific categories on birth certificates during the earlier years of the study period.
Given the significant variation in paternal reporting, a sensitivity analysis was conducted to determine the influence of missing data. When all missing paternal ages were replaced with the minimum reported paternal age (11 years), mean paternal age still rose between 1972–1975 and 2011–2015 from 25.9 to 27.6 years. Mean paternal age also rose when the median (29 years) and maximum (88 years) ages were replaced, from 27.8 to 30.7 years, and from 33.9 to 40.9 years, respectively. Replacing the missing ages of Black fathers with the minimum paternal age or the missing ages of White fathers with the maximum paternal age did not affect the overall trend. When all Black fathers with unreported ages were assumed to be 11 years old, the mean paternal age increased from 27.5 to 31.0 years and the age of Black fathers in particular increased from 26.0 to 30.1 years over the study period. A similar analysis with White fathers also demonstrated an increasing temporal trend in paternal age over the study period.
Discussion
The mean paternal age in the USA has increased since 1972. This trend is present among all races/ethnicities, levels of educational attainment, and geographic regions in the USA. The current paternal age trend is similar to that reported for US mothers (Matthews and Hamilton, 2009; Martin et al., 2015). In addition, the age difference between fathers and mothers has declined over the past 4 decades. While paternal reporting on birth certificates has improved in recent years, paternal data remain absent on over 10% of births in the USA. Known paternity is associated with maternal characteristics (e.g. age, race and education). In an effort to reduce the bias introduced by paternal under-reporting, we utilized IPW to adjust our estimates. We also performed a sensitivity analysis to impute missing data by the minimum, median and maximum values of paternal ages. As expected, the paternal age was still found to rise and no qualitative changes in our results were noted.
Similar trends of increasing paternal age have been reported in other countries. In Germany, the median age of fathers was found to rise from 31.3 to 33.1 years between 1991 and 1999. Reasons cited for this delay were similar to those espoused by researchers within the USA: increased use of contraception, increased entry of women into the labor force, and longer life expectancy (Kühnert and Nieschlag, 2004). In England, a similar trend was noted with fathers aged 35–54 years accounting for 25% of live births in 1993 compared to 40% in 2003 (Bray et al., 2006). And between 1997 and 2007, the proportion of married men with a live birth between the ages of 45 and 49 was found to increase from 2.1 to 3.3% (‘Birth statistics: births and patterns of family building England and Wales (FM1),’ 2008). As in the USA, paternal age in these two European countries appeared to be increasing with more men fathering children in the fifth and sixth decades of their lives. A study from the National Health Statistics Report released a report in 2012 of cross sectional data involving paternal age of first birth during 2006–2010 (Martinez et al., 2012). The authors reported the mean age to be 25.1 years, unchanged from 2002. Similar to the current report, the authors identified a higher mean paternal age for first births in men with higher educational attainment. Changing demographics may help explain these findings. College educated fathers had the highest mean paternal age and may have delayed having children based on their or their partners’ career goals. However this correlation cannot be appropriately confirmed by our study and remains purely speculative. Regional differences were also apparent as the Northeastern and Western states had the highest mean paternal age.
In addition to implications for demographic and public health factors, in recent years, the impact of paternal aging directly on fetal health and pregnancy outcomes has been extensively studied (Matthews and Hamilton, 2009). As men age, the quality of their semen declines (Wiener-Megnazi et al., 2012; Johnson et al., 2015). In addition to delayed time to conception, the effects of advanced paternal age on offspring health can be significant. Numerous reports have found increased risk of autism, psychiatric illness, neurologic disease such as neurofibromatosis, pediatric cancer and chromosomal abnormalities in children born to older fathers (Bray et al., 2006; Croen et al., 2007; Puleo et al., 2012; Snajderova et al., 2012; Gratten et al., 2016). In fact, it is estimated that the male germline develops two mutations every year (Kong et al., 2012). Thus, as paternal age increases, the inherited mutations in the population will also rise which may have public health implications. Indeed, births to fathers over 40, a definition many researchers suggest constitutes an ‘older father’ has more than doubled over the past 4 decades and now comprises nearly 9% of all births in the USA (Bray et al., 2006; Toriello and Meck, 2008; Frans et al., 2015). Importantly, our study is limited to live births and thus will not include pregnancies ending in miscarriage (to which older men contribute a higher risk) (Bray et al., 2006).
However, there may also be benefits to increasing paternal age. The percentage of births with a known father, as specified by the child's birth certificate, has risen relatively concurrently with paternal age with a few exceptions. A report by the National Survey of Family Growth concluded that fathers aged 35–44 were indeed more likely to live with their children, thus having more involvement in child rearing, than fathers aged 15–24 (Jones and Mosher, 2013). Furthermore, evidence suggests that the presence of the father's name on a child's birth certificate is associated with improved fetal health and lower infant mortality, though the reason remains unknown (Gaudino et al., 1999). The rising rates of known paternity (especially among races with historically low paternal reporting) is certainly reassuring but deserves further investigation.
The limitations of the Vital Statistics System for perinatal research are well delineated. Although birth certificates are comprehensive for maternal and infant characteristics, data on the father are occasionally missing or incomplete. While missing data are associated with certain sociodemographic factors (e.g. maternal age, education and race), the trends of increasing paternal age were present across all demographic strata queried suggesting a universal trend. We also performed a sensitivity analysis substituting the highest and lowest possible paternal ages for births with missing data and identified similar temporal trends. In addition, as the racial/ethnicity categories varied over the study period, some trends may have experienced small fluctuations as categories were broadened. And finally, before 1985 some states only partially reported natality data detracting from the comprehensiveness of our findings.
Nevertheless, by utilizing the birth data from the NCHS and imputational analysis, we were able to identify the increasing paternal age over the past 44 years in the USA. Our findings substantiate the need for further research on the health and social implications of older fathers, as paternal age is indeed rising within the USA.
Authors’ roles
All authors made substantial contributions in the drafting of this article. All co-authors reviewed each draft of this study and made appropriate suggestions for its improvement. This article represents a fully collaborative work.
Funding
This study received no external funding from any agency in the public, commercial or not-for-profit sector.
Conflict of interest
None declared.
References
Birth statistics: births and patterns of family building England and Wales (FM1). Evol Heal Dis [Internet]
