


Abstract
Little is known about the predictors of maintenance in organized exercise programmes. The aim of this study was to investigate the behavioral predictors of maintenance of exercise participation in older adults, using an integrated social psychological model. To this end, we carried out a prospective cohort study (n = 1725; age 50 years or older) involving 10 different types of exercise programmes, with measurements at baseline and after 6 months. Predictors of intention to continue participating and the actual maintenance of exercise participation in the exercise programme were assessed using a step-wise logistic regression model. Significant odds ratios (ORs) predicting the intention to continue with the exercise programme were found for female sex, younger age, being married, being a non-smoker, being in paid employment, having a positive attitude towards exercise and having a high self-efficacy at baseline. Significant ORs predicting actual maintenance of exercise participation were short lapses, absence of lapses, high intention at baseline, high perceived quality of the programme, positive attitude at baseline and few risk situations at baseline. In order to promote maintenance of exercise participation for older adults, effort should be taken to prevent lapses, to help people cope with risk situations for lapses, to improve the attitude towards exercise participation and to improve the quality of the programme.
Introduction
Regular participation in exercise confers a variety of health benefits on older adults, such as improved cardiovascular, respiratory and muscular function, and a diminished risk of disease states (US Department of Health and Human Services, 1996; American College of Sports Medicine, 1998). However, despite the potential benefits of exercise, many people are still physically inactive. Although considerable effort has been put into promoting exercise programmes to increase levels of physical activity, less attention has been paid to ensuring that people continue to participate in these programmes. In the exercise promotion literature 6 months is often accepted as the time-frame for behavior change to become imbedded (Prochaska and DiClementi, 1983) and so we accept this time-frame as relevant to maintenance of exercise participation. Research shows that about 50% of the participants of exercise programmes drop out during the first 6 months (Carmody et al., 1980; Dishman, 1982; Oldridge et al., 1988; Dishman and Sallis, 1994). Very few theoretically driven studies have investigated predictors of maintenance of exercise participation among older adults (Rhodes et al., 1999), yet an understanding of these determinants is important because a physically active lifestyle can alter the course of frequently occurring chronic diseases. The aim of this study is to identify determinants of exercise maintenance in organized exercise programmes for seniors (i.e. people over 50 years of age).
Theoretical model for prediction of maintenance of exercise participation
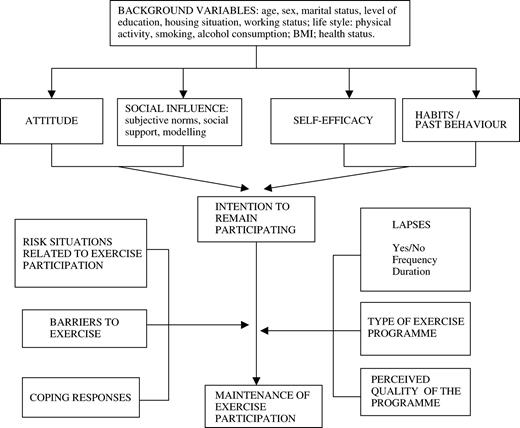
Several theoretical health behavior models have been developed to predict actual exercise participation, but few are available to predict maintenance of exercise participation. In this study, Bandura's Social Learning Theory (Bandura, 1986) has been used related to attitude and social influence, the Theory of Planned Behavior (Ajzen, 1991; Ajzen and Driver, 1992) was used related to self-efficacy, the Triandis model of past behavior (Triandis, 1977, 1979) was integrated related to past behavior, and the Relapse Prevention model (Marlatt and Gordon, 1985) was used related to (re)lapses, coping behavior and (perceived) risk situations. All these separate models were integrated to elaborate factors constituting an integrated social psychological model of exercise maintenance (Figure 1).
The adapted planned behavior model used in this study based on (1) Social Learning Theory (Bandura, 1986), (2) the Theory of Planned Behavior (Ajzen, 1991; Ajzen and Driver, 1992), (3) the model of past behavior (Triandis, 1977, 1979) and (4) the Relapse Prevention model (Marlatt and Gordon, 1980, 1985).
A central aspect of the Theory of Planned Behavior (Ajzen, 1991) is the individual's intention to perform a given behavior. Intentions are assumed to capture the motivational factors that influence behavior—they are indications of how hard people are willing to try, or how much effort they are planning to exert, in order to perform a behavior. The theory postulates three conceptually independent determinants of intention, i.e. attitude, social influences and self-efficacy. Attitude consists of the advantages and disadvantages of a particular behavior [referred to as outcome expectations in the Social Learning Theory of Bandura (Bandura, 1986)]. Social influences include subjective norms (beliefs of important referent people), perceived social support (support from others for a certain behavior) and modeling (perceived behavior of relevant others) (Ajzen and Fishbein, 1980; Bandura, 1986). Self-efficacy is the perceived ease or difficulty of performing a behavior (Bandura, 1986). It is assumed to reflect past experience as well as anticipated impediments and obstacles.
In the Theory of Planned Behavior, Ajzen (Ajzen, 1991) argues that the perceived behavioral control (PBC) and self-efficacy constructs are interchangeable. However, self-efficacy is more clearly defined and operationalized than is PBC. Moreover, while self-efficacy and PBC account for equivalent proportions of variance in behavior, self-efficacy explains somewhat more of the variance in intention than does PBC. Therefore, we have decided to include self-efficacy instead of PBC.
We also included past behavior (habits) in our model. A person's habits regarding a certain behavior are very important (Triandis, 1977, 1979), and several studies have shown that the inclusion of past behavior can improve the prediction of intention and/or behavior (Lechner and De Vries, 1995a,b). In turn, intention is considered an immediate antecedent of actual behavior—the stronger a person's intention to engage in a behavior or to achieve his or her behavioral goals, the more successful he or she will be. However, barriers such as lack of time or ill health may influence a person's intention to continue exercising such that he or she ultimately stops exercising (Ajzen and Fishbein, 1980). The ability to cope with situations in which reversion to an old behavior is likely may be an important predictor of maintenance of exercise participation. In Relapse Prevention theory, Marlatt and Gordon distinguish between a ‘lapse’ and a ‘relapse’—a lapse refers to a ‘slight error or slip’ (Marlatt and Gordon, 1985), whereas a relapse implies a breakdown in the person's efforts to control a particular problem (here, continuing exercise participation). Relapse is the act or instance of backsliding to the undesired behavior (Marlatt and Gordon, 1985). A lapse does not mean that an individual has totally relapsed into the old behavior. He or she may be able to cope with the reason for the lapse and to continue with the new behavior again. Lastly, we added two specific factors that may be important to the maintenance of exercise participation: type of exercise and perceived quality of the programme. The perceived quality was divided into three components: (1) quality of the instructor, (2) quality of the programme content and (3) quality of the programme conditions (price, distance to the accommodation, the accommodation itself, the time of day the programme is held, etc.).
Methods
Design
A prospective cohort study with baseline (before the start of the exercise programme) and follow-up measurements (6 months after the start) was performed to identify the predictors of maintenance of exercise participation in organized exercise programmes for older individuals (50-plus) living in the community.
Recruitment procedure and study population
In collaboration with four representatives of two important national organizations in the field of sports and physical activity in The Netherlands, i.e. Netherlands Institute of Sports and Physical Activity and Netherlands Olympic Committee/Netherlands Sports Confederation, 10 different types of exercise programmes in The Netherlands were identified which may be seen as representative for the organized exercise programmes for older adults in The Netherlands. Criteria for selection were based on (1) specific policy on exercise for older adults and (2) popularity among older adults. These exercise programmes include More Exercise for Seniors Gymnastics (being a low-to-moderate community-based group-wise exercise programme attracting mainly older women (65-plus), organized sports in sports clubs (specifically athletics, badminton, cycling, gymnastics, speed skating and table tennis), FysioSport (i.e. a fitness programme delivered by physical therapists/sports physical therapists), Exercise for Heart Patients and Walking for Sports (a group-wise walking programme).
The national organizations running these exercise programmes participated in the study, which facilitated data collection.
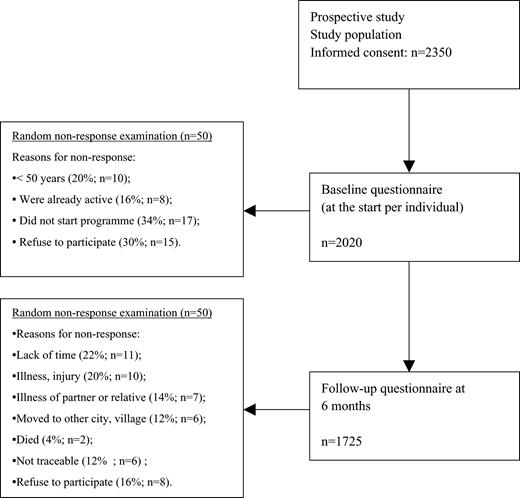
A network was set up for each exercise programme to recruit participants for the prospective study. Local organizations, clubs or groups were approached through the national organizations. Over a period of 15 months, all new members of the clubs or groups were asked to participate in the study. Participation is defined as ‘regularly taking part in an exercise programme’. Inclusion criteria were (1) ‘being older than 50’ and (2) ‘not being a member of an organized sports organization when joining the study’. The participants were asked for written informed consent before joining the study. To prevent bias among the participants, they were not told that the study investigated programme drop-out, but instead were told that the aim of the study was to increase the quality of the exercise programmes. They completed a baseline questionnaire (administered by post) before they started an exercise programme. Non-responders received a reminder after 3 weeks. After 6 months, all the participants who had returned the first questionnaire received a second postal questionnaire. Non-responders to the second questionnaire received a reminder after 3 weeks. Non-response research (conducted by computer-assisted telephone interviews among a random sample of 50 non-responders to both questionnaires) was carried out to check whether there were significant differences between responders and non-responders, and whether non-responders may have biased the final results (see Figure 2). The Medical Ethics Testing Committee of The Netherlands Organization for Applied Scientific Research (TNO) approved the study protocol.
Flow chart of the study. The information on non-response was based on a non-response examination of a random selection of 50 non-responders.
Measurements
Because this was one of the first studies to specifically investigate factors governing maintenance of exercise participation in an organized programme, existing measures were not appropriate so we had to develop some new ones. We performed a literature search and then held two focus-group interviews with people who had dropped out of earlier programmes, people who had continued to participate in exercise programmes and instructors of exercise programmes, to gather information about self-efficacy, risk situations, barriers and the quality aspects of an exercise programme (Stiggelbout and Hopman-Rock, 2002).
At baseline, information was collected on background variables: age (in years), sex (female/male), marital status (married living together, married living alone, unmarried living alone, never lived together and widowed), educational attainment [education was recoded in three categories: 1 = primary education, 2 = secondary education and 3 = higher education (college/university)], housing (living in a house, apartment building, service flat and elderly people's home) and source of income (paid employment versus other sources of income).
Physical activity was evaluated using questions derived from the Dutch Monitor on Physical Activity and Health (Ooijendijk et al., 2002), which covers compliance with Dutch public health guidelines (Kemper et al., 2000). These guidelines, which are based on international guidelines, recommend that all adults perform 30 min or more of moderate-intensity physical activity (such as brisk walking) on most, and preferably all, days—either in a single session or ‘accumulated’ in multiple bouts, each lasting at least 8–10 min (Pate et al., 1995; American College of Sports Medicine, 1998). This level of physical activity was considered to be the norm. Other lifestyle behaviors assessed were smoking (non-smokers, former smokers and smokers) and alcohol consumption (yes/no and how many glasses of alcohol a week). The participants were asked their weight and height, from which we calculated the body mass index (BMI; kg/m2).
Health status was measured using RAND-36, a multidimensional health questionnaire (Ware and Sherbourne, 1992), translated into Dutch (Zee van der and Sanderman, 1993). In this study, five of the nine subscales were used: vitality (reliability: Cronbach's α 0.82), pain (Cronbach's α 0.88), mental health (Cronbach's α 0.85), general feeling of health (Cronbach's α 0.81) and change in health status (a one-item subscale: no α available). Each subscale was scored 0–100, 100 being the best score. We chose these five subscales because earlier exercise studies showed the five subscales to be associated with exercise participation, and they were relatively easy to assess.
Determinants of physical activity/exercise behavior
To evaluate attitude, (perceived) social influence and self-efficacy, we developed questions related to physical activity/exercise behavior, based on Lechner and De Vries (Lechner and De Vries, 1995a,b). Scales derived from these questions were checked by four-point factor analysis and the consistency was computed. All questions were rated using a Likert-type scale.
Attitude was assessed by means of 10 questions on beliefs, such as ‘I think that participating in the exercise programme is…’. Answers on a four-point scale ranged from ‘very bad for health’ to ‘very healthy’, scored from 1 (very bad for health) to 4 (very healthy). Attitudes were found to be highly correlated and were treated as one scale (Cronbach's α 0.84).
Social influence was assessed with nine questions on the influence on exercise participation of the partner (three questions), friends (three questions) and relatives (three questions). These questions were related to (1) social norms: ‘What do they think about your taking part in an exercise programme’ [‘What is their opinion about your exercise participation?’]; five-point scale ranging from ‘very negative’ to ‘very positive’, scored from −2 to +2; (2) social support: ‘How much do they support your participation in the exercise programme?’; three-point scale ranging from ‘very little support’ to ‘a lot of support’, scored from −1 to +1; (3) modeling: ‘Do they exercise or take part in an exercise programme?’; four-point scale ranging from ‘no, never’ to ‘yes, always’, scored from +1 to +4. Because the partner's, relatives' and friends' influences were poorly correlated, all social influence items (social norms, support and modeling) were analyzed separately.
Self-efficacy was evaluated with 14 questions: ‘Imagine you have missed one or more exercise sessions, would you feel able to participate again?’. Answer categories were on a five-point Likert type scale, ranging from ‘certainly not’ to ‘certainly yes’. All these variables were scored from −2 (negative about continuation of exercise participation) to +2 (positive about continuation of exercise participation). The self-efficacy questions were highly correlated and were treated as one scale (Cronbach's α 0.81; the total score of the scale had a range from −28 to +28).
The intention to continue exercise participation was evaluated with the question ‘Do you intend to continue participating in the exercise programme in the coming 6 months?’. Because the answers had a skewed distribution, the answer categories were dichotomized: 0 (low intention) and 1 (high intention). In the questionnaire there was also a question about earlier participation in exercise programmes (with answer categories yes/no).
The questionnaire mentioned 19 barriers to maintain active in an exercise programme, such as ‘I usually have too little time’ and ‘I am not used to exertion’. Answers on a four-point scale were ranked from ‘not important barrier’ to ‘very important barrier’, scored from 1 (not important barrier) to 4 (very important barrier). The barriers were highly correlated and were treated as one factor (Cronbach's α 0.85; the total score of the factor had a range from 19 to 76).
In the follow-up questionnaire, the participants were asked whether they still took part in their exercise programme (no/yes). We had identified 14 risk situations that could influence maintenance of exercise participation. Participants were asked questions such as ‘If the weather was bad, did you continue to take part in the programme?’ and ‘If you were bored by the programme, did you continue with it?’. The answers on a four-point scale ranged from ‘no’ to ‘yes’, scored from 1 (no-risk situation) to 4 (high-risk situation). The risk situations were highly correlated and were treated as one scale (Cronbach's α 0.85; the total score of the scale ranged from 14 to 56). Coping was assessed using an adapted Dutch coping questionnaire containing 17 questions related to how people cope with specific problems (Tak et al., 1999). Questions asked were such as ‘Do you ask people for help?’, with an answer on a four-point scale, scored 1 (seldom) to 4 (very often). The coping questions were highly correlated and were treated as one factor (Cronbach's α 0.84; the total score of the factor had a range from 17 to 68). Three questions concerned lapses, i.e. the occurrence of lapses (yes/no), the number of lapses (N) and the duration of lapses (in weeks).
In general, exercise programme components may be divided into three main quality aspects: conditions of the programme (the accommodation, the price, accompany, etc.), content (type, intensity, duration, frequency) and guidance (trainer). For this reason we have divided the perceived quality into these three main components. The choice of all aspects related to the components was based on literature survey and the focus-group interviews (Stiggelbout and Hopman-Rock, 2002).
Answers were scored on a five-point scale ranging from ‘very negative (1)’ to ‘very good (5)’. The perceived quality variables were found to be highly correlated and were treated as one factor (Cronbach's α 0.92; the total score of the factor had a range from 20 to 100).
Statistical analyses
Only the data from patients who completed both questionnaires were analyzed. Factor analysis and consistency analysis (Cronbach's α) were used to check whether the scales were adequate to be used in the analysis. Attitude, social influence, self-efficacy, risk situation, coping, barriers and perceived quality of the programme were entered into the analysis as total scores.
The model of exercise maintenance predicted the intention to continue participation and the actual maintenance of exercise participation in the exercise programme. To predict determinants of intention (at a 0.05 level of significance) a step-wise logistic regression was applied with intention to continue participation as dependent variable (no/yes).
Because ‘attitude’, ‘social influence’, ‘self-efficacy’ and ‘habits’ were theoretically expected to be the most important predictive variables, they were entered first, followed by the background characteristics (age, sex, marital status, level of education, housing situation and work status), life-style (physical activity, smoking and alcohol consumption] and health status (BMI and health-related quality of life). Another step-wise logistic regression analysis was carried out to identify which significant determinants were most important in predicting self-reported continued exercise participation (at a 0.05 level of significance). Maintenance of exercise participation (yes/no) was used as dependent variable. It was defined here as ‘remaining to take part regularly in an exercise programme’.
‘Occurrence and period of lapses’, ‘perceived quality of the programme’, ‘risk situation’, ‘barriers’ and ‘coping responses’ were entered as independent variables in the first block, as they were expected to have the highest predictive value. ‘Intention to continue participation’ was entered in Block 2, ‘attitude’, ‘social influence’, ‘self-efficacy’ and ‘habits’ in Block 3, and background variables in Block 4. A difference was considered to be statistically significant when P < 0.05. SPSS 11.0 (SPPS, Chicago, IL) was used for analysis.
Results
More than 400 local intermediaries (exercise and sport instructors) agreed to recruit participants for the project. After recruitment, 2350 people gave informed consent and received the baseline questionnaire. Of these, 2020 returned the questionnaire; 1725 participants completed the follow-up questionnaire at 6 months. Only data for the latter participants were analyzed (Figure 2). The total response was 73% (1725 of 2350). The main reason for non-response to the first questionnaire was ‘not starting the programme after all’ (34%), followed by ‘refused to participate in the study’ (30%); the main reason for non-response to the second questionnaire was ‘lack of time’ (22%), followed by ‘illness/injury’ (20%).
Table I presents the characteristics of the study participants. There were similar numbers of men and women. The mean age was 60 years. Most participants were married, had had a lower to middle education, lived in a multi-storey house and received income from a source other than work. Only 33% of the participants complied with the national physical activity guideline and approximately 13% smoked. Participants scored higher on vitality than drop-outs.
Characteristics of subjects at baseline
Background variables | Adherers (n = 1475) | Drop-outs (n = 250) | Total (n = 1725) | |||
|---|---|---|---|---|---|---|
| Mean | SD | Mean | SD | Mean | SD | |
| Age (years) | 61.1 | 8.1 | 60.5 | 8.4 | 60.9 | 8.2 |
| % | N | % | N | % | N | |
| Sex | ||||||
| male | 49 | 723 | 45 | 113 | 48 | 836 |
| female | 51 | 752 | 55 | 137 | 52 | 889 |
| Marital status | ||||||
| married (living together) | 78 | 1151 | 78 | 195 | 78 | 1346 |
| divorced | 5 | 74 | 7 | 18 | 5 | 92 |
| widowed | 14 | 206 | 9 | 22 | 13 | 228 |
| never lived together | 3 | 44 | 6 | 15 | 3 | 59 |
| Level of education | ||||||
| higher education | 18 | 265 | 24 | 60 | 19 | 325 |
| secondary education | 41 | 605 | 49 | 123 | 42 | 728 |
| primary education | 41 | 605 | 27 | 67 | 39 | 672 |
| Housing situation | ||||||
| multi-storey house | 70 | 1032 | 73 | 183 | 70 | 1215 |
| house/apartment | 26 | 384 | 26 | 65 | 26 | 449 |
| service flat | 3 | 44 | 0.5 | 1 | 3 | 45 |
| living in elderly home | 1 | 15 | 0.5 | 1 | 1 | 16 |
| Working status | ||||||
| income from work | 38 | 538 | 41 | 100 | 38 | 638 |
| income from other source | 62 | 892 | 59 | 144 | 62 | 1036 |
| Life style factors | ||||||
| physical activity (% norm active)a | 33 | 487 | 30 | 75 | 33 | 562 |
| smoking | 12 | 177 | 16 | 40 | 13 | 217 |
| alcohol (glasses/week) | ||||||
| 0 | 27 | 398 | 27 | 67 | 27 | 465 |
| 1–5 | 39 | 575 | 38 | 95 | 39 | 670 |
| 6–10 | 22 | 325 | 20 | 50 | 22 | 375 |
| 11–21 | 10 | 147 | 12 | 30 | 10 | 177 |
| >21 | 2 | 30 | 3 | 8 | 2 | 38 |
| BMI | ||||||
| <20 | 3 | 44 | 6 | 15 | 3 | 59 |
| 20–25 | 43 | 634 | 36 | 90 | 42 | 724 |
| 25–30 | 43 | 634 | 48 | 120 | 44 | 754 |
| >30 | 11 | 162 | 10 | 25 | 11 | 187 |
| Mean | SD | Mean | SD | Mean | SD | |
| health status | ||||||
| pain | 67.5 | 16.5 | 64.3 | 17.7 | 67.0 | 16.7 |
| vitality | 83.2 | 19.8 | 77.9 | 20.1 | 82.4 | 19.9 |
| mental health | 75.6 | 15.2 | 73.6 | 15.8 | 75.3 | 15.3 |
| general feeling of health | 68.2 | 17.2 | 65.2 | 18.2 | 67.8 | 17.4 |
| change in health status | 55.4 | 20.2 | 53.4 | 21.2 | 55.1 | 20.4 |
χ2-test, aP < 0.01
Moderate activity for a minimum of 30 min at least 5 days a week (according to the guidelines).
Prediction of intention to continue exercise participation
Multivariate analysis showed female sex [odds ratio (OR) 1.81; 95% confidence interval (CI) 1.04–3.17], younger age (OR 1.07; CI 1.02–1.12), being married (OR 2.91; CI 1.10–7.69), being in paid employment (OR 4.97; CI 2.36–10.46), being a non-smoker (OR 3.23; CI 1.11–9.09), having a positive attitude at baseline (OR 3.30; CI 1.73–6.31) and having a high self-efficacy at baseline (OR 1.73; CI 1.09–2.75) to be significant and independent predictors of the intention to continue participation in the exercise programme (Table II). Paid employment became a more important predictor of intention when it is controlled by age in the model.
Estimate parameters [OR (CI)] of the step-wise logistic regression model of the intention (low/high) to maintain participating in the exercise programmes (n = 1358a)
Block 1 | Block 2 | |||||||||||||||
|---|---|---|---|---|---|---|---|---|---|---|---|---|---|---|---|---|
| Step 1 | Step 2 | Step 3 | Step 1 | Step 2 | Step 3 | Step 4 | Step 5 | Step 6 | ||||||||
| Attitudes | 3.42 (1.88–6.22) | 2.91 (1.58–5.36) | 2.29 (1.31–4.01) | 3.45 (1.84–6.46) | 3.40 (1.80–6.41) | 3.45 (1.82–6.56) | 3.56 (1.87–6.75) | 3.77 (1.98–7.18) | 3.30 (1.73–6.31) | |||||||
| Self-efficacy | 1.95 (1.26–3.03) | 2.29 (1.55–3.40) | 2.05 (1.32–3.19) | 1.92 (1.23–3.00) | 1.82 (1.17–2.85) | 1.74 (1.12–2.72) | 1.66 (1.05–2.61) | 1.73 (1.09–2.75) | ||||||||
| Income from | ||||||||||||||||
| no job | 1 | 1 | 1 | 1 | 1 | 1 | ||||||||||
| job | 2.76 (1.53–4.97) | 2.63 (1.44–4.82) | 4.47 (2.17–9.18) | 4.68 (2.26–9.69) | 4.72 (2.27–9.84) | 4.97 (2.36–10.46) | ||||||||||
| Marital status | ||||||||||||||||
| unmarried | 1 | 1 | 1 | 1 | 1 | |||||||||||
| married | 2.98 (1.20–7.42) | 3.5 (1.39–8.83) | 3.82 (1.50–9.74) | 3.16 (1.22–8.22) | 2.91 (1.10–7.69) | |||||||||||
| widowed | NS | NS | NS | NS | NS | |||||||||||
| Age | 1.06 (1.01–1.10) | 1.07 (1.02–1.11) | 1.07 (1.02–1.12) | 1.07 (1.02–1.12) | ||||||||||||
| Smoking | ||||||||||||||||
| yes | 1 | 1 | 1 | |||||||||||||
| no | 3.13 (1.10–9.09) | 3.13 (1.09–9.09) | 3.23 (1.11–9.09) | |||||||||||||
| Sex | ||||||||||||||||
| male | 1 | 1 | ||||||||||||||
| female | 1.77 (1.02–3.09) | 1.81 (1.04–3.17) | ||||||||||||||
Only the significant determinants are reported in the table.
Total does not add up to 1725, due to missing values
Prediction of maintenance of exercise participation
Absence of lapses (OR 6.6; CI 2.1–20.8), short duration of lapses (OR 9.0; CI 4.7–17.2), high intention at baseline (OR 3.9; CI 2.0–7.6), high perceived quality of programme (OR 2.7; CI 2.0–3.8), positive attitude at baseline (OR 1.9; CI 1.2–3.0) and few risk situations at baseline (OR 1.1; CI 1.01–1.14) were significant independent predictors of maintenance of exercise participation (Table III).
Estimate parameters [OR (CI)] of the step-wise logistic regression model of the maintenance of exercise participation in the exercise programmes (n = 1270a)
Block 1 | Block 2 | Block 3 | Block 4 | |||||||
|---|---|---|---|---|---|---|---|---|---|---|
| Step 1 | Step 2 | Step 3 | Step 4 | Step 1 | Step 1 | Step 1 | ||||
| Period of lapse | ||||||||||
| 1 week | 8.7 (4.7–16.1) | 8.5 (4.5–15.9) | 8.5 (4.5–15.9) | 8.2 (4.4–15.5) | 8.3 (4.4–15.9) | 9.0 (4.7–17.2) | 9.0 (4.7–17.2) | |||
| 2–3 weeks | 8.5 (4.8–15.2) | 8.1 (4.5–14.6) | 8.1 (4.5–14.7) | 8.1 (4.5–14.6) | 8.2 (4.5–14.9) | 8.3 (4.5–15.3) | 8.3 (4.5–15.3) | |||
| 4–6 weeks | 5.3 (2.7–10.4) | 5.6 (2.8–11.2) | 5.6 (2.8–11.2) | 5.3 (2.6–10.5) | 5.2 (2.6–10.5) | 5.1 (2.5–10.3) | 5.1 (2.5–10.3) | |||
| 6 weeks or more | 1 | 1 | 1 | 1 | 1 | 1 | 1 | |||
| Perceived quality of the programme | 2.6 (1.9–3.5) | 2.6 (1.9–3.5) | 2.6 (1.9–3.5) | 2.7 (1.9–3.6) | 2.5 (1.8–3.5) | 2.7 (2.0–3.8) | ||||
| Lapse | ||||||||||
| yes | 1 | 1 | 1 | 1 | 1 | |||||
| no | 6.4 (2.2–18.7) | 7.0 (2.4–20.5) | 7.2 (2.4–21.1) | 7.2 (2.4–21.5) | 6.6 (2.1–20.8) | |||||
| Risk situation | 1.1 (1.02–1.14) | 1.1 (1.03–1.14) | 1.1 (1.01–1.13) | 1.1 (1.01–1.14) | ||||||
| Intention to continue | ||||||||||
| low | 1 | 1 | 1 | |||||||
| high | 4.7 (2.5–9.1) | 4.3 (2.3–8.3) | 3.9 (2.0–7.6) | |||||||
| Attitude | 2.5 (1.5–3.7) | 1.9 (1.2–3.0) | ||||||||
Only the significant determinants are reported in the table.
Total does not add up to 1725, due to missing values
The occurrence and the number of lapses were important predictors of maintenance. Therefore we did additional step-wise logistic regression analyses for predictors of lapses. We found that there was a higher chance of lapses when there were more risk situations (OR 0.92; CI 0.89–0.95) and when participants had a lower self-efficacy (OR 1.45; CI 1.12–1.86). The chance of lapses was lower when the level of education was higher (OR 2.57; CI 1.80–3.64), when the vitality score was higher (OR 1.01; CI 1.01–1.02) and when there was less reported pain (OR 1.1; CI 1.01–1.02).
Discussion
We examined the predictors of the intention to continue participation in exercise programmes and the actual maintenance of exercise participation in organized exercise programmes for older adults (50-plus) at 6 months using an integrated social psychological model. We found that 85% of our study participants were still taking part in the exercise programme 6 months after they started. In the general population, about 50% of people who exercise are still exercising 6 months later (Carmody et al., 1980; Dishman, 1982; Dishman and Sallis, 1994). This difference in maintenance of exercise participation may partly be because we focused on organized exercise programmes. Older people often adhere better to a specific type of exercise, whereas younger people tend to change more often. Older people may have a stronger sense of responsibility, especially when social interaction is involved, such as in a group-based exercise programme. Moreover, they may also have more time than younger people to participate in such exercise programmes.
Predictors of the intention to continue participation were age, sex, marital status, smoking, work status, attitude and self-efficacy, and those of actual maintenance of exercise participation were the occurrence and duration of lapses, intention to continue participation in the programme, perceived quality of the exercise programme, number of risk situations, and attitude.
Intention to continue participation in the programme
According to McAuley and Courneya (McAuley and Courneya, 1993), key variables of exercise participation, derived from the Theory of Reasoned Action and Theory of Planned Behavior in the physical activity domain, are attitude, self-efficacy and intention. Attitude and self-efficacy are considered to be prime targets for intervention, because they affect an individual's intention to be physically active and ultimately his or her physical activity patterns. Consistent with this, we found that both attitude and self-efficacy were independent predictors of the intention to continue participation, which in turn was a predictor of actual maintenance of exercise participation. Some background variables (being married, in paid employment and female sex) were also significant independent predictors of the intention to continue participation in the exercise programme. Although the Theory of Planned Behavior states that social influence may be a predictor of intention, and therefore a predictor of maintenance (Oka et al., 1995), we found that social influence was not a predictor of either intended or actual maintenance of exercise participation. The inclusion of the measure of past behavior has been shown to account for an important role in physical activity intention and behavior, and may be seen as an important predictor (Hagger et al., 2002; Jackson et al., 2003). In our study, however, past behavior predicted neither the intention nor the maintenance of physical activity. The discrepancy may be due to the fact that most studies relate to exercise participation, whereas our study relates mainly to maintenance of exercise participation.
Maintenance of exercise participation
In the theoretical model, maintenance of exercise participation is predominantly determined by intention. Although this was partly the case, we found several factors to influence maintenance. For example, the perceived quality of the exercise programme was a predictor of maintenance of exercise participation. For this reason, an instrument should be developed to monitor the quality of exercise programmes, with a view to preventing people from dropping out because of ‘poor’ programmes. Because a positive attitude towards exercise participation at baseline was a predictor of maintenance of exercise participation, it may be worthwhile to highlight the positive effects of exercise participation to potential and new participants, in order to improve their attitude and indirectly decrease drop-out.
Both the occurrence and duration of lapses were predictors of maintenance of exercise participation. Analysis of the variables that predicted the occurrence of lapses revealed there to be a higher chance of lapses when there were more risk situations and when participants had a lower self-efficacy. There was a lower chance of lapses occurring when the level of education was higher, when the vitality score was higher and when there was less reported pain. Thus, although one might expect health to predict maintenance of exercise participation, we found that it had an indirect influence, by affecting the likelihood of lapses. Not only did more risk situations predict the occurrence of lapses, but a smaller number of risk situations was also an independent predictor of maintenance of exercise participation.
The Relapse Prevention theory of Marlatt and Gordon (Marlatt and Gordon, 1985) includes the identification of situations that are high-risk situations for lapses and training in problem solving to deal with risk situations. In a study of the effectiveness of relapse prevention training on maintenance of exercise participation, Marcus and Stanton (Marcus and Stanton, 1993) found that while their programme did not appear to promote continued participation, it decreased the number of lapses. Belisle et al. (Belisle et al., 1987) reported a small, but consistent, effect of the relapse training programme on maintenance of exercise participation. Thus, relapse prevention training appears to be a cost-effective means to increase maintenance of exercise participation. However, Belisle et al. studied younger adults and it would be necessary to carry out a similar study with older adults. Such a programme may be beneficial for older individuals because we found that lapses and a lower number of risk situations were important predictors of continued participation.
Self-efficacy is reported to be an independent predictor of maintenance of exercise participation (McAuley and Courneya, 1993; Oman and King, 1998; McAuley et al., 2003). However, we found it to be a predictor of the intention to continue participation and it was overruled in the final continued participation model (probably because intention was a predictor). Self-efficacy is a predictor of lapses, which in turn predict continued participation.
For the sake of this study we integrated a social psychological model. Our results show that the model offers sufficient relevant predictors for explaining exercise maintenance. However, there are some questionable factors.
Coping was no predictor of maintenance of exercise participation. In this case we took coping behavior in general into the questionnaire. It may be more relevant to take coping with risk situations into account. As this is more relevant as both risk situations as the occurrence of lapses are predictors of maintenance of exercise participation.
In the case of barriers to exercise it seems that there may be some overlap between the scales so that the influence of barriers is overshadowed by risk situations.
In this study the Theory of Planned Behavior and the Social Cognitive Theory grounded the development of the integrated model that we applied for explaining exercise maintenance. By doing so, our first interest was to uncover leads for improving exercise maintenance rather than to improve theory. Nevertheless, the results of the regressions analyses indicated a fairly good fit of the integrated model. A strength of the model is the inclusion of risk situations from the Relapse Prevention model which seem to have an important effect on maintenance together with lapses. In the Relapse Prevention model lapses and risk perceptions and situations are also important components. A limitation is the lack of influence of social influence; however, other studies have often found no effect of social influence.
Strength and limitations of the study
The paper has a number of strengths: it is prospective in nature, has a large sample size, relies on a representative population of older participants, considers a range of determinants that have been identified as important with respect to exercise behaviors and considers a range of types of organized programmes.
However, it also has some limitations, such a bias due to non-response (Figure 2), which means that the actual maintenance of exercise participation may have been higher than was suggested in our study. Although we included 10 different exercise programmes in the study, we did not include all exercise programmes for older adults in our study. Thus, the results of this study cannot be generalized to all exercise programmes for seniors. We assessed maintenance over 6 months, a time period generally accepted to reflect the time it takes exercise behavior to be imbedded (Prochaska and DiClementi, 1983). A longer follow-up period may have led to a higher drop-out rate. Moreover, a longer study would have been more expensive and it would have been more difficult to recruit organizations to participate.
Conclusions and recommendations
This study is one of the first to systematically investigate the predictors of the intention to continue participation in exercise programmes and the actual maintenance of exercise participation in organized exercise programmes for older adults (50-plus) using an integrated social psychological model. We found sex, age, marital status, smoking, working status, attitude and self-efficacy to be significant predictors of intention to continue participation at baseline. The occurrence and duration of lapses, the intention to continue participation, the perceived quality of the exercise programme, and baseline attitude were significant predictors of maintenance of exercise participation.
Thus, in order to promote the actual maintenance of exercise participation in organized exercise programmes for older adults, it is important to increase the intention of participants to continue participation, possibly by changing their attitude at baseline, and to see how participants cope with potential risk situations with a view to decreasing lapses. The perceived quality of the programme could be evaluated by means of a satisfaction questionnaire, because people are more inclined to drop out of a programme they consider to be of poor quality. Relapse prevention training may help to increase maintenance in exercise programmes for older people.
The authors would like to thank The Netherlands Health Research and Development Council (ZonMw) for financial support (grant 2200.0024). We would also like to thank all the guidance board, the intermediaries and, last but not least, all the participants in the study.
References
American College of Sports Medicine (
Ajzen, I. (
Ajzen, I. and Driver, B.L. (
Ajzen, I. and Fishbein, M. (
American College of Sports Medicine (
Bandura, A. (
Belisle, M., Roskies, E. and Levesque, J.M. (
Carmody, T.P., Senner, J.W., Malinow, M.R. and Matarazzo, J.D. (
Dishman, R.K. (
Dishman, R.K. and Sallis, J.F. (
Hagger, M.S., Chatzisarantis, N. and Biddle, S.J.H. (
Jackson, C., Smith, R.A. and Conner, M. (
Kemper, H.C.G., Ooijendijk, W.T.M. and Stiggelbout, M. (
Lechner, L. and De Vries, H. (
Lechner, L. and De Vries, H. (
Marcus, B.H. and Stanton, A.L. (
Marlatt, G.A. and Gordon, J.R. (
Marlatt, G.A. and Gordon, J.R. (
McAuley, E. and Courneya, K.S. (
McAuley, E., Jerome, G.J. and Elavsky, S. (
Oka, R.K., King, A.C. and Young, D.R. (
Oldridge, N.B., Guyatt, G.H., Fischer, M.E. and Rimm, A.A. (
Oman, R. and King, A.C. (
Ooijendijk, W.T.M., Hildebrandt, V.H. and Stiggelbout, M. (eds) (
Pate, R.R., Pratt, M., Blair, S.N., Haskell, W.L., Macera, C.A., Bouchard, C., Buchner, D., Ettinger, W., Heath, G.W., King, A.C., Kriska, A., Leon, A.S., Marcus, B.H., Morris, J., Paffenbarger, R.S., Jr, Patrick, K., Pollock, M.L., Rippe, J.M., Sallis, J., Wilmore, J.H. (
Prochaska, J.O. and DiClementi, C.C. (
Rhodes, R.E., Martin, A.D. and Taunton, J.E. (
Stiggelbout, M. and Hopman-Rock, M. (
Tak, E.P.C.M., Hopman-Rock, M., Westhoff, M.H. and Eck-van Hell van, L. (
Triandis, H.C. (
US Department of Health and Human Services (
Ware, J.E.J. and Sherbourne, C.D. (
Author notes
1TNO Quality of Life, Department of Physical Activity and Health, 2301 CE Leiden, 2Body@Work Research Center, Physical Activity, Work and Health, TNO, VU University Medical Center, 1081 BT Amsterdam, 3Faculty of Psychology, Open University of The Netherlands, 6401 DL Heerlen and 4Department of Public and Occupational Health, Institute for Research in Extramural Medicine, VU University Medical Centre, 1081 BT Amsterdam, The Netherlands