


Abstract
Background: Event-based measures suggest that emotional adversity in childhood has a long-term health impact, but less attention has been paid to chronic emotional stressors such as family conflict, harsh discipline or lack of affection. This study aimed to assess the impact of the latter on health problems and illness in adulthood. Methods: Logistic regression and multinomial logistic regression analyses of data collected in three UK national birth cohort studies at ages 43 and 16 years covering subjective report of relationship quality from the ‘child’, and number of health problems and illnesses reported in adulthood at ages 43, 33 and 26 years adjusted for social class, sex and, in 1946 and 1970 cohorts, for symptoms of mental illness. Results: Reports of abuse and neglect (1946 cohort), poor quality relationship with mother and father (1958 cohort), and a range of negative relationship descriptors (1970 cohort) predicted reports of three or more illnesses or health problems in adulthood. Results were inconsistent with respect to one or two illnesses or health problems. Adjustment for sex, social class and poor mental health attenuated the odds of poor health, but measures of relationship quality retained a significant independent effect. Conclusions: Poor quality parent–child relationships could be a remediable risk factor for poor health in adulthood.
Early life experience has been shown to be associated, through a wide range of hypothetical pathways, with adult health. One source of risk is adverse emotional experiences, e.g. parental separation. The latter has been shown to impair physical growth1 and educational attainment,2 both of which are associated with relatively poor health in adulthood. It has also been shown to predispose to adolescent behaviour disorders,3,4 which in turn are associated with risk of premature death and poor mental and physical health.5,6 These event-based measures of emotional adversity in childhood are likely to miss the effects of chronic emotional stressors such as family conflict,7 rejection,8 unreasonable control,9 harsh or inconsistent discipline,10 abuse,11 lack of emotional responsiveness12 and lack of affection.13 Measures of the latter predict social development,3,4,9,10 and mental7–9,11–15 and physical health15–31 in adulthood. Impact has been demonstrated on specific diseases, e.g. cancer,22 cardiovascular disease23 and musculoskeletal disorders,23 and on symptoms of poor health and ‘health in general’.25–31 Some, but not all, of these studies have taken account of the childhood socio-economic circumstances, which may be associated with poor quality family relationships and are also known to predict adult health.15
The results of these studies imply that the underlying mechanism is one in which poor quality relationships create increased susceptibility to a range of health problems and diseases. One such mechanism is suggested by animal studies, which show that lack of maternal care in early life reduces brain serotonin turnover and increases physiological reactivity to stress and aggression in monkeys,32 and that increased maternal care increases serotonin turnover and reduces reactivity to stress and fearfulness in rats.33 These biobehavioural effects may be associated with increased reactivity in the hypothalamic–pituitary access, causing chronically raised glucocorticoid levels, which increase susceptibility to a range of illnesses and health problems. A social mechanism is suggested by studies showing that parent–child relationships have an impact on social development and the quality of adult relationships,34 and that poor quality relationships in adulthood are detrimental to health.35–42 A third potential mechanism could operate through the impact of poor quality relationships in childhood on mental health in adulthood7–9,11–15 and the impact of mental health on physical health.43 These three mechanisms are not mutually exclusive.
The three UK national birth cohort studies whose populations have reached adulthood have all collected self-report measures of the quality of relationships in the home in childhood, gathered either towards the end of childhood or in adulthood, together with self-report measures of poor health, allowing further investigation of the impact of childhood family relationships on health in adulthood, taking into account socio-economic circumstances in childhood. Our hypothesis is that parent–child relationships that are perceived as poor in adolescence or adulthood will be associated with a greater burden of subsequent self-reported ill health attributable to the changes in the neurohumoral response, poor quality relationships and/or poor mental health in adulthood.
Methods
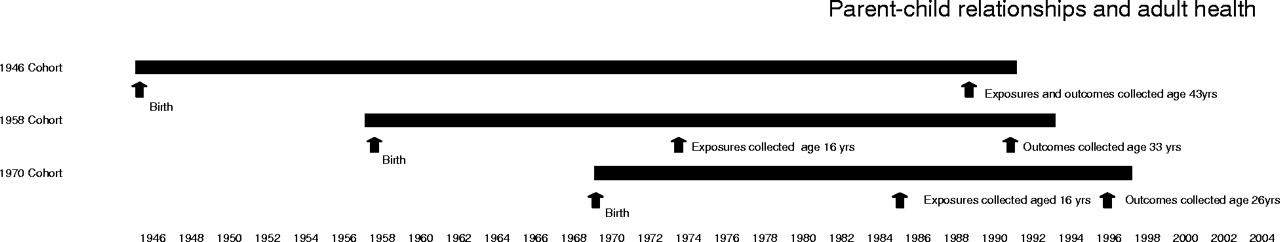
The first three UK birth cohort studies began by collecting data on all babies born in the UK during a single week, the first in 1946,44 the second in 195845 and the third in 1970.46,47 The earlier cohort differs from the other two in that only legitimate, singleton babies, those whose fathers worked in non-manual or agricultural occupations, and a randomly selected quarter of those born to parents in manual social classes, were selected for follow up. Attempts were made to follow up all members of the later two cohorts to adulthood. The analyses presented in this paper are based on subjects who had complete data on exposures and outcomes at age 43 years in the cross-sectional analyses on the 1946 cohort,48 at 16 years49 and 33 years50 in the longitudinal analyses on the 1958 cohort, and at age 16 years and 26 years in the longitudinal analyses in the 1970 cohort51 (table 1, figure 1).
Timing of data collection in the three cohorts
Percent of subjects reporting none, one, two or three or more health problems in the three cohort studies
| Cohort | n | None | One | Two | Three or more |
|---|---|---|---|---|---|
| 1946 (age 43 years) | 3254 | 16.0 | 21.0 | 21.0 | 42.0 |
| 1958 (age 33 years) | 7141 | 18.0 | 35.6 | 22.4 | 24.0 |
| 1970 (age 26 years) | 4493 | 31.0 | 28.3 | 19.0 | 21.7 |
| Cohort | n | None | One | Two | Three or more |
|---|---|---|---|---|---|
| 1946 (age 43 years) | 3254 | 16.0 | 21.0 | 21.0 | 42.0 |
| 1958 (age 33 years) | 7141 | 18.0 | 35.6 | 22.4 | 24.0 |
| 1970 (age 26 years) | 4493 | 31.0 | 28.3 | 19.0 | 21.7 |
Indicators of relationship quality
1946 cohort: cohort members aged 43 years responded to the question ‘as a child do you feel you were mistreated by your parents in any way?’ Open-ended comments were coded as ‘happy/normal’, ‘restricted/unhappy’ (4.5%) or 'neglected/abused (2.6%).
1958 cohort: at age 16 years cohort members were asked to respond in a self-completion questionnaire to the statements ‘I get on well with my mother’ and ‘I get on well with my father’. 5.1% responded untrue/very untrue with regard to their mothers and 8.0% with regard to their fathers.
1970 cohort: at age 16 years cohort members completed an inventory developed for the study modelled on questions in the Parental Bonding Instrument52 which asked ‘which of the following descriptions would you say fits best how you get on with your parent(s)?’ Five items described positive aspects of the relationship, and six items described negative aspects. Positive statements were endorsed more frequently than negative with 82.4% endorsing the statement ‘allow me freedom of action within reason’, 60.4% ‘are helpful/good in a crisis’, 18.3% ‘don't understand me/my motives’, 9.6% ‘treat me like a child’ and 7.1% ‘are strict, bossy, have too many rules’. Principal component analyses of these items failed to provide a satisfactory solution to enable the derivation of scale scores. As a result, in these analyses each statement was treated as an independent measure.
Number of common health problems or diseases
In all three cohorts (1946, age 43 years; 1958, age 33 years; 1970, age 26 years) members were asked if they suffered from any of a list of common health problems or diseases. Conditions covered in all three cohorts included asthma/wheezing, bronchitis, back pain/sciatica/lumbago, arthritis/painful joints, diabetes, epilepsy/convulsions, hay fever, bladder/kidney problems, migraine, stomach problems/indigestion, trouble with gums/teeth. 1958 and 1970 cohort subjects were asked about gynaecological/period problems; 1946 and 1958 about heart trouble and dizziness; 1946 and 1970 cohorts about depression/nervous or emotional problems, and 1970 about hearing or ear problems. The 1946 cohort were also asked about allergies, anaemia, cataracts/glaucoma, gall bladder or liver trouble, constipation, haemorrhoids, stroke, varicose veins and trouble sleeping. 1970 cohort subjects were asked to report other health problems. In the 1946 cohort, the relevant question related to recurrent health problems, in the 1958 and 1970 cohorts, to health problems in the last year. In all three cohorts, subjects were grouped into those reporting none, one, two or three or more health problems (table 1).
Subjects available for analyses (table 2)
Complete data on exposure and outcomes were available for 3254 (66.8% of those estimated to be alive and living in the UK) 1946 cohort members, 7141 (63.0%) 1958 cohort members and 4493 (38.5%) 1970 cohort members. In the 1958 cohort those included in the analyses differed from the entire group surveyed at age 16 years in that they were slightly less likely to be manual social class (62% compared with 65%), more likely to have been living with two biological parents (90% compared with 84%) and less likely to be male (49% compared with 52%). Such biases were evident to a greater degree in the 1970 cohort where comparable figures were manual social class (48.6% compared with 59.7%), living with two biological parents (81% compared with 76%) and male (39% compared with 52%). Subjects lost to follow up at 16 years in 1958 and 1970 cohorts and at 43 years in the 1946 cohort were more likely to be from the non-manual classes and to have been diagnosed as suffering from mental illness.48–51 In the 1970 cohort, models that included adjustment for depression were restricted to the 3399 subjects on whom data on was available on this confounding factor as well as on exposures and outcomes.
Number of subjects (% of those estimated to be alive and living in UK at that age) on whom data were available for analyses in each data sweep, and number on whom exposure and outcome data were available for analysis
| Cohort | |||||
|---|---|---|---|---|---|
| 1946 | 1958 | 1970 | |||
| Eligible at birth | 5958a (100%) | 16460 (100%) | 16995 (100%) | ||
| Contacted age 16 years | N/A | 12098 (72%) | 6349 (39%) | ||
| Contacted age 26/33/43 years | 3262 (67.0%) | 11407 (73%) | 9003 (56%) | ||
| Included in analyses | 3254 (66.8%) | 7141 (63%) | 4493 (38.5%)b | ||
a: Estimated from actual number (5362) selected for follow-up from those sampled at birth inflated to take account of the 90% contact rate at birth
b: 3399 in models including adjustment for teenage depression
Approach to analyses
In the 1946 cohort a series of logistic regression analyses were carried out to estimate the odds of one, two and three or more recurrent health problems compared to no health problems, first unadjusted, then adjusted for sex and social class and finally adjusted for sex, social class and current mental health problems using the psychiatric symptom frequency scale score (a 19 item self-report inventory covering symptoms of depression and anxiety).53 Adjustment for mental health status was undertaken to account for the possibility that current mental health could have an impact on perception of past circumstances, particularly the quality of childhood relationships. For the 1958 and 1970 cohorts, a series of multinomial logistic regression analyses was used to estimate the odds of reporting one, two or three or more health problems compared to none for each level/description of relationship quality. For the 1958 cohort, unadjusted odds are presented, followed by odds adjusted for sex and social class and finally adjusted for sex, social class and relationship with other parent. In the 1970 cohort, adjustment for sex, social class and teenage depression (using the 12 item GHQ,54 measured at 16 years, score, using the Likert method and dichotomised at a score of 10) attenuated the odds to only a slight extent and only the results of the fully adjusted model are presented. If social class age 16 was unavailable in the 1958 and 1970 cohorts, that recorded in the previous data sweep was used (age 11 and 10 years, respectively).
Results
Table 3 reports the odds of experiencing one, two or three or more recurrent health problems at 43 years according to mistreatment in childhood in the 1946 cohort. In the unadjusted analyses, the odds of experiencing either two or three or more health problems were very greatly raised in subjects who had experienced neglect or abuse. These odds were somewhat attenuated after adjusting for social class and sex, and attenuated still further after adjusting also for current mental health, but those who had been neglected or abused remained 15 times as likely to experience three or more recurrent health problems and nine times as likely to experience two health problems. Because of the relatively small number of subjects who experienced abuse or neglect (2.6% of the cohort) the confidence intervals for these odds are wide, indicating that the true values could lie anywhere between 1.28 and 69.64 (two health problems) and 2.05 and 110.27 (three or more health problems). Subjects who reported unhappy or restricted childhoods showed increased odds of experiencing three or more health problems in the first two models, but odds became non-significant after adjusting for concurrent mental health.
Odds of experiencing one, two or three or more recurrent health problems or diseases compared to none in subjects who experienced mistreatment in childhood (1946 cohort age 43 years)
| Childhood mistreatment | Odds of one health problem | Odds of two health problems | Odds of three or more health problems | |||
|---|---|---|---|---|---|---|
| OR (95% CI) | OR (95% CI) | OR (95% CI) | ||||
| Unadjusted (n = 3254a) | ||||||
| Normal/happy | 1.00 | 1.00 | 1.00 | |||
| Restricted/unhappy | 1.50 (0.79–2.88) | 1.20 (0.61–2.37) | 2.01 (1.13–3.58) | |||
| Neglected/abused | 2.88 (0.32–25.66) | 11.76 (1.61–86.11) | 22.06 (3.06–158.84) | |||
| P = 0.303 | P = 0.050 | P < 0.001 | ||||
| Adjusted for sex and social class (n = 3241a) | ||||||
| Normal/happy | 1.00 | 1.00 | 1.00 | |||
| Restricted/unhappy | 1.46 (0.76–2.79) | 1.18 (0.60–2.35) | 1.83 (1.02–3.29) | |||
| Neglected/abused | 3.16 (0.35–28.38) | 11.55 (1.58–84.74) | 18.97 (2.62–137.08) | |||
| P = 0.320 | P = 0.050 | P = 0.002 | ||||
| Adjusted for sex, social class and PSF (n = 3224) | ||||||
| Normal/happy | 1.00 | 1.00 | 1.00 | |||
| Restricted/unhappy | 1.47 (0.72–2.82) | 0.97 (0.41–2.27) | 1.46 (0.69–3.08) | |||
| Neglected/abused | 2.83 (0.31–25.63) | 9.41 (1.28–69.64) | 15.04 (2.05,110.27) | |||
| P = 0.340 | P = 0.090 | P = 0.020 | ||||
a: Analyses restricted to the 3224 cases on whom social class and PSF data were available gave very similar results
PSF, Psychiatric Symptom Frequency scale score;53 OR, odds ratio; CI, confidence interval
Table 4 reports the odds of experiencing multiple health problems age 33 years in the 1958 cohort according to the quality of the mother–child relationship at 16 years. Table 5 presents the same analyses for relationship with father. Both the unadjusted analyses, and those adjusted for social class and sex show an increased odds of reporting three or more health problems age 33 years among those who reported a poor/very poor relationship with their mother. After adjusting for relationship with father the odds ceased to be significantly raised. There was no increased risk in these models for two or fewer health problems or diseases. Table 5 suggests a greater health impact of a poor relationship with father. For those who reported a poor/very poor relationship, the odds of three or more health problems were raised, by 60–80% in all three models, as were the odds of one health problem (40%). Those reporting uncertainty about their relationship with their father also had increased odds of reporting three or more health problems in all three models (40–50%). In a series of analyses, which examined results for men and women separately (not shown), the effect was demonstrated to be stronger in women than men.
Multinomial regression reporting odds of one, two and three or more health problems or diseases in the previous 12 months compared to none, in subjects who reported on the quality of relationship with their mother at 16 years (unadjusted and adjusted models; 1958 cohort aged 33 years)
| Do you get on well with your mother? | Odds of one health problem | Odds of two health problems | Odds of three or more health problems | |||
|---|---|---|---|---|---|---|
| OR (95% CI); P value | OR (95% CI); P value | OR (95% CI); P value | ||||
| Unadjusted (n = 7141) | ||||||
| Very true/True | 1.00 | 1.00 | 1.00 | |||
| Uncertain | 1.05 (0.82–1.36); 0.689 | 1.14 (0.87–1.50); 0.343 | 1.1 (0.9–1.5); 0.348 | |||
| Untrue/very untrue | 1.03 (0.75–1.43); 0.844 | 1.06 (0.75–1.52); 0.731 | 1.6 (1.1–2.2); 0.006 | |||
| Statistics for model | χ2 = 13.75 d.f. 6; P < 0.033 | |||||
| Adjusted for sex and social class (n = 7141) | ||||||
| Very true/True | 1.00 | 1.00 | 1.00 | |||
| Uncertain | 1.05 (0.82–1.36); 0.688 | 1.13 (0.86–1.49); 0.365 | 1.11 (0.85–1.47); 0.430 | |||
| Untrue or very untrue | 1.03 (0.7–1.4); 0.843 | 1.05 (0.73–1.49); 0.806 | 1.51 (1.09–2.11); 0.014 | |||
| Statistics for model | χ2 = 221.6 d.f. 15; P < 0.001 | |||||
| Adjusted for sex social class and relationship with father (n = 6805) | ||||||
| Very true/True | 1.00 | 1.00 | 1.00 | |||
| Uncertain | 1.03 (0.78–1.34); 0.855 | 1.10 (0.82–1.48); 0.513 | 0.92 (0.69–1.24); 0.590 | |||
| Untrue or very untrue | 0.97 (0.68–1.37); 0.959 | 1.01 (0.69–1.48); 0.941 | 1.34 (0.94–1.91); 0.102 | |||
| Statistics for model | χ2 = 236.2 d.f. 21; P < 0.001 | |||||
Multinomial regression reporting odds of one, two and three or more health problems or diseases in the last twelve months compared to none, in subjects who reported on the quality of relationship with their father age 16 years (unadjusted and adjusted models; 1958 cohort age 33 years)
| Do you get on well with your father? | Odds of one health problem | Odds of two health problems | Odds of three or more health problems | |||
|---|---|---|---|---|---|---|
| OR (95% CI); P value | OR (95% CI); P value | OR (95% CI); P value | ||||
| Unadjusted (n = 7141) | ||||||
| Very true/True | 1.00 | 1.00 | 1.00 | |||
| Uncertain | 1.03 (0.83–1.27); 0.790 | 1.03 (0.74–1.39); 0.794 | 1.47 (1.18–1.83); 0.001 | |||
| Untrue/very untrue | 1.37 (1.04–1.80); 0.025 | 1.02 (0.82–1.30); 0.926 | 1.80 (1.35–2.38); 0.000 | |||
| Statistics for model | χ2 = 40.48 d.f. 6; P < 0.0001 | |||||
| Adjusted for sex and social class (n = 7141) | ||||||
| Very true/True | 1.00 | 1.00 | 1.00 | |||
| Uncertain | 1.03 (0.83–1.28); 0.782 | 1.02 (0.81–1.29); 0.856 | 1.42 (1.13–1.76); 0.002 | |||
| Untrue or very untrue | 1.36 (1.03–1.79); 0.028 | 0.99 (0.72–1.35); 0.930 | 1.63 (1.22–2.17); 0.001 | |||
| Statistics for model | χ2 = 234.4 d.f. 15; P < 0.001 | |||||
| Adjusted for sex social class and relationship with mother (n = 6805) | ||||||
| Very true/True | 1.00 | 1.00 | 1.00 | |||
| Uncertain | 1.01 (0.80–1.26); 0.782 | 0.99 (0.76–1.27); 0.856 | 1.42 (1.12–1.79); 0.004 | |||
| Untrue or very untrue | 1.4 (1.1–1.9); 0.05 | 1.02 (0.74–1.41); 0.930 | 1.59 (1.18–2.14); 0.02 | |||
| Statistics for model | χ2 = 236.2 d.f. 21; P < 0.001 | |||||
The odds of experiencing health problems age 26 years were also raised for those reporting a poor relationship with their parents in the 1970 birth cohort, both in unadjusted analyses and in those adjusted for sex and social class (data not shown). Additional adjustment for teenage depression attenuated the odds only slightly. In the latter analyses (table 6) the odds of reporting three or more health problems were raised between 30 and 80% in subjects endorsing five out of the six negative descriptors of the parent–child relationship, particularly ‘don't understand me/my motives’ ‘are strict/bossy/have too many rules’ and ‘treat me like a child’. The first two of these statements were also predictive of one health problem. Positive aspects of the parent–child relationship were not predictive of health problems in any of the analyses. When all descriptors of relationships were entered into the regression analyses together (results not shown) two negative descriptors ‘don't understand me or my motives’ and ‘are strict/bossy/have too many rules’ proved the most predictive. Results were positive when analysed for men and women separately (not shown), but the variables which were predictive differed. In women ‘can't understand what they want’, ‘don't understand me/my motives’ and ‘nagging/moaning/complaining’ were predictive of three or more health problems after controlling for social class and teenage depression. In men it was the variables ‘treat me like a child’ and ‘strict/bossy/have too many rules’ which were predictive.
Multinomial regression reporting the odds of one two and three or more health problems compared to no health problems or diseases in subjects who reported on the quality of their relationship with their parents age 16 years (adjusted models for social class, sex and teenage depression; 1970 birth cohort age 26 years)
| Aspects of parental relationship Reported age 16 years | Odds of one health problem | Odds of two health problems | Odds of three or more health problems | χ2 for model (d.f. 15); P value | ||||
|---|---|---|---|---|---|---|---|---|
| n = 3399 | OR (95% CI); P value | OR (95% CI); P value | OR (95% CI); P value | |||||
| n = 990 | n = 672 | n = 769 | ||||||
| My parents: | ||||||||
| Allow me freedom of action within reason | 0.94 (0.73–1.20); 0.599 | 1.10 (0.83–1.46); 0.494 | 0.88 (0.68–1.14); 0.877 | 149.29; <0.001 | ||||
| Are understanding/can talk to them | 1.03 (0.86–1.24); 0.731 | 1.18 (0.97–1.45); 0.107 | 0.99 (0.81–1.20); 0.917 | 149.96; <0.001 | ||||
| Are loving/caring/look after me | 1.04 (0.84–1.28); 0.733 | 1.22 (0.96–1.54); 0.102 | 1.0 (0.80–1.26); 0.966 | 149.82; <0.001 | ||||
| Are helpful/good in a crisis | 1.04 (0.86–1.25); 0.690 | 1.08 (0.88–1.32); 0.479 | 1.08 (0.88–1.33); 0.422 | 147.34; <0.001 | ||||
| Are generous/buy me lothes/things I need | 0.94 (0.79–1.13); 0.506 | 0.98 (0.80–1.20); 0.840 | 0.90 (0.74–1.09); 0.288 | 147.86; <0.001 | ||||
| Are overprotective/fussing | 0.96 (0.77–1.20); 0.714 | 1.15 (0.91–1.46); 0.251 | 1.09 (0.86–1.38); 0.477 | 149.27; <0.001 | ||||
| Treat me like a child | 1.21 (0.87–1.69); 0.254 | 1.38 (0.97–1.97); 0.075 | 1.58 (1.12–2.21); 0.009 | 154.02; <0.001 | ||||
| Don't understand me/my motives | 1.34 (1.05–1.71); 0.021 | 1.06 (0.80–1.41); 0.688 | 1.51 (1.17–1.96); 0.002 | 159.16; <0.001 | ||||
| I feel I can't understand what they want | 1.19 (0.91–1.55); 0.197 | 1.25 (0.94–1.67); 0.122 | 1.4 (1.06–1.84); 0.017 | 152.58; <0.001 | ||||
| Are strict/bossy/have too many rules | 1.88 (1.27–1.79); 0.002 | 1.6 (1.06–2.53); 0.027 | 1.79 (1.17–2.72); 0.007 | 158.46; <0.001 | ||||
| Are nagging/moaning/complaining | 1.09 (0.88–1.36); 0.470 | 1.03 (0.81–1.30); 0.843 | 1.32 (1.05–1.65); 0.019 | 152.93; <0.001 | ||||
Discussion
The measures of the quality of parent–child relationships available in these three cohort studies all suffer some drawbacks. The 1946 data relies on retrospective reporting from adults aged 43 years and may be affected by adult experiences. Self report of abuse and neglect, however, is regarded as valid and often more accurate than official records.55 Exposure measures in the two later cohorts may not offer an accurate picture of relationships throughout childhood as they were gathered during adolescence when conflict tends to increase. The 1958 measure provides only a general view of relationship quality, but allows a distinction to be made between relationship with mother and father. The 1970 cohort study gathered data on specific aspects of the parent–child relationship with questions modelled on items from a validated measure.52 However, the inventory was not validated and the data do not make it possible to distinguish between mother and father relationships. The question was asked in such a way that non-response cannot be distinguished from disagreement. The responses to questions in this cohort are therefore likely to provide minimum estimates. In all three cohorts, imprecision in measurement is likely to have resulted in some misclassification of subjects and this may have reduced the observed strength of association between exposures and outcome measures.
The generalisability of our findings is compromised by incomplete data capture and the biases apparent in the group for whom data are available. Children in single parent families, manual social classes and boys are underrepresented. However, whereas studies of the impact of the parent–child relationships usually focus on families living in poverty and parents in separated or reconstituted families, the results we present here are most pertinent to non-manual class, two-parent families. In so far as relationships are likely to be worse in manual-class families, in single parent and reconstituted families,56–58 and amongst children living in care (a group who were very likely to be lost to follow up) these problems are also likely to result in an underestimation of the overall effect of parent–child relationships on population health.
Adjustment was restricted to the key confounding factors—sex and social class—and our results may be affected by residual confounding attributable to other aspects of poverty or social deprivation. In two of the cohorts we adjusted for subjects' mental health at the time of measurement of the parent–child relationship in order to take account of the possible influence of current mental state on perceptions of relationship quality. This attenuated the odds of poor health to a greater extent in the cross-sectional analyses on the 1946 cohort, than in the longitudinal analyses on the 1970 cohort, but in both analyses poor quality relationships maintained an independent impact on health. If poor relationships with parents are a cause of mental health problems in childhood7–9,11–15 and if those affected in childhood remain affected in adulthood, adjusting for mental health problems would be expected to adjust out some of the deleterious effect of relationships on health, reducing the extent of association. Such effects are likely to be stronger in cross-sectional than in longitudinal analyses.
We chose to examine the impact of childhood relationships on all health problems/symptoms rather than specific diseases consistent with our hypothesis of general susceptibility. For the same reason we included all symptoms on which data were gathered in all cohorts. The most prevalent health conditions were covered in all three cohorts and differences between the checklists in the three cohorts were partly attributable to the prevalence of health problems at different ages. Our approach (examining the impact on one, two or three or more chronic health problems) allowed us to examine the impact of parent–child relationships on increasing levels of ill health and maximised the number of subjects with relevant outcomes.
The results of our analyses are consistent with those of other studies,15–31 suggesting that subjective perceptions of the quality of parent–child relationships predict physical health experience in later life, independently of social class and gender. They suggest that more severe relationship problems, as evidenced in the 1946 cohort analyses, have a greater impact on health than the less severe problems measured in the two later cohorts. A graded effect was also evident within analyses on the 1946 and 1958 cohorts. Although raising the odds of poor health to a minor degree, less severe relationship problems are potentially important for public health because they affect a greater proportion of the population (up to 18% in some analyses).
Our results are consistent with any of the three mechanisms described in the introduction. The results of the 1946 cohort analyses are consistent with a mechanism involving poor mental health, but also show some of the impact of parent–child relationships to be independent of current mental health status. Results of the 1970 cohort analyses suggest that teenage mental health played little if any role in mediating adult health problems. Available measures of mental health, however, did not capture all potentially relevant aspects of mental health, for example self esteem or resilience.
It is also possible that some of our findings are attributable to genetic factors. Poor parental health might affect the quality of parent–child relationships and children could be genetically susceptible to the same health problems as their parents. However, genetic make-up is not thought to be one of the major contributory factors to the common symptoms/health problems that were the subject of these analyses.
Whatever the mechanism, these findings warrant further investigation. Parent–child relationships are amenable to intervention using relatively low cost measures.59,60 If these relationships do prove to be a determinant of chronic health problems in relatively young adults, a strong case could be made for publicly funded provision of parenting education and support.
Social deprivation and stressful life events in childhood are widely recognised as life course determinants of health.
The adult health impact of chronic emotional stressors in childhood has been less well researched.
This study investigated the extent to which childhood family relationships perceived as poor in adolescence or adulthood predicted adult health.
The odds of three or more illnesses or health problems increased with reporting of poor relationships independently of social class and mental health.
Childhood family relationships are amenable to intervention and their role as a determinant of health warrants further attention.
This study was undertaken on funds provided by the Health Development Agency under their Social Capital and Health: Quantitative Studies Programme. S.L.S.-B. and L.F. were working in the Health Services Research Units, University of Oxford when this study was carried out. This Unit receives core funding from the NHS R&D Programme. M.E.J.W. is funded by the MRC.
References
Montgomery SM, Bartley MJ, Wilkinson RJ. Family conflict and slow growth.
Ely M, Richards MPM, Wadsworth MEJ, Elliott BJ. Secular changes in the association of parental divorce and children's educational attainment; evidence from 3 British birth cohorts.
Robins LN, Rutter ME, editors. Straight and devious pathways from childhood to adulthood. Cambridge: Cambridge University Press,
Neeleman J, Wessely S, Wadsworth MEJ. Predictors of suicide, accidental death and premature natural death in a general population cohort.
Rogers B. Pathways between parental divorce and adult depression.
Amato P, Loomis L, Booth A. Parental divorce, marital conflict and offspring wellbeing during early adulthood.
Kaplan HB, Robbins C, Martin SS. Antecedents of psychological distress in young adults: self rejection, deprivation of social support and life events.
Hightower E. Adolescent interpersonal and familial precursors of positive mental health at midlife.
Paterson GR, DeBaryshe B, Ramsey E. A developmental perspective on antisocial behaviour.
Egeland B. Mediators of the effects of child maltreatment on developmental adaption in adolescence. In: Cicchetti D, Toth SL, editors, Trauma: Perspectives on Theory, Research and Intervention. Rochester, New York: University of Rochester Press,
Fergusson DM, Lynskey MT. Suicide attempts and suicidal ideation in a birth cohort of 16-year-old New Zealanders.
Roberts REL, Bengtson VL. Relationship with parents, self esteem and psychological well-being in young adulthood.
Rodgers B. Reported parental behaviour and adult affective symptoms 1: associations and moderating factors.
Stewart-Brown S, Shaw R. The roots of social capital: relationships in the home during childhood and health in later life. In Morgan A, Swann C, editors, Social Capital for Health: issues of definition measurement and links to health. London: Health Development Agency,
Russek LG, Schwartz GE. Narrative descriptions of parental love and caring predict health status in midlife: a 35-year follow-up of the Harvard Mastery of Stress Study.
Russek LG, Schwartz GE. Feelings of parental caring predict health status in midlife: a 35-year follow-up of the Harvard Mastery of Stress Study.
Russek LG, Schwartz GE. Perceptions of parental caring predict health status in midlife: a 35-year follow-up of the Harvard Mastery of Stress Study.
Thomas CB. Precursors of premature disease and death: the predictive potential of habits and family attitudes.
Thomas CB, Duszynski KR, Shaffer JW. Family attitudes reported in youth as potential predictors of cancer.
Lundberg O. The impact of childhood living conditions on illness and mortality in adulthood.
Lundberg O. Childhood conditions, sense of coherence, social class and adult ill health: exploring their theoretical and empirical relations.
Sweeting H, West P. Family life and health in adolescence: a role for culture in the health inequalities debate?
Mechanic D, Hansell S. Divorce, family conflict, and adolescents' well-being.
Johnston JR, Gonzalez R, Campbell EG. Ongoing post divorce conflict and child disturbance.
Holler B, Hurrelmann K. The role of parent and peer contacts for adolescents' state of health. In: Hurrelmann K, Loesel F, editors, Health hazards in adolescence.
Gottman JM, Katz LF, Hooven C. Parental meta-emotion philosophy and the emotional life of families: Theoretical models and preliminary data.
Feldman SS, Fisher L, Seitel L. The effect of parents' marital satisfaction on young adult's adaptation: a longitudinal study.
Wickrama KA, Lorenz FO, Conger RD. Parental support and adolescent physical health status: a latent growth-curve analysis.
Higley JD, Thompson WW, Champoux M, et al. Paternal and maternal genetic and environmental contributions to cerebrospinal fluid monoamine metabolites in Rhesus monkeys.
Meaney AS, Coatsworth JD. The development of competence in favourable and unfavourable conditions.
Quinton D, Pickles A, Maughan B, Rutter M. Partners, peers, and pathways: Assortative pairing and continuities in conduct disorder.
Berkman LF, Syme SL. Social networks, host resistance, and mortality: a nine-year follow-up study of Alameda County residents.
House JS, Robbins C, Metzner HL. The association of social relationships and activities with mortality: prospective evidence from the Tecumseh Community Health Study.
Orth Gomer K, Rosengren A, Wilhelmsen L. Lack of social support and incidence of coronary heart disease in middle-aged Swedish men.
Medalie JH, Goldbourt U. Angina pectoris among 10,000 men. II. Psychosocial and other risk factors as evidenced by a multivariate analysis of a five year incidence study.
Bosma H, Marmot MG, Hemingway H, Nicholson AC, Brunner E, Stansfeld SA. Low job control and risk of coronary heart disease in Whitehall II (prospective cohort) study.
Reynolds P, Kaplan GA. Social connections and risk for cancer: Prospective evidence from the Alameda County study.
Hemingway H, Marmot M. Evidence based cardiology: psychosocial factors in the aetiology and prognosis of coronary heart disease. Systematic review of prospective cohort studies.
Kaplan, GA, Salonen JT, Cohen RD, Brand RJ, Syme SL, Puska P. Social connections and mortality from all causes and from cardiovascular disease: prospective evidence from eastern Finland.
Lloyd KR, Jenkins R, Mann A. Long term outcome of patients with neurotic illness in general practice.
Wadsworth MEJ. The imprint of time: childhood history and adult life. Oxford: Oxford University Press,
Chamberlain R, Chamberlain C, Howlett B, Claireaux A. British Births 1970 Vol 1: the first week of life. London: Heinemann,
Chamberlain R, Chamberlain C, Howlett B, Claireaux A. British Births 1970 Vol 2: the first week of life. London: Heinemann,
Wadsworth MEJ, Mann SL, Rodgers B, Kuh D, Hilder WS, Yusuf EJ. Loss and representativeness in a 43 year follow-up of a national birth cohort.
Fogelman KR. Growing up in Britain: collected papers from the National Child Development Study. London: Macmillan,
Ferri E. Life at 33: the fifth follow up of the National Child Development Study. London: National Children's Bureau and City University,
Bynner J, Ferri E, Shepherd P. Twenty something in the 1990s; getting on, getting by, getting nowhere. Aldershot: Ashgate Publishing,
Parker G. The Parental Bonding Instrument. A decade of research.
Lindelow M, Hardy R, Rodgers B. Development of a scale to measure symptoms of anxiety and depression in the general population: the Psychiatric Symptom Frequency (PSF) Scale.
Goldberg DP, Hillier VF. A scaled version of the General Health Questionnaire.
Giovannoni JM. Definitional issues in child maltreatment. In: Cicchetti D and Carlson V, editors, Child maltreatment: theory and research on causes and consequences of child abuse and neglect. New York: Cambridge University Press,
Ghate D, Daniels A. Talking about my generation: a survey of 8–15 year olds growing up in the 1990s. London: NSPCC,
Hart T, Risley TR. Meaningful differences in the everyday experiences of young American children. Baltimore, MD: Paul H. Brookes,
Brown J, Cohen P, Johnson JG, Salzinger S. A longitudinal analysis of risk factors for child maltreatment: findings of a 17 year prospective study of officially recorded and self-reported child abuse and neglect.
Marshall J, Watt P. Child behaviour problems: a literature review of the size and nature of the problem and prevention interventions in childhood. Perth, Western Australia: The Inter agency Committee on Children's Futures,

Comments