


Abstract
Aims In acute myocardial infarction (AMI), primary percutaneous transluminal angioplasty (PTCA) is the preferred option when it can be performed rapidly. Because of the limited access to high PTCA volume centres in some areas, it has been suggested that PTCA could be performed in low-volume centres on AMI patients. Little data exist on the validity of this strategy in modern era PTCA.
Methods and results The Greater Paris area comprises 11 million inhabitants and accounts for 18% of the French population. In 2001, the hospital agency of the Greater Paris area set up a registry of all PTCAs performed in this region. Data from 2001 and 2002 was analysed. Hospitals performing <400 PTCAs per year were classified as low-volume. A case–control analysis (propensity score) compared in-hospital mortality in low- and high-volume centres. A total of 37 848 angioplasty procedures were performed in 44 centres during the study period; 24.7% were performed in low-volume centres. A non-statistically significant trend towards reduced in-hospital mortality was noted in high-volume centres as opposed to low-volume centres: 2.01 vs. 2.42%, P=0.057. In-hospital mortality rates were significantly different in the sub-group of emergency procedures: 6.75% in high- vs. 8.54% in low-volume centres, P=0.028. No difference was noted between low- and high-volume centres in non-emergency procedures (0.62 vs. 0.62%, P=0.99).
Conclusion In the era of modern stenting, a clear inverse relationship exists between hospital PTCA volume and in-hospital mortality after emergency procedures. Tolerance of low-volume thresholds for angioplasty centres with the purpose of providing primary PTCA in AMI should not be recommended, even in underserved areas.
Introduction
In acute myocardial infarction (AMI), primary percutaneous transluminal angioplasty (PTCA) is the preferred option when it can be performed in less than 90 min after the first medical contact, especially in patients with high-risk features such as cardiogenic shock.1 However, this strategy requires hospitals with established interventional cardiology programs which include not only trained interventional cardiologists, but also skilled supporting staff available around the clock to manage high-risk emergency cases. Lower mortality rates among patients undergoing primary PTCA have been reported in centres with a high volume of PTCA; however, controversy exists on the hospital volume threshold. Furthermore, because of the limited access to high PTCA volume centres in some countries, it has been suggested that PTCA could be performed in low-volume centres on AMI patients. Little data exist on the validity of this strategy in modern era PTCA. This study examined the relationship between hospital PTCA volume and in-hospital outcomes after emergency PTCA procedures performed for AMI, cardiogenic shock, and successfully resuscitated out-of-hospital cardiac arrest (OHCA) due to coronary artery occlusion in a registry conducted in the greater Paris area between 2001 and 2002.
Methods
The CARDIO-ARHIF (Agence Régionale d'Hospitalisation d'Ile de France) registry was set up in 2001 by a government agency to monitor coronary diagnostic and therapeutic procedures performed in the greater Paris area. This region comprises 11 million inhabitants and accounts for 18% of the French population. A total of 44 hospitals with facilities for both coronary angiography and angioplasty are implanted in the area.
Each procedure is entered in a computer database by the physician who performed the procedure. Multiple procedures performed in the same patient were therefore entered separately. Variables entered include: patients demographics (age, sex), pre-procedural clinical status (silent, stable or unstable angina, pre-operative assessment for cardiac valvular surgery, AMI, cardiogenic shock, OHCA, and other reasons), reasons for performing the procedure documented ischaemia in case of silent or stable ischaemia, ST- or T-wave changes, and/or creatine kinase (CK) or troponine elevation if unstable angina, myocardial infarction, or OHCA) procedural information (number of lesions dilated, amount of stents implanted), occurrence of pre- and post-procedural complications (AMI, repeat PTCA, emergency CABG, stroke, vascular complications requiring surgery, renal failure requiring dialysis, blood transfusion, death). Internal audits on 10% of cases were performed twice a year in each centre. In addition, an independent external random audit of 3% of the files was held every 6 months in order to ensure completeness and reliability of the data. Clinical status at discharge (dead or alive) was also recorded in another hospital-based database (PMSI database). A cross check was performed using this database to validate the deaths recorded in the CARDIO-ARIF database.
Outcomes of interest
The aim of this study was to examine the relationship between in-hospital outcome and hospital PTCA volume after emergency procedures for AMI, cardiogenic shock, or OHCA due to acute coronary artery occlusion. These procedures were identified in the database by screening the reasons for performing the procedure and identifying patients with the following: (i) AMI of less than 12 h of duration or AMI of more than 12 but less than 24 h of duration if the operator considered emergency PTCA necessary because of continuous ischaemia or complications; (ii) cardiogenic shock; and/or (iii) successfully resuscitated OHCA due to acute coronary artery occlusion. AMI is defined as a prolonged, continuous (lasting at least 20 min) chest pain despite administration of nitrates, and either ST-segment elevation ≥1 mm in standard leads or ≥2 mm in two or more contiguous precordial leads or new or presumably new left bundle branch block. Cardiogenic shock is defined as a systolic blood pressure <90 mm Hg for at least 30 min or if intravenous inotropes were needed to maintain a systolic blood pressure over 90 mmHg, with end-organ hypoperfusion. A successfully resuscitated OHCA due to acute coronary artery occlusion is defined as: (a) an abrupt loss of consciousness within 6 h of the onset of acute symptoms; (b) a stable haemodynamic status after successful out-of-hospital cardiopulmonary resuscitation; (c) an acute coronary artery occlusion noted during the coronary angiogram performed at hospital admission.
The in-hospital overall mortality rate was chosen as the primary endpoint. The secondary endpoint was in-hospital complications rate defined as the occurrence of one or more of the following adverse events during hospital stay: death, new or recurrent myocardial infarction, re-PTCA, emergency coronary artery bypass grafting (CABG), stroke, renal failure requiring dialysis, vascular access complication requiring surgery, and/or blood transfusion. A new myocardial infarction is defined as a clinical event and/or electrocardiographic changes associated with CK rise to greater than or equal to three times the upper limit of the normal value. Re-infarction is defined as the occurrence of clinical symptoms and/or development of new electrocardiographic changes associated with a new elevation of CK enzyme levels. The level of CK rise depended on the interval from the index AMI: within 48 h the necessary CK level was at least twice the previous value; after 48 h at least three times the upper limit of the normal value. In all cases, angiographic visualization of the coronary artery reocclusion was recommended.
In-hospital death is defined as death due to any cause during the hospital stay. The exact cause of death was not registered. Deaths reported during the in-hospital stay also included those occurring after transfer to another medical institution. Clinical success was defined as at least one lesion treated successfully with a residual stenosis of less than 50% and with no in-hospital complication.
The annual volume of procedures performed in each centre was calculated on the basis of the mean volume of procedures recorded in 2001 and 2002. Volume thresholds used in the analysis were those recommended by the French Society of Cardiology:2,3 On the basis of these recommendations, a threshold of 400 procedures per year was used to define low (<400) and high (equal to or >400) volume centres. Centres which merged during the study period were grouped together and their respective volumes of procedures were totalled.
<250 procedures per year: Volume deemed insufficient to ensure patient safety
250–400 procedures per year: Volume considered insufficient. However, provided that the competence of the operators working in these centres and their individual activity level are in compliance with the French Society of Cardiology recommendations, these centres are allowed to pursue and develop their activity.
400–600 procedures per year: Adequate activity volume allowing quality care and patient safety.
≥600 procedures per year: Sufficient activity. Level of patient safety is deemed optimal.
Statistical analysis
Descriptive statistics were summarized as means for continuous variables and percentages for categorical variables. An univariate analysis was carried out to identify the risk factors associated with in-hospital mortality. The associations between categorical variables were assessed using the χ2 test and differences between continuous variables were compared by Student's t-test.
Multivariable backward logistic-regression models were used to identify factors associated with in-hospital mortality. Calibration was evaluated using the Hosmer–Lemeshow test and discrimination was based on the area under the ROC curve. An area higher than 0.8 was considered excellent discrimination. The likelihood ratio test, Wald test, and the efficient score test for testing the joint significance of the explanatory variables were used. The Akaike Information Criterion (AIC), the Schwarz Criterion (SC), and the negative of twice the log-likelihood (−2 log L) criterion which compare the intercept-only model and the fitted model were used to validate the model. All tests were two-sided and probability values equal to or less than 0.05 were considered significant. All statistical analyses were performed using the SAS software (version 8.2).
Because of significant differences in base-line data between low- and high-volume centres (Table 1), a propensity analysis was carried out. A logistic-regression model was created to derive a procedure propensity score, which included clinical characteristics (gender, age, AMI <24 h, cardiogenic shock, OHCA) as well as the following interactions: OHCA/AMI <24 h, age/cardiogenic shock, gender/AMI <24 h. Each procedure was assigned a propensity score that reflected the probability of treatment in centres performing less than 400 PTCAs per year. Nine thousand two hundred and forty-four low-volume centre procedures (<400 PTCAs per year) were pair-matched (in a 1:1 ratio) to 9244 high-volume centre procedures (>400 PTCAs per year). Propensity scores were required to be within 0.01 of each other to be considered a match. This propensity score analysis permits the comparison of outcomes between groups with a similar likelihood of risk. Pre-defined subgroups were selected for analyses based on the aims of the study (all procedures, planned procedures, or emergency procedures performed in patients with AMI <24 h, cardiogenic shock, OHCA). Odds ratios and confidence intervals for subgroups were calculated by case–control analysis. The performance of the logistic-regression model used to create the propensity score was evaluated using the Hosmer–Lemeshow test for calibration and the area under the ROC curve for discrimination. The same model was applied to study the interaction between in-hospital complications and hospital PTCA volume.
Patient and procedural characteristics
| Total (n=37 848) | <400 PTCAs/year (n=9344) | >400 PTCAs/year (n=28 504) | P | |
|---|---|---|---|---|
| Age (years, mean ±SD) | 64±12.5 | 64±12.5 | 64±12.3 | 0.23 |
| Male (%) | 78 | 77.8 | 78.4 | 0.17 |
| Clinical indication for PCI (%) | ||||
| Stable angina or silent, ischaemia | 31.8 | 30.8 | 32.2 | 0.029 |
| Unstable angina | 41.4 | 41.2 | 41.4 | 0.053 |
| <24 AMI | 19.5 | 22.2 | 18.6 | <0.001 |
| Cardiogenic shock | 2 | 2 | 2 | 0.43 |
| OHCA | 0.9 | 0.7 | 1 | 0.04 |
| Others | 4.4 | 3.1 | 4.8 | <0.001 |
| Primary success rate (%) | 92.8 | 91.6 | 93.2 | <0.001 |
| Number of lesions attempted (mean ±SD) | 1.54±0.84 | 1.41±0.68 | 1.58±0.87 | <0.001 |
| Number of stents used per lesion (mean ±SD) | 1.51±0.83 | 1.37±0.67 | 1.56±0.88 | <0.001 |
Analysis was carried out on all procedures performed in the greater Paris area in 2001 and 2002. Multiple procedures in a patient were entered and analysed separately. A total of 37 848 procedures were entered in the database. Eight percent of patients had multiple procedures (7% twice and 1% three times). We considered the procedures to be independent and clinical variables were associated with a procedure. As the assumption of independence could be violated by patients who were included twice, a second analysis was performed using only the first procedure performed in each patient.
Results
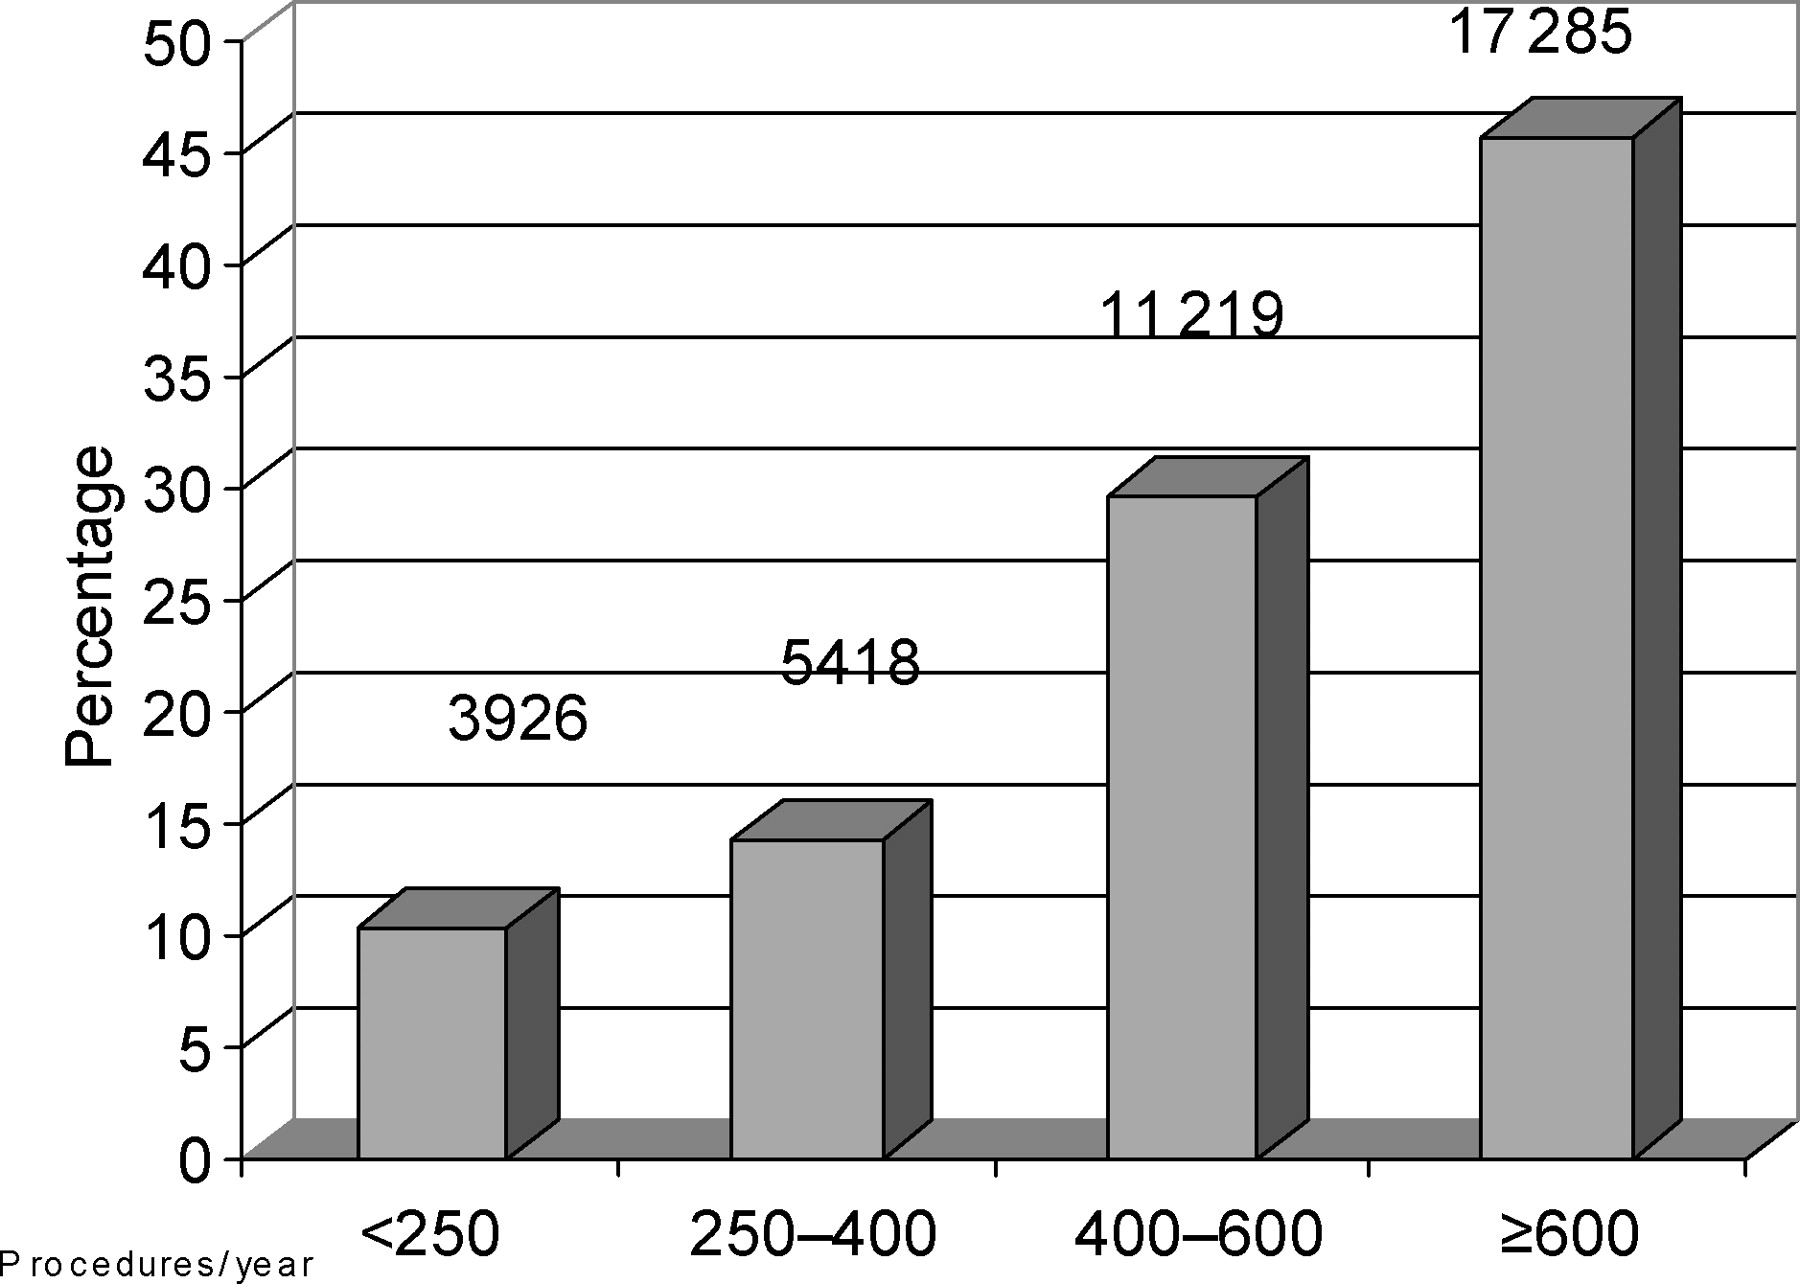
A total of 37 848 angioplasty procedures performed in 44 centres located in the Paris area were recorded in the registry during 2001 and 2002. Centre distribution in relation to the annual volume of procedures is shown in Figure 1. A total of 9344 (24.7%) procedures were carried out in centres performing less than 400 procedures per year.

Distribution of centers according to the annual volume of procedures performed.
Clinical and procedural characteristics according to hospital volume are summarized in Table 1. In low-volume centres (<400 procedures per year), clinical indication for PTCA was more often an AMI of less than 24 h (22.2 vs. 18.6%, P<0.001). The number of lesions attempted and stents used per lesion were greater in the high-volume centres (respectively, 1.58±0.87 vs. 1.41±0.68, P<0.001 and 1.56±0.88 vs. 1.37±0.67, P<0.001). Clinical success was greater in the high-volume centres (93.2 vs. 91.6%, P<0.001).
Univariate analysis
General population
In-hospital death was reported in 814 patients, accounting for 2.2% of procedures. Mean age of patients who died was 69.9±12.2 vs. 63.7±12.3 years for patients who survived the in-hospital phase (P<0.0001). In-hospital death rates according to age are shown in Figure 2. In-hospital death rate in women undergoing angioplasty was 3.3 vs. 1.8% in male patients (P<0.0001).
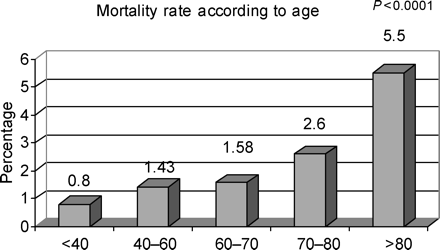
In-hospital mortality rates according to age.
In-hospital death rates varied between 2.17% in centres performing more than 600 procedures, 2.33% in centres performing between 400 and 600 procedures, 2.4% in centres performing between 250 and 400 procedures per year, and 2.6% in centres with less than 250 annual procedures (χ2 test, P=0.051; Mantel–Haenzel linear tendency test, P=0.164). A 19% absolute value accounting for the difference in in-hospital mortality rates between centres performing <250 procedures per year and centres performing >600 procedures per year was noted in the subgroup involving patients with OHCA or cardiogenic shock (57.6 vs. 39.1%, P<0.0001).
Emergency CABG after PTCA was low and similar in low- and high-volume centres (0.2% in all procedures).
Multivariable analysis
General population
The first logistic-regression model identified the following variables as predictors of in-hospital mortality:
age (P<0.0001)
gender (P=0.0045)
annual volume of procedures per centre (P=0.0181)
emergency procedures, defined as patients with AMI of less than 24 h onset, cardiogenic shock, or OHCA (P<0.0001)
The following interactions were found: The Hosmer–Lemenshow test showed a P-value of 0.10 and the area under the ROC curve was high (0.88) indicating good model quality. The likelihood ratio test, Wald test, and the efficient score test for testing the joint significance of the explanatory variables yielded a P-value of <0.001. The Akaike Information Criterion (AIC), the Schwarz Criterion (SC), and the −2 log L criterion which compares the intercept-only model and the fitted model validated the model.
annual procedure volume/emergency procedures (P=0.0560)
age/emergency procedures (P=0.0001)
The relationship between PTCA hospital volume and in-hospital mortality was than assessed by case–control analysis, using the previously described propensity score. The performance of the logistic-regression model used to create the propensity score was assessed by a Hosmer–Lemenshow test and the area under the ROC curve. A P-value of 0.7 and an area of 0.71 indicated good model quality.
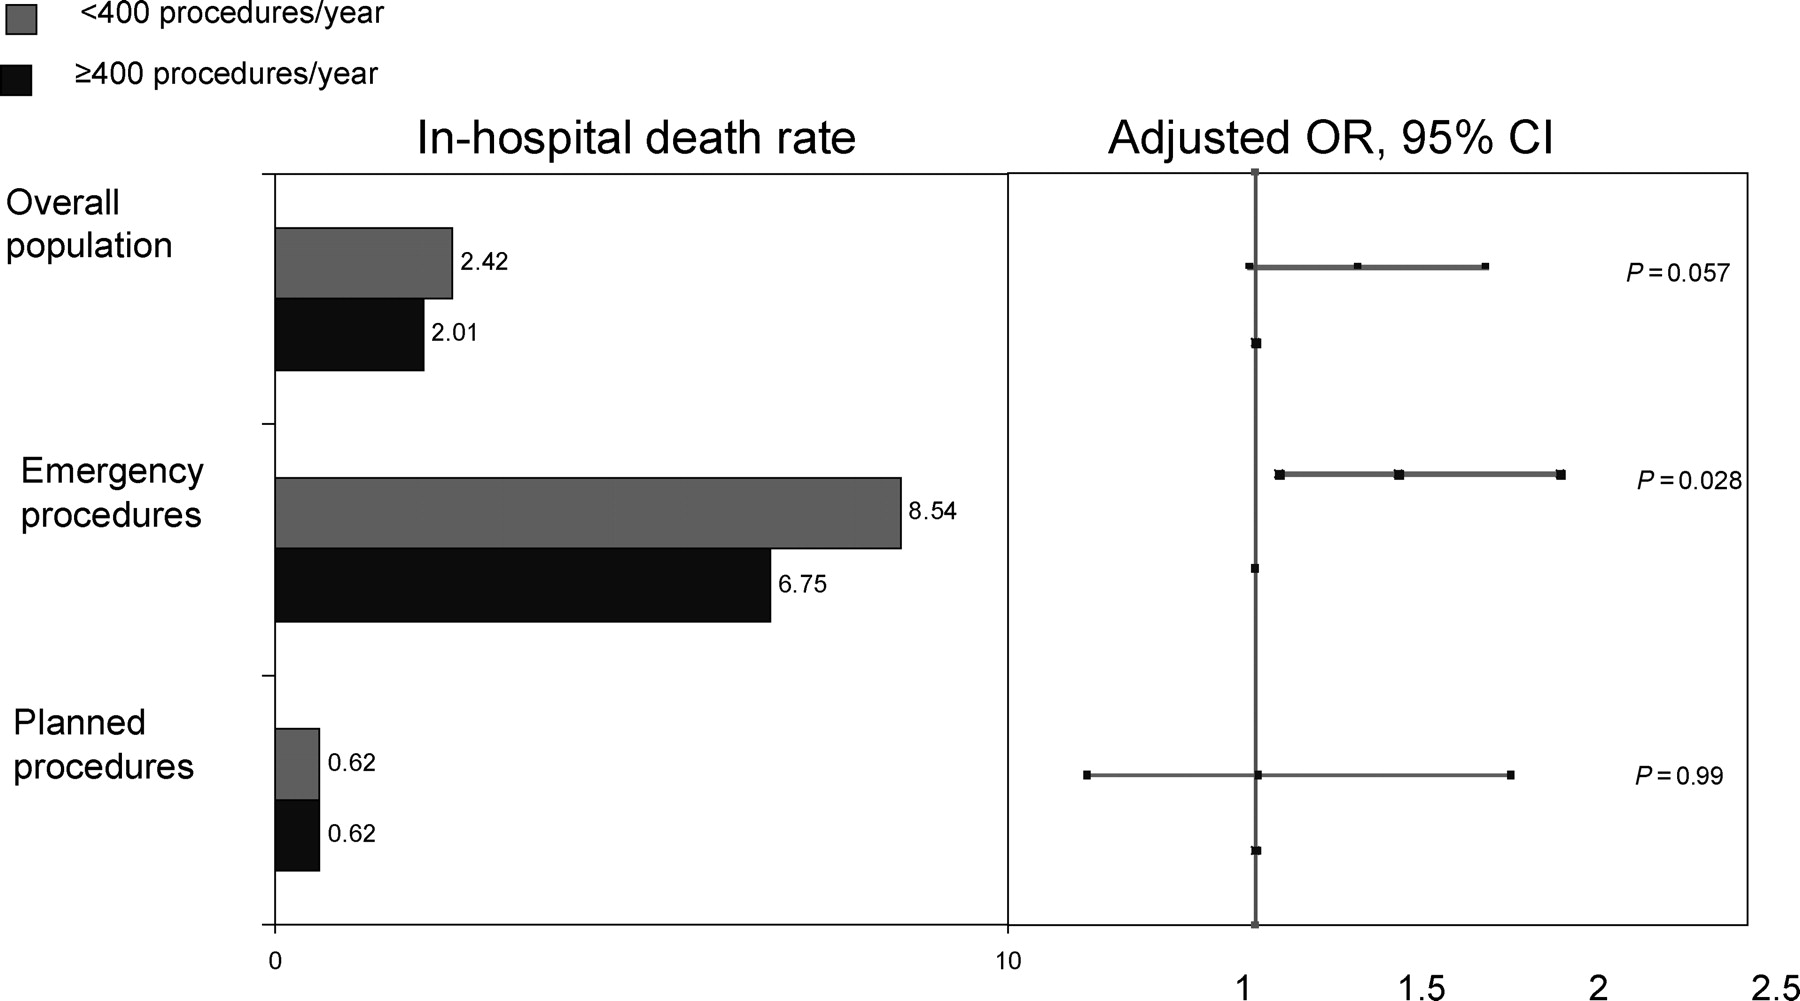
Two study groups of equal size (9244×2) defined according to the previously described propensity score were analysed: The first group comprising patients treated in centres performing less than 400 PTCAs per year and the second group patients treated in centres performing more than 400 PTCAs per year. This case–control analysis is summarized in Figures 3 and 4.

Results of the case–control analysis: in-hospital mortality rates. Emergency procedures included PTCAs performed in patients with AMI of less than 24 h, cardiogenic shock, or successfully resuscitated OHCA.
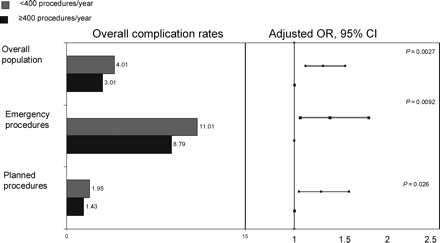
Results of the case–control analysis: in-hospital complication rates. Emergency procedures included PTCAs performed in patients with AMI of less than 24 h, cardiogenic shock, or successfully resuscitated OHCA. Complications were defined as the occurrence of one or more of the following adverse events during hospital stay: death, new or recurrent myocardial infarction, re-PTCA, emergency CABG, stroke, renal failure requiring dialysis, vascular access complication requiring surgery and/or blood transfusion.
A non-statistically significant trend towards reduced overall in-hospital mortality was noted in high-volume centres as opposed to low-volume centres, 2.01 vs. 2.42%, respectively, P=0.057. The difference in in-hospital mortality rates was significant in the subgroup of emergency procedures performed in patients presenting with AMI, cardiogenic shock, or OHCA: 6.75% in high-volume centre vs. 8.54% in low-volume centres, P=0.028. No difference was noted between low- and high-volume centres in the subgroup of non-emergency procedures (0.62 vs. 0.62%, P=0.99).
The same analysis was performed in order to determine the relationship between complication rates between high-volume and low-volume centres. The case–control analysis showed a statistically significant reduced rate of complications in patients admitted to high-volume centres in the overall population and in both subgroups of non-emergency and emergency procedures (overall population: 3.01 vs. 4.01%, P=0.0027; emergency procedures: 8.79 vs. 11.01%, P=0.0092; non-emergency procedures: 1.43 vs. 1.95%, P=0.026) (Figure 4). Complication rates in the matched pairs are detailed in Table 2.
Complication rates in the matched-pair groups according to clinical presentation
| <400 PTCAs/year | >400 PTCAs/year | P | |
|---|---|---|---|
| (n=9244) (%) | (n=9244) (%) | ||
| Overall population | |||
| New or re-AMI | 1.12 | 0.70 | 0.003 |
| Emergency PTCA | 0.11 | 0.09 | 0.638 |
| Emergency CABG | 0.12 | 0.14 | 0.682 |
| Stroke | 0.17 | 0.16 | 0.858 |
| Renal failure requiring dialysis | 0.09 | 0.06 | 0.593 |
| Vascular access surgery | 0.11 | 0.12 | 0.827 |
| Blood transfusion | 0.40 | 0.25 | 0.070 |
| Death | 2.42 | 2.01 | 0.057 |
| Any complication | 4.01 | 3.01 | 0.0027 |
| (n=2107) (%) | (n=2104) (%) | ||
| Emergency procedures | |||
| New or re-AMI | 1.53 | 1.38 | 0.689 |
| Emergency PTCA | 0.33 | 0.24 | 0.566 |
| Emergency CABG | 0.33 | 0.33 | 0.999 |
| Stroke | 0.33 | 0.29 | 0.784 |
| Renal failure requiring dialysis | 0.29 | 0.14 | 0.317 |
| Vascular access surgery | 0.10 | 0.19 | 0.412 |
| Blood transfusion | 0.71 | 0.57 | 0.567 |
| Death | 8.54 | 6.75 | 0.028 |
| Any complication | 11.01 | 8.79 | 0.0092 |
| (n=7136) (%) | (n=7139) (%) | ||
| Planned procedures | |||
| New or re-AMI | 1.00 | 0.50 | 0.001 |
| Emergency PTCA | 0.04 | 0.04 | 0.99 |
| Emergency CABG | 0.06 | 0.08 | 0.527 |
| Stroke | 0.13 | 0.13 | 0.999 |
| Renal failure requiring dialysis | 0.03 | 0.04 | 0.655 |
| Vascular access surgery | 0.11 | 0.10 | 0.796 |
| Blood transfusion | 0.31 | 0.15 | 0.056 |
| Death | 0.62 | 0.62 | 0.99 |
| Any complication | 1.95 | 1.43 | 0.026 |
Emergency procedures included PTCAs performed in patients with AMI of less than 24 h, cardiogenic shock, or successfully resuscitated OHCA.
As the assumption of independence could be violated by patients who were included twice, a second analysis was performed using only the first procedure performed in each patient. Similar results were obtained (data not shown).
Discussion
The main finding of our observational study is that, in the modern age of stenting, there is no relationship between hospital PTCA volume and in-hospital mortality in non-emergency procedures. In contrast, in emergency procedures performed in patients with AMI, cardiogenic shock, or successfully resuscitated OHCA, a clear inverse relationship exists. The second finding is that the overall complication rate is higher in low-volume centres in both planned and emergency procedures.
This is the first complete and audited registry of angioplasty procedures in the greater Paris area in the era of stenting. It shows the excellent outcome of widespread stenting, which translates into a very low in-hospital mortality rate in planned procedures and the near disappearance of the need for emergency bypass surgery.
Outcome analysis and quality control are important in interventional cardiology. Previous registries conducted in Europe and the US have reported numerous clinical, angiographic, and procedural predictors, including age, gender, reason for PTCA, AMI <24 h, Killip class, coronary artery disease risk factors, left main or multivessel disease, left ventricular function, and lesion classification.4–6 The in-hospital mortality predictors observed in our study were similar to those previously reported, namely, age, gender, annual volume of procedures, emergency procedures performed in patients with AMI of less than 24 h, cardiogenic shock, or OHCA.
The relationship between hospital volume and PTCA complications has evolved over time. In earlier registries of balloon angioplasty without stent implantation, a clear inverse relationship was evidenced. Using 1992 Medicare discharge abstracts, Jollis et al.7 demonstrated, in elderly patients, that low-volume hospitals were associated with higher rates of bypass surgery and death. In a New York State registry from 1991 through 1994, Hannan et al.8 showed that hospitals performing less than 600 PTCAs per year experienced significantly higher in-hospital mortality and CABG surgery rates. The advent of coronary stents has reduced the incidence of PTCA-related complications, including the risk of emergency CABG. As a result, procedural outcomes of elective procedures in high- and low-volume centres have been levelled out. In a Californian registry carried out between 1984 and 1996, the disparity in outcomes between low- and high-volume centres narrowed, and complication rates improved significantly in all hospitals.9 Operator volume also influences outcome. In a recently published study, Moscussi et al.10 showed a significant relationship between operator volume and adverse outcome. Current recommendations indicate that elective PTCA be performed by operators with an annual volume of at least 75 procedures in institutions with annual volumes over 400. Furthermore, primary PTCA for AMI should be performed by operators who perform more than 75 elective PTCA procedures per year and at least 11 PTCA procedures for AMI in institutions with an annual volume of at least 400 elective and 36 primary PTCA procedures.11 However, because of the decrease in complications and the levelling between low- and high-volume centres, it has been suggested that a volume of less than 200 procedures per year may be tolerated for hospitals located in underserved geographic areas. In particular, primary angioplasty for AMI could be performed in such centres, to avoid time-consuming transportation to tertiary centres, especially in high-risk patients.12 The findings of our study do not support this recommendation. Comparison by multivariable analysis of high- (>400 procedures per year) and low-volume centres yielded a significant difference in in-hospital mortality in patients presenting with AMI, cardiogenic shock, or OHCA. Multiple factors may account for the relationship between higher hospital volume and lower in-hospital mortality. The average death rate for AMI patients undergoing angioplasty is five-fold higher than that of patients treated by elective PTCA.13 Optimal management of AMI patients require the intervention of a multidisciplinary team. Chest pain, arrhythmias, and haemodynamic instability must be treated before and during the procedure by an emergency physician. Drugs such as GP II B III A platelet inhibitors and inotropic support must be rapidly administered by a skilled nursing staff. The procedure is best performed by an interventional cardiologist seasoned in emergency procedures. Finally, optimal management of AMI patients by medical and nursing teams require not only initial training but also regular exposure to emergency procedures in high-risk patients. In our registry, 19% of patients presented with AMI, and only 2% with cardiogenic shock. Therefore, it is not surprising that a more favourable outcome was found in high-volume centres, with adequate expertise and a sufficient caseload of emergency cases.
The findings of our study support the concept that a policy of regionalization or concentration of emergency PTCAs in specialized, high-volume centres may have a beneficial impact on the outcome of AMI.14 Compliance with current guidelines should therefore be implemented, the merger of low-volume and development of high-volume centres encouraged by local and national regulatory boards.
Limitations
Although this study suggests that high-volume institutions have better outcomes in high-risk patients it is retrospective and can therefore only identify associations and not causality. Furthermore, the patient baseline and procedural characteristics entered in the registry were limited. In particular, no data regarding diabetes or other risk factors, number of diseased vessels, lesion characteristics, infarct location, left ventricular function or Killip class, and use of II B III A platelet receptor antagonists were recorded which makes the analysis incomplete. Similarly, the length of hospital stay was not recorded. As drug-eluting stents were not available in 2001 and 2002, our conclusions can only be applied to procedures using bare-metal stents. Another limitation is the absence of operator volume analysis similar to those reported in previously published studies.10,15,16 Despite internal and external audits, complications may have been underestimated as they were reported by the operators. In contrast, the in-hospital mortality rate was double-checked using a hospital-based database.
Conclusion
Our study demonstrates that in the modern age of stenting, there is no relationship between hospital PTCA volume and in-hospital mortality in low-risk patients. In contrast, a clear inverse relationship exists after emergency procedures in patients with AMI, cardiogenic shock, or successfully resuscitated OHCA. These findings suggest that optimal care of such high-risk patients is better achieved in high-volume centres. Tolerance of low-volume thresholds for angioplasty centres with the purpose of providing primary PTCA in AMI should not be recommended, even in underserved areas. Finally, compliance with guidelines on hospital volumes should be strongly encouraged by national and international cardiology societies and their implementation monitored by local regulatory boards.
Conflict of interest: none declared.
Appendix
Principal investigators of the CARDIO-ARIF registry: Dr Anconina, Hôpital Privé de l'Ouest Parisien, Trappes; Dr Aptecar, Clinique les Fontaines, Melun; Dr Baudouy, Hôpital St Michel, Paris; Dr Benamer, Hôpital Européen de Paris, La Roseraie, Aubervilliers; Dr Beverelli, Clinique Ambroise Paré, Neuilly Sur Seine; Dr Boccara, Hôpital St Antoine, Paris; Dr Brami, CMC de l'Europe, Le Port Marly; Dr Brenot, Centre Cardiologique d'Evecquemont, Evecquemont; Dr Cattan, CHI Le Raincy-Montfermeil, Montfermeil; Dr Dibie, Institut Mutualiste Montsouris, Paris; Dr Drieu, Clinique Turin, Paris; Dr Drobinski (deceased) and Pr Metzger, Hôpital Pitié Salpétrière, Paris; Dr Cador, Clinique Bizet, Paris; Dr Elhadad, CH de Lagny, Lagny; Dr Fourchard, CH André Grégoire, Montreuil; Dr Francoual, CMC Foch, Suresnes; Dr Funck, CH de Pontoise, Pontoise; Dr Godard, CH de Gonesse, Gonesse; Dr Jais, Hôpital Américain de Paris, Neuilly; Dr Joseph, Hôpital Ambroise Paré, Boulogne Billancourt; Dr Juliard, Hôpital Bichat, Paris; Dr Karrillon, Groupement Hospitalier Eaubonne-Montmorency, Eaubonne; Dr Lancelin, CMC Marie Lannelongue, Le Plessis Robinson; Dr Ledru, Hôpital Européen Georges Pompidou, Paris; Dr Lefevre and Dr Dumas, Institut Hospitalier Jacques Cartier, ICPS, Massy; Dr Livarek, CH de Versailles, Le Chesnay; Dr Loubeyre, Hôpital Privé Claude Galien, ICPS, Quincy Sous Senart; Dr Marchand, CHI Poissy-Saint Germain en Laye, Site de Poissy, Poissy; Dr Monsegu, Hôpital du Val de Grâce, Paris; Dr Montely, CH Robert Ballanger, Aulnay Sous Bois; Dr Pagny, Clinique Alleray Labrouste, Paris; Dr Pernes, Hôpital Privé d'Antony, Antony; Dr Pezzano, CHG de Corbeil-Essonnes, Corbeil- Essonnes; Dr Ronteix, CH de Mantes la Jolie, Mantes La Jolie; Dr Royer, Clinique Cardiologique du Nord, Saint Denis; Dr Saudemont, CH Victor Dupouy, Argenteuil; Dr Teiger, Hôpital Henri Mondor, Creteil; Dr Toussaint, CHG de Longjumeau, Longjumeau; Dr Wyart, CHI de Villeneuve St Georges, Villeneuve St Georges; Dr Zemour, Clinique du Bois d'Amour, Drancy; Pr Azancot, Hôpital Lariboisière, Paris; Pr Michel, Hôpital Tenon, Paris; Pr Slama, Hôpital Antoine Béclère, Clamart; Pr Spaulding, Hôpital Cochin, Paris.
References
Ho V.

