


Abstract
Aims The aim of this study was to examine the prevalence of pre-eclampsia in Southern, Eastern, and Northern Finland, and the relationship between history of pre-eclampsia and maternal coronary artery disease (CAD) risk factors.
Methods and results Women aged 25–64 years, who participated in a cross-sectional population survey and had been pregnant (n=3650), were studied. The proportion of women who had ever had pre-eclampsia was lower in Southern (7.9%) compared with Northern Finland (13.9%) (P=0.001), but did not differ from Eastern Finland (11.1%). In the logistic regression model, the age-adjusted prevalence of pre-eclampsia was 1.92-fold in Northern (95% CI: 1.46–2.53, P<0.001) and 1.47-fold in Eastern Finland (95% CI: 1.11–1.96, P=0.008) compared with Southern Finland. The odds ratios (ORs) were 1.70 (95% CI: 1.21–2.38, P=0.002) and 1.16 (95% CI: 0.82–1.64, P=0.40), respectively, when adjusted for age at first birth, current age, parity, body mass index (BMI), increased blood cholesterol, hypertension, diabetes/impaired glucose tolerance, CAD, and mother's myocardial infarction. History of pre-eclampsia was associated with increased blood cholesterol, higher current BMI and blood pressure, and higher current prevalence of hypertension, diabetes/impaired glucose tolerance.
Conclusions Pre-eclampsia is most prevalent in the Northern part of Finland and could only be partly explained by higher prevalence of CAD risk factors.
Introduction
Pregnancy-induced hypertension and particularly pre-eclampsia are leading causes of foetal and maternal morbidity and mortality.1 Hypertensive disorders of pregnancy affect up to 15% of pregnancies.2 The exact incidence of pre-eclampsia is unknown, but in general it has been estimated to be between 5 and 8%.3 The incidences can be affected by the proportion of primigravidae in the different population but in addition there might be true regional differences superimposed. The first report on regional differences in pre-eclampsia frequency in Finland dates back to the 1930s showing higher frequency in Eastern compared with Western Finland.4
The different incidence figures of pre-eclampsia could also reflect different aetiopathogenetic factors in the given populations. Although placental immunogenetic factors have been considered necessary for the development of pre-eclampsia, maternal factors have also been shown to be of importance.5 Such maternal factors in pre-eclampsia (genetic, constitutional, and environmental) and associated changes (increased inflammatory markers, dyslipidaemia, insulin resistance, endothelial dysfunction, and oxidative stress) are also associated with increased risk for cardiovascular disease in later life.6 On the other hand, history of pre-eclampsia has also been reported to be a risk for several distinct cardiovascular conditions later in life.7–9 The aim of this study was to examine regional variation in the prevalence of pre-eclampsia in Finland. A further aim was to study the associations of pre-eclampsia with maternal factors common to coronary artery disease (CAD) and pre-eclampsia.
Subjects and methods
Subjects
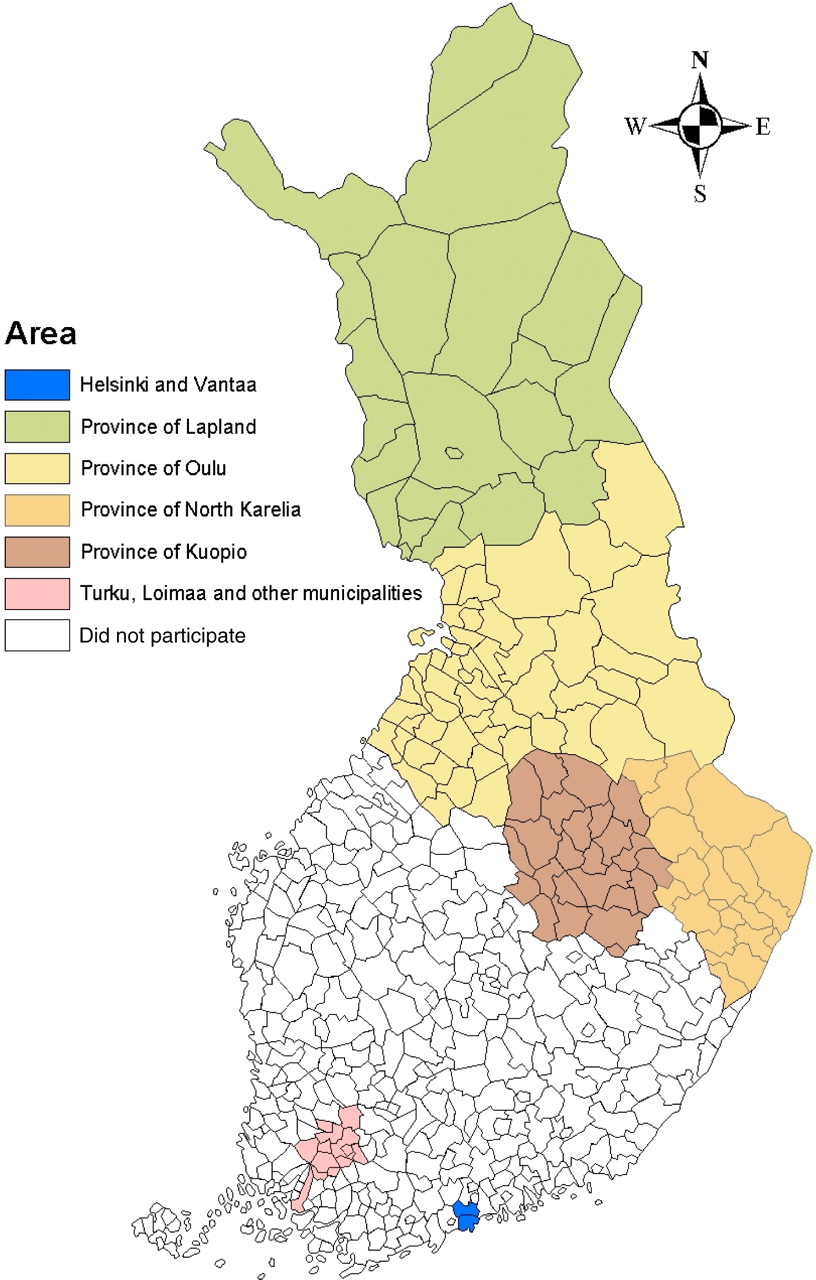
The FINRISK-study is a cross-sectional population survey that monitors cardiovascular risk factors in Finland at 5-year intervals.10 Six areas of Finland are included in the FINRISK-study: the cities of Helsinki and Vantaa, the south-western region, and North Karelia, Kuopio, Oulu, and Lapland provinces (Figure 1). The study sample is taken randomly from the population registry and consists of 25- to 64-year-old people in these areas. The sample is stratified so that at least 250 women and 250 men in each 10 year age group (25–34, 35–44, 45–54, 55–64 years), i.e. 2000 people, are included from each area. A total of 5978 women (aged 25–64 years) were invited to the FINRISK-study in 2002. The number of invited women varied from 993 to 999 between the six areas. The participation rate varied from 71.2 (Helsinki–Vantaa, n=710) to 79.2% (Lapland province, n=790). Of the women who participated in the study, 91.4–94.1% came for the measurements to the local health care centre in each area.
In this study, the six areas in the FINRISK-study were divided into Southern Finland (cities of Helsinki and Vantaa, and south-western region), Eastern Finland (North Karelia and Kuopio provinces), and Northern Finland (Oulu and Lapland provinces). The subjects in this study are women who participated in the FINRISK-study in 2002 and who have been pregnant (n=3650). This study complies with the Declaration of Helsinki.
Measurements
A separate study questionnaire for women concerning reproductive health was included in the FINRISK-study in 2002. The questionnaire included 51 questions about menstruation, contraception, pregnancies, pregnancy complications, deliveries, infertility, and use of hormone replacement therapy. The women were asked whether they had ever had (and in which year) pre-eclampsia (proteinuria and increased blood pressure after 20 weeks of gestation), gestational hypertension (>140/90 mmHg), or gestational diabetes during any pregnancy.11,12 The women also completed the main questionnaire including questions on medical history, health behaviour, and socio-economic factors. Additionally, the women were invited to a local health care centre, where trained staff measured their height, weight, waist and hip circumferences, blood pressure, and took blood samples.
Statistical analyses
Age, body mass index (BMI), increased blood cholesterol, hypertension, CAD, diabetes, impaired glucose tolerance, parents' myocardial infarctions or strokes, alcohol consumption, smoking, and education (the proportion of women in the highest tertile of education years) were reported by area. In addition to age, the variables in which regional differences were seen (except for alcohol consumption, smoking, and education) were later included in the logistic regression model as confounding factors
The proportions of women who had had pre-eclampsia, gestational hypertension, or gestational diabetes were compared between the areas by using the two-sided χ2-test. These proportions were determined separately in 10 year age groups and by the mother's myocardial infarction/stroke status. Age at first birth, age when a pregnancy complication occurred for the first time, parity, and time interval between last delivery and the year 2002 were compared between the areas by using two-sided analysis of variance. The pairwise comparisons were performed by using the Bonferroni method. For women who had more than four deliveries (n=124, 3.5%), we used the year of the fourth delivery because the years of later deliveries were not available. The Pearson correlation coefficients were calculated for age at first birth and each pregnancy complication.
We also studied the age-adjusted associations of pre-eclampsia with cardiovascular diseases, certain other diseases, and their risk factors in 2002. To test the statistical significance of the differences between women who had had pre-eclampsia and other women, the Student's t-test was used for means and χ2-test for proportions (both tests were two-sided). Logistic regression models were carried out to estimate separately the odd ratios (ORs) and 95% confidence intervals (CIs) of pre-eclampsia, gestational hypertension, and gestational diabetes for Eastern and Northern Finland compared with Southern Finland. We used the backwards stepwise model in which the variables that are not associated with the dependent variable are removed from the model. Model 1 only included the area and age in 2002. In Model 2, adjustments were made for several possible confounding factors, including age at first birth and age, parity, BMI, increased blood cholesterol (ever), hypertension (ever), diabetes or impaired glucose tolerance, CAD (determined as angina pectoris), and mother's myocardial infarction/apoplexy (all reported in 2002). As the linearity assumption was satisfied for age at first birth, age, parity, and BMI, they were included as continuous variables in the model.
Women who had missing values in any of the variables in the adjusted logistic regression model could not be included in the adjusted model (n=1344, 37% of 3650). To estimate the possibility of selection bias, we first performed the Model 1 (adjusted only for age) for women who were included in the Model 2. The odds ratios for pre-eclampsia were now 1.29 (95% CI: 0.93–1.80, P=0.131) for Eastern Finland and 1.83 (95% CI: 1.32–2.53, P<0.001) for Northern Finland—practically remaining the same. Second, we compared the characteristics of women who were included and excluded from the logistic regression model. More women were included in the adjusted model from Eastern Finland than from Southern or Northern Finland. The included women had more often had pre-eclampsia, increased blood cholesterol (ever), or increased blood pressure (ever) than the excluded women. Also the mothers and fathers of the included women had more often had a myocardial infarction/stroke than the parents of the excluded women. The included women were, on average, 6 years older in 2002 and they had also slightly higher age at first birth, parity, and BMI than the excluded women. The proportions of highly educated women and smokers and for alcohol intake were lower among the included women, compared with the excluded women. No statistically significant differences were observed in the prevalence of diabetes, impaired glucose tolerance, or angina pectoris. It is possible that a selection bias has affected the results of the adjusted logistic regression model (Model 2).
Results
Women living in Southern Finland were older, their BMI was slightly lower, and they had less often had increased blood cholesterol levels than women living in Eastern or Northern Finland (Table 1). The prevalence of diabetes mellitus was highest in Eastern and Northern Finland, whereas the prevalence of impaired glucose tolerance was highest in Northern Finland. Mother's myocardial infarctions and strokes were more common among women who were living in Eastern Finland than among women living in Southern Finland. Alcohol consumption was clearly higher in Southern Finland (1.6- to 1.7-fold) than in Eastern or Northern Finland. Prevalence of smoking was lower in Eastern Finland than in the other areas. The proportion of highly educated women was clearly highest in Southern Finland.
The proportion of women who had had pre-eclampsia was 1.8-fold in Northern Finland (13.9%) compared with Southern Finland (7.9%) (Table 2). Also, women in Eastern Finland had more often had pre-eclampsia than women in Southern Finland, but the difference was not statistically significant. When the analysis was carried out separately in 10 year age groups, the results were essentially the same. Pre-eclampsia occurred during first pregnancy in 67.5%, 69.8%, and 64.6% in women living in Southern, Eastern, and Northern Finland, respectively (non-significant difference between the areas). Of the pre-eclamptic women, 65% in Southern, 81% in Eastern, and 87% in Northern Finland had been living in the same area during childhood.
In addition to regional differences, the proportion of women who had had pre-eclampsia varied between women whose mothers had had a myocardial infarction or stroke and other women (14.2 vs. 10.2%, P=0.002). The analysis was also performed separately by the myocardial infarction/stroke status of their mothers. Interestingly, the differences in the prevalence of pre-eclampsia between Northern and Southern Finland were observed in both groups. However, the difference was larger in women whose mother had had a myocardial infarction or stroke [16.9 (95% CI: 11.9–21.9) vs. 7.8% (95% CI: 3.9–11.7)] than in women whose mothers had not [13.2 (95% CI: 11.1–15.3) vs. 7.6% (95% CI: 5.8–9.4)]. Also the difference in the prevalence of pre-eclampsia between Eastern and Southern Finland was statistically significant in women whose mothers had had a myocardial infarction or stroke [16.0 (95% CI: 11.7–20.3) vs. 7.8% (95% CI: 3.9–11.7)], but not in the other women [9.6 (95% CI: 7.7–11.5) vs. 7.6% (95% CI: 5.8–9.4)].
There were no differences between the areas in the proportions of women who had had gestational hypertension or gestational diabetes (Table 2). Also, no differences were observed between the areas when the data were analysed separately in the 10 year age groups or by mother's myocardial infarction/stroke status. In addition, no regional differences were observed in gestational hypertension or gestational diabetes in the logistic regression models, when adjusted for age and other possible confounders.
Age at first birth was highest in Southern Finland and lowest in Northern Finland (Table 2). No differences were observed, between the areas, concerning the age when the first pregnancy complication occurred. Correlations between age at first birth and age at first pre-eclampsia was 0.72 (P<0.001); between age at first birth and age at first gestational hypertension 0.37 (P<0.001); and between age at first birth and age at first gestational diabetes also 0.37 (P<0.001). Parity was higher in Northern Finland than in Eastern Finland, and lowest in Southern Finland. The difference in parity between Eastern and Southern Finland was also statistically significant. There were no differences between the areas in the time interval between the last delivery and the year 2002.
In addition, we compared the age-adjusted levels of cardiovascular diseases and some of their risk factors in 2002 between women who had had pre-eclampsia and other women. Women with pre-eclampsia had a higher BMI, and higher systolic and diastolic blood pressure, but they consumed less alcohol than women who had never had pre-eclampsia (Table 3). Also hypertension, history of increased blood cholesterol, heart insufficiency, CAD (angina pectoris), diabetes, and impaired glucose tolerance were more common among women who had had pre-eclampsia than those who had not. Pre-eclampsia was not associated with prevalence of smoking, cancer, or level of blood cholesterol.
In the logistic regression model (Model 1), women in Northern Finland had 1.92-fold (P<0.001) and women in Eastern Finland 1.47-fold (P=0.008), pre-eclampsia compared with the women in Southern Finland (Table 4), when adjusted for age. The odds ratios (ORs) for regional differences decreased a little after adjusting for several confounding factors (Model 2). In Model 2, age, BMI, hypertension, CAD (measured in 2002), and mother's myocardial infarctions were associated with pre-eclampsia in the final fifth step, although BMI and mother's myocardial infarctions did not reach statistical significance. Age at first birth, parity, increased blood cholesterol level, and diabetes mellitus/impaired glucose tolerance (in 2002) were not associated with pre-eclampsia.
Discussion
This report showed distinct differences in prevalence of pre-eclampsia in three major regions of Finland. It was highest in Northern Finland (13.9%) and lowest in Southern Finland (7.9%, P=0.001). This regional difference remained significant even after adjustment for several maternal factors such as age at first birth, current age, parity, BMI, increased blood cholesterol (ever), hypertension (ever), diabetes/impaired glucose tolerance, CAD, and mother's myocardial infarction.
The study population was a representative sample of 25- to 64-year-old women living in six areas of Finland. Information on BMI, blood pressure, and blood cholesterol in 2002 was based on measurements. However, all other data including information on pregnancy complications were self-reported, which may have caused some recall bias. Since the women included in the logistic regression analysis (Model 2) were possibly selected towards more risk factors and prevalent heart disease, the differences between regions may have been slightly too large.
The prevalence of pre-eclampsia has been estimated to be between 5 and 8%,3 corresponding to our results from Southern Finland, but in the Northern part of Finland the prevalence was significantly higher. This prevalence can be affected by the proportion of primigravidae in the different populations but our results, with no differences in this respect (64.6–69.8%), would indicate that true regional differences were superimposed. Parity was higher in the North than in the South, but was not identified as an independent risk factor for pre-eclampsia. Although the first report on regional differences in pre-eclampsia frequencies in Finland date back to the 1930s, the diagnostic criteria were different and do not allow us to make comparisons with the present study.4 Also, the author had studied nearly 12 000 pre-eclamptic, proteinuric, non-hypertensive, and eclamptic patients in the Southern part of Finland over 10 years and showed more of this pregnancy complication in Eastern than in Western or Southern Finland. Northern Finland was not studied.
These regional differences could reflect maternal risk factors common to pre-eclampsia and CAD.8 In this study, women from the North were more obese, had higher prevalence of high serum cholesterol, diabetes, and glucose intolerance at the time of the study, some 20 years after pre-eclamptic pregnancy. These results concerning parous women reflect the results of the whole female population of the FINRISKI 2002 trial (n=4554), with lower serum cholesterol, systolic blood pressure, and BMI in Southern than Northern/Eastern Finland.10 We have shown earlier that women with pre-eclampsia are more insulin resistant during pregnancy and 3 months postpartum than their normotensive controls and these women are more hyperinsulinaemic and hyperandrogenic 17 years after pre-eclamptic pregnancy.13–15 Pre-eclampsia has been proposed to be one of the manifestations of the insulin resistance (metabolic) syndrome16,17 and could be a bridge between pre-eclampsia and atherosclerotic events later in a woman's life.8,9,18,19 Our results showing that women with a history of pre-eclamptic pregnancy had a higher prevalence of clusters of the metabolic syndrome (hypertension, obesity, glucose intolerance/diabetes mellitus) than their controls is in good in agreement with the notion indicating that pre-eclamptic women preserve their ability towards insulin resistance syndrome later in life.8
The only risk factor that is not shared by CAD and pre-eclampsia is smoking, as it seems to protect from pre-eclampsia20 and be a strong risk factor for CAD.21 Our results are in line with this notion as the frequency of smokers was not highest in the Northern Finland and did not differ in women with or without history of pre-eclampsia.
Contrary to pre-eclampsia, no regional differences were observed in gestational hypertension or gestational diabetes. Pre-eclampsia seems to be a distinct disorder and the regional factor along with hypertension, age, and CAD, are independent risk factors for it. Of interest was the finding that maternal myocardial infarction also tended to be an independent risk factor, suggesting inheritance of common risk factors for CAD (essential hypertension and type 2 diabetes) and perhaps of CAD itself.8 Furthermore, we cannot exclude inheritance of susceptility genes for pre-eclampsia to explain the regional differences in Finland.22
Our findings further support that there are common risk factors for CAD and pre-eclampsia. That is why women with history of pre-eclampsia (and gestational diabetes) should be followed after pregnancy and advised on lifestyle changes especially to prevent obesity.
Figure 1 The areas in the FINRISKI 2002 study.
Background characteristics in the year 2002 by area
| Southern Finland (n=1063) | Eastern Finland (n=1276) | Northern Finland (n=1311) | |
|---|---|---|---|
| Age in 2002, yearsa | 47.5 (46.8–48.1) | 46.3 (45.8–46.9) | 46.1 (45.5–46.7) |
| BMI, kg/m2 | 26.1 (25.8–26.4) | 27.0 (26.7–27.3) | 26.7 (26.4–26.9) |
| Increased blood cholesterol, ever, % | 31.9 (28.6–35.2) | 38.1 (35.2–41.0) | 36.1 (33.0–39.2) |
| Hypertension, ever, % | 36.0 (33.1–38.9) | 39.4 (36.7–42.1) | 38.3 (35.6–41.0) |
| Coronary artery disease (angina pectoris), during the last 12 months, % | 1.4 (0.7–2.1) | 1.9 (1.2–2.7) | 1.8 (1.1–2.5) |
| Diabetes, % | 1.0 (0.4–1.6) | 2.9 (2.0–3.8) | 2.3 (1.5–3.1) |
| Impaired glucose tolerance, % | 1.5 (0.8–2.2) | 1.7 (1.0–2.4) | 3.0 (2.1–3.9) |
| Myocardial infarction/stroke | |||
| In mother, % | 17.6 (15.3–19.9) | 22.7 (20.4–25.0) | 21.3 (19.1–23.5) |
| In father, % | 34.8 (31.9–37.7) | 37.2 (34.5–39.9) | 37.3 (34.6–40.0) |
| At least in one of the parents, % | 44.2 (41.2–47.2) | 47.2 (44.5–49.9) | 47.4 (44.7–50.1) |
| Alcohol consumption, g/previous weeka | 52.3 (47.7–56.9) | 33.2 (30.4–36.1) | 30.7 (28.2–33.3) |
| Smoking, % | |||
| Do not smoke | 55.3 (52.3–58.3) | 63.9 (61.3–66.5) | 54.5 (51.8–57.2) |
| Smoker | 25.7 (23.1–28.3) | 20.4 (18.2–22.6) | 24.6 (22.2–26.9) |
| High education, % | 38.0 (35.1–40.9) | 27.9 (25.4–30.4) | 27.1 (24.7–29.5) |
Proportion of missing values 0–8.5% (n=0–309).
aMean (95% CI).
All other data proportion (95% CI).
Pregnancy complications by area
| Southern Finland (n=1063) | Eastern Finland (n=1276) | Northern Finland (n=1311) | P | |
|---|---|---|---|---|
| Pre-eclampsia, %a | 7.9 (6.3–9.5) | 11.1 (9.4–12.8) | 13.9 (12.0–15.8) | <0.001 |
| Gestational hypertension, %a | 15.9 (13.7–18.1) | 18.2 (16.0–20.4) | 17.5 (15.3–19.7) | 0.346 |
| Gestational diabetes, %a | 8.5 (6.8–10.2) | 7.9 (6.4–9.4) | 8.9 (7.3–10.5) | 0.665 |
| Age at first birth, yearsb | 25.7 (25.4–26.0) | 24.7 (24.4–25.0)* | 24.2 (23.9–24.4)* | <0.001 |
| Age at first pregnancy complication, yearsb | ||||
| Pre-eclampsia | 27.2 (25.8–28.6) | 26.3 (25.3–27.2) | 26.6 (25.8–27.5) | 0.544 |
| Gestational hypertension | 29.9 (28.5–31.3) | 28.4 (27.3–29.5) | 28.9 (27.7–30.1) | 0.266 |
| Gestational diabetes | 30.4 (29.2–31.6) | 29.6 (28.2–31.1) | 30.4 (29.0–31.9) | 0.660 |
| Parityb | 1.9 (1.8–2.0) | 2.2 (2.1–2.3)* | 2.4 (2.3–2.5)* | <0.001 |
| Time interval between the last delivery and the year 2002, yearsc | 17.9 (17.2–18.7) | 17.2 (16.6–17.8) | 17.1 (16.5–17.7) | 0.167 |
Missing values: pre-eclampsia 2.5% (n=91), gestational hypertension 5.5% (n=200), gestational diabetes 4.8% (n=174).
aProportion (95% CI).
bMean (95% CI).
cFor women with more than four deliveries (n=124, 3.5%), we used data on the fourth delivery as data on the later deliveries were not available.
*P<0.01 compared with Southern Finland (Bonferroni test).
Risk factors and diseases in 2002 by pre-eclampsia status
| Pre-eclampsia (n=397) | No pre-eclampsia (n=3162) | P | |
|---|---|---|---|
| Age, yearsa | 47.9 (46.9–48.9) | 46.4 (46.0–46.7) | 0.006 |
| BMI, kg/m2a | 27.7 (27.2–28.2) | 26.2 (26.0–26.4) | <0.001 |
| Alcohol consumption, g/previous weeka | 30.8 (25.2–36.5) | 37.5 (35.5–39.6) | 0.027 |
| Smokers, %b | 21.5 (17.7–25.8) | 22.5 (21.0–24.0) | 0.650 |
| Diabetes, %b | 3.4 (2.1–5.7) | 1.7 (1.3–2.3) | 0.019 |
| Impaired glucose tolerance, %b | 3.5 (2.1–5.8) | 1.8 (1.4–2.3) | 0.019 |
| Cancer, %b | 0.8 (0.3–2.1) | 0.7 (0.4–1.0) | 0.758 |
| Blood cholesterol, mmol/La | 5.4 (5.3–5.5) | 5.4 (5.4–5.5) | 0.751 |
| Increased blood cholesterol, ever, %b | 39.0 (33.9–44.4) | 31.4 (29.5–33.3) | 0.006 |
| Medication for high blood cholesterol, uses at the moment, %b | 3.5 (2.2–5.5) | 2.4 (1.7–3.2) | 0.071 |
| Systolic blood pressure, mmHga | 134 (132–135) | 128 (127–129) | <0.001 |
| Diastolic blood pressure, mmHga | 79 (78–80) | 76 (75–76) | <0.001 |
| Hypertension, during the last 12 months, %b | 31.8 (27.3–36.8) | 12.4 (11.2–13.6) | <0.001 |
| Hypertension, ever, %b | 73.8 (69.1–78.0) | 32.7 (30.9–34.4) | <0.001 |
| Medication for high blood pressure, ever used,c %b | 52.9 (46.8–59.0) | 29.2 (26.5–32.1) | <0.001 |
| Cardiac insufficiency, during the last 12 months, %b | 2.9 (1.6–5.1) | 0.7 (0.5–1.2) | <0.001 |
| CAD (angina pectoris), during the last 12 months, %b | 2.5 (1.4–4.3) | 0.8 (0.5–1.2) | <0.001 |
aAge-adjusted mean (95% CI).
bProportion (95% CI).
cOf women who have ever had hypertension.
Adjusted regional differences in pre-eclampsia
| Variables in the final model | Model 1a | Model 2b | ||
|---|---|---|---|---|
| Pre-eclampsia OR (95% CI) | P | Pre-eclampsia OR (95% CI) | P | |
| Area | ||||
| Southern Finland | 1.0 (–) ref. | 1.0 (–) ref. | ||
| Eastern Finland | 1.47 (1.11–1.96) | 0.008 | 1.16 (0.82–1.64) | 0.403 |
| Northern Finland | 1.92 (1.46–2.53) | <0.001 | 1.70 (1.21–2.38) | 0.002 |
| Age, years | 1.02 (1.01–1.03) | 0.003 | 0.98 (0.97–0.99) | 0.004 |
| BMI, kg/m2 | — | — | 1.02 (1.00–1.05) | 0.074 |
| Hypertension (ever) | — | — | 4.80 (3.59–6.40) | <0.001 |
| CAD | — | — | 2.53 (1.20–5.35) | 0.015 |
| Mother's myocardial infarction | — | — | 1.32 (0.98–1.77) | 0.069 |
aModel 1: adjusted for age (in 2002).
bModel 2: adjusted for age at first birth and age, parity, BMI, increased blood cholesterol (ever), hypertension (ever), diabetes or impaired glucose tolerance, CAD (angina pectoris), and mother's myocardial infarction/apoplexy (all reported in 2002). Due to missing values, n=2306 (63% of 3650) in Model 2.
References
Onrust S, Santema JG, Aarnoudse JG. Pre-eclampsia and the HELLP syndrome still cause maternal mortality in The Netherlands and other developed countries: can we reduce it?
Lyall F, Greer I. The vascular endothelium in normal pregnancy and preeclampsia.
Sibai BM, Caritis S, Hauth J. What we have learned about preeclampsia. Review, Tutorial.
Pelkonen E. Untersuchungen uber die frequenzschwankungen der nierengestosen in Finnland und die auf sie einwirkenden factoren.
Lain KY, Roberts JM. Contemporary concepts of the pathogenesis and management of preeclampsia.
Hannaford P, Ferry S, Hirsch S. Cardiovascular sequelae of toxaemia of pregnancy.
Sattar N, Greer IA. Pregnancy complications and maternal cardiovascular risk.
Haukkamaa L, Salminen M, Laivuori H, Leinonen H, Hiilesmaa V, Kaaja R. Risk for subsequent coronary artery disease after preeclampsia.
Laatikainen T, Tapanainen H, Alftan G, Salminen I, Sundvall J, Leiviska J, Harald K, Jousilahti P, Salomaa V, Vartiainen E. FINRISKI 2002. Publications of the National Public Health Institute, B 7, Helsinki 2003, pages
National High Blood Pressure Education Programme, Report of the National High Blood Pressure Education Programme Working Group on High Blood Pressure in Pregnancy.
Suhonen L, Teramo K. Hypertension and preeclampsia in women with gestational diabetes.
Kaaja R, Laivuori H, Laakso M, Tikkanen MJ, Ylikorkala O. Evidence of a state of increased insulin resistance in preeclampsia.
Laivuori H, Tikkanen MJ, Ylikorkala O. Hyperinsulinemia 17 after preeclamptic first pregnancy.
Laivuori H, Kaaja R, Rutanen EM, Viinikka L, Ylikorkala O. Evidence of high circulating testosterone in women with prior preeclampsia after preeclamptic pregnancy.
Kaaja R, Tikkanen M, Viinikka L, Ylikorkala O. Serum lipoproteins, insulin and urinary excretion of prostanoid metabolites in normal and hypertensive pregnant women.
Seely E, Solomon CG. Insulin resistance and its potential role in pregnancy-induced hypertension.
Wilson BJ, Watson MS, Prescott GJ, Sunderland S, Campbell DM, Hannaford P, Smith WCS. Hypertensive diseases of pregnancy and risk of hypertension and stroke in later life: results from a cohort study.
Smith GCS, Pell JP, Walsh D. Pregnancy complications and maternal risk of ischaemic heart disease: a retrospective cohort study of 129 290 births.
Lain KY, Wilson JW, Crombleholme WR, Ness RB, Roberts JM. Smoking during pregnancy is associated with alterations in markers of endothelia function.
Gurevitz O, Jonas M, Boyko V, Rabinowitz B, Reicher-Reiss H. Clinical profile and long-term prognosis of women <50 or =50 years of age referred for coronary angiography for evaluation of chest pain.

