


Abstract
The Haydom, Tanzania, site (TZH) of The Etiology, Risk Factors and Interactions of Enteric Infections and Malnutrition and the Consequences for Child Health and Development (MAL-ED) Study is in north-central Tanzania, 300 km from the nearest urban center. TZH is in a remote rural district where most of the population are agropastoralists and grow maize as the staple food. The average household size is 7. The average woman achieves a parity of 6 and has 1 child death. Socioeconomic indicators are poor, with essentially no household having access to electricity, piped water, or improved sanitary facilities (compared with 14%, 7%, and 12%, respectively, reported nationally). The Demographic Health Survey Tanzania 2004 indicated that the region had high rates of stunting and underweight (40% and 31% of children aged <5 years had a height-for-age z score and weight-for-age z score, respectively, of <−2 ) and an under-5 child mortality rate of 5.8%. Human immunodeficiency virus prevalence among 18-month-old children is <0.5%. TZH represents a remote rural African population with profound poverty and malnutrition, but a strong community-based research infrastructure.
The MAL-ED (original project title: Etiology, Risk Factors, and Interactions of Enteric Infections and Malnutrition and the Consequences for Child Health and Development [MAL-ED] study) network is conducting a multicountry, longitudinal prospective cohort study on the etiology, risk factors, and interactions of enteric infections and malnutrition, and the consequences of these factors on child growth, cognitive development, and vaccine response. The 8 study sites are epidemiologically and geographically diverse and comprised of low-income populations. The 8 MAL-ED cohort sites are located in Bangladesh, Brazil, India, Nepal, Pakistan, Peru, South Africa, and Tanzania. In this paper, we contextualize the Haydom, Tanzania (TZH) site, report on how the site was selected, describe the data that informed our cohort recruitment strategy, and describe features of this rural sub-Saharan African community.
METHODS
Haydom is situated in the north-central part of Tanzania, approximately 300 km from Arusha, the nearest urban center (Figure 1). Haydom is a rural area characterized by poor road infrastructure in a highland setting. The population of approximately 20 000 inhabitants is primarily dependent on subsistence agriculture, with some market sales of food products among inhabitants. Haydom Lutheran Hospital (HLH) [1] is the central hub for Haydom. The HLH catchment area consists of 4 administrative divisions in 3 districts and 2 regions. These are the Dongobesh and Haydom divisions in Mbulu District (Manyara Region), the Basotu Division in Hanang District (Manyara Region), and the Nduguti Division in Iramba District (Singida Region).
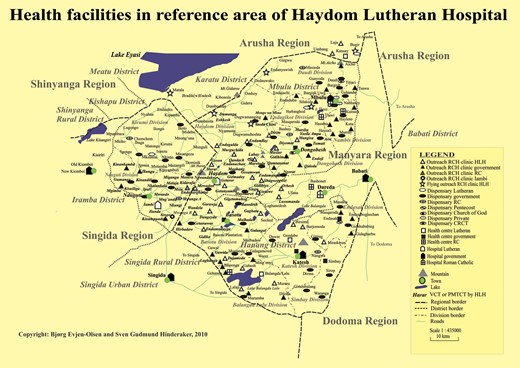
Map of the study area in Haydom, Tanzania. Prepared by B. E. Olsen and S. G. Hinderaker 2010. Abbreviations: CRCT, Christian Revival Church of Tanzania; HLH, Haydom Lutheran Hospital; RC, Roman Catholic; RCH, reproductive and child health; PMTCT, prevention of mother-to-child transmission; VCT, voluntary counselling and testing.
Haydom is ethnically and geographically diverse [2, 3]. Villages in the TZH site lie between 2 branches of the Great Rift Valley, and are situated at various elevations around the highland plateau where the hospital is located (1700 m above sea level). Languages spoken in Haydom are diverse and represent all of the 4 African language families: Afro-Asiatic, Khoisan, Nilo-Saharan, and Niger-Kordofanian. The MAL-ED cohort study population primarily comprises Iraqw- (Afro-Asiatic) and Datoga-speaking (Nilo-Saharan) peoples. Those identifying as Bantu-speaking are intermixed in TZH communities but represent a minority population. In part, the population structure is reflective of the area's colonial history. European colonial administrators encouraged the settled Iraqw to occupy and plant crops on the grazing lands of their pastoral neighbors. By cooperating, the Iraqw peoples were able to gain political power, and their population expanded throughout the region and grew rapidly [4]. The Datoga were considered hostile and aggressive by colonial administrators, and their mobile pastoral lifestyle was viewed as threatening to colonial rule. As a result, the Datoga grazing lands were transformed into agricultural fields and their pastoral lifestyle was stigmatized [3]. As a consequence, the pastoral Datoga remaining in the area have been pushed to marginal environments, making the raising of cattle, goat, and sheep more challenging; others have left the area and migrated southward toward more fertile grazing lands. Those remaining in the TZH area have lost their large herds, and have intermarried and adopted the maize-growing subsistence strategy of the Iraqw [3].
TZH was selected as a cohort site for the MAL-ED study for several reasons. First, the growth data indicated that rates of malnutrition in the Manyara region were comparatively high (height-for-age z score [HAZ] <−2, 40%; weight-for-age z score [WAZ] <−2, 31%) [5].
Second, HLH has a strong and trusted relationship with the Haydom community and has capable laboratory capacity. HLH is a 450-bed hospital owned by the Mbulu Diocese of the Evangelical Lutheran Church in Tanzania [6]. Founded in 1955, HLH is now fully incorporated into the national health plan under the Ministry of Health [6].
Third, HLH has an efficient reproductive child health system (RCHS) that provides primary healthcare to the mothers and children throughout the region. The RCHS is organized as 38 outreach clinics across 74 villages. Some of these villages are reachable only by Missionary Avian Fellowship airplane due to the poor road infrastructure and long distances from HLH. In 2006, the HLH RCHS reached 8164 new mothers and 8378 new children, across a total catchment area for the outreach clinics of 295 581 individuals. Children are followed monthly from age 0 to 60 months to measure growth (weight) and provide appropriate vaccinations, and in 2006, 100 809 total child examinations were performed at the outreach clinics [6]. Human immunodeficiency virus (HIV) is a known risk factor for malnutrition and could potentially have an impact in our study. According to a community study conducted in 2004, HIV seroprevalence among women attending antenatal care in Haydom was <2% [7], with a predicted 18-month cumulative risk of 0.45% [8]. These low rates are due to successful RCHS prevention efforts as well as an effective prevention of mother-to-child transmission program at HLH. Given this low risk in the study area, HIV testing was not applied in this study. Although data specific to Haydom are not available, in rural areas of Tanzania, under-5 mortality is reported to be 5.8%. In the 2004 Demographic Health Survey, about 11% of Tanzanian children suffered from diarrhea in the preceding 2 weeks [5].
Selection of MAL-ED Cohort Study Area
According to the 2004 Demographic and Health Survey, the Manyara region had relatively high rates of stunting and underweight (40% and 31% of children aged <5 years had HAZ and WAZ <−2) [5]. Therefore, study staff first extracted growth data from RCHS records to identify areas in the Haydom catchment area with high rates of fertility and malnutrition to best support recruitment of mother–infant dyads into the study. RCHS data from 2007 indicated that the clinics in 2 villages (area A) had a high prevalence of malnutrition as well as adequate birth rates to allow for recruitment [6]. The initial plan was to center the MAL-ED study around these 2 villages, located approximately 20 km and 40 km from HLH. However, as the surveillance plan was clarified, the feasibility of conducting twice-weekly surveillance at these distances from HLH became doubtful. Households in these 2 villages are spread over great distances, such that the logistics and the requirements for specimen transport would require a significant number of field staff and high transportation costs.
Therefore, due to these significant constraints, we examined options for study sites closer to HLH. There was some concern that proximity to the hospital could bias the study toward children with better access to healthcare and improved growth. To assess the effect of proximity to the hospital, in July 2009 we conducted a community survey comprised of a representative sample of children living in 5 areas (B–F) at various distances from HLH (n = 379 households) that would allow for comparisons to the original site considered (area A). The response rate for the survey was 99.5%. The survey, administered by MAL-ED TZH field staff, included questions about household composition, ethnicity, language spoken to preschool children, housing and roofing material, level of maternal education, gravidity/parity, place of last delivery, and anthropometrics of the youngest child. This community survey revealed that rates of stunting (HAZ <−2) were comparable in all 5 areas, and that the original site (area A) and community sites (areas B–F) were not statistically different (HAZ: F = 0.2, P = .64; WAZ: F = 3.5, P = .06). Therefore, because the differences between the original site considered (area A) and the proposed sites (areas B–F) were not significant and health status of the populations was similar, areas B–D were selected as the MAL-ED cohort study sites (Table 1). Areas B–D was accessible and representative of the health disparities present in the districts and region comprising Haydom (Figure 1).
Community Survey to Examine Relationship Between Growth and Proximity to Haydom Lutheran Hospital
| Characteristic | Original (A) | Area B | Area C | Area D | Area E | Area F |
|---|---|---|---|---|---|---|
| Distance from HLH | ∼20 km | ∼9.5 km | ∼7 km | ∼9 km | ∼20 km | ∼30 km |
| No. of households visited | 217 | 34 | 33 | 27 | 39 | 29 |
| Balozi (village leaders) units visited | 10 | 2 | 2 | 2 | 2 | 2 |
| Expected births per month in entire village | 3.4 | 8.5 | 9.2 | 5.6 | 8.1 | 4.8 |
| Anthropometry, No. (age <3 y) | 184 | 29 | 13 | 16 | 19 | 19 |
| HAZ % <−2 | 38% | 38% | 23% | 63% | 32% | 32% |
| HAZ average | −1.5 | −1.5 | −1.2 | −2.0 | −1.3 | −1.4 |
| WAZ % <−2 | 15% | 3% | 8% | 25% | 5% | 16% |
| WAZ average | −0.7 | −0.6 | −0.6 | −0.7 | −0.8 | −0.9 |
Abbreviations: HAZ, height-for-age z score; HLH, Haydom Lutheran Hospital; WAZ, weight-for-age z score.
TZH MAL-ED Community Census
MAL-ED TZH field staff conducted a target area census to estimate the number of births that would occur each month in the selected study communities (ie, areas B–D). To calculate this, we estimated that we would need to survey >700 households. Before conducting the survey, the TZH study staff held several meetings with about 60 village leaders, or balozi (ie, 10-cell leader), to explain our intentions, the study's purpose, and to secure their support for and legitimize the study at the local level. The leaders helped by holding village meetings to raise awareness of the study and recruitment among the households in their respective communities. They also functioned as an important and effective communication channel between MAL-ED study staff and community members, by reporting community concerns and/or misperceptions so that clarifications could be made.
A total of 728 households were surveyed. Basic demographic data to document the number of women of childbearing age, their current reproductive status, where the most recent birth occurred, and their access to RCHS antenatal care were collected. Data were also collected about the language(s) spoken in the household. The information on languages spoken facilitated the hiring of field staff with appropriate language skills and the translation of measurement instruments.
Informed by the census results, MAL-ED TZH staff determined that to ensure an enrollment of 11 mother–infant dyads per month into the study, 33 women in their third trimester would need to be identified each month. Among the 728 households surveyed, 42 women were in their third trimester of pregnancy. The goal for the MAL-ED cohort was to recruit 200 children over 2 years. The children would then be followed over a 2-year period. To account for an estimated attrition rate of 8% each year over 4 years, 132% of the needed households were included, giving an enrollment target of 264 mother–infant dyads.
After establishing the study area boundaries, we attempted to recruit all pregnant women so that randomization or stratification would not be necessary. We decided to recruit and enroll at the household level instead of at HLH, as 50% of women reported giving birth at home on their last delivery. Therefore, reliance on a hospital subset would have introduced selection bias and made recruitment and enrollment more difficult. MAL-ED cohort enrollment officially began in November 2009.
Socioeconomic Status of the MAL-ED Tanzania Cohort
Within the study catchment boundaries, 100 households were randomly selected to participate in a pilot survey to help define how to best capture the socioeconomic status (SES) of the cohort population. Responses to a number of socioeconomic questions (eg, education, housing, water and sanitation, wealth indicators) were gathered [9]. A final SES survey was conducted in the MAL-ED cohort at 6 months in the study follow-up. These SES data allow a comparison of the target area of the study with Tanzanian national demographic data [10] (Table 2). In TZH, many of the demographic features were similar to national trends; however, there were important differences indicative of rural marginalization among these communities including a lower rate of access to electricity (0% study site vs 14.2% national) and piped water (0% vs 7.4%), more unprotected or surface water sources for drinking (71% vs 41.0%), and more mud and less concrete used as housing floor (96% vs 68.2%).
Comparison of 2 Local Socioeconomic Status Surveys With National Figures
| Characteristic | SES TZH Catchment Area (n = 100) | SES of MAL-ED Cohort After 6 mo (n = 246) | DHS 2010 [10] Tanzania |
|---|---|---|---|
| Mean age of mother, y | 33.1 | 29.2 | NA |
| Women aged 15–49 with no education | 14.0% | 15.3% | 19.1% |
| Median years of school for women aged 15–49 | 7.0 | 7.0 | 6.3 |
| Median age of first pregnancy, y | 20.0 | 20.0 | 19.5 |
| Average No. of pregnancies | 5.0 | 4.6 | 6.0a |
| Average live births | 5.0 | 4.3 | NA |
| Average of child deaths | 1.0 | 1.3 | NA |
| Iraqw speakers | 90% | 89.5% | NA |
| Rooms used for sleeping | 2.5 | 2.1 | 2.2 |
| People in household | 7.8 | 6.7 | 4.9 |
| Births (last delivery) in a health facility | NA | 50.4% | 50.2% |
| Births with reported birth weight <2.5 kg | NA | 2.7% | 6.9% |
| Households with domestic workers | 2.0% | 3.3% | NA |
| Households with electricity | 0.0% | 0.4% | 14.2% |
| Source of drinking water | |||
| Piped into dwelling, yard/plot | 0.0% | 0.8% | 7.4% |
| Public tap/standpipe | 16.0% | 13.4% | 24.6% |
| Tube well or borehole | 13.0% | 12.6% | 2.4% |
| Protected well | 0.0% | 4.9% | 4.1% |
| Unprotected well/spring | 52.0% | 42.7% | 22.3% |
| Surface water (river/dam/lake/pond/ stream/canal/irrigation canal) | 19.0% | 25.2% | 18.7% |
| Other | NA | 0.4% | 20.5% |
| Households that treat drinking water | NA | 50.4% | 60.2% |
| Type of toilet facility | |||
| No facility/bush/field/bucket | 39.0% | 19.9% | 13.7% |
| Pit latrine without slab | 60.0% | 76.4% | 65.8% |
| Improved, not shared facility | 0.0% | 0.0% | 11.5% |
| Other | 1.0% | 3.7% | 9.0% |
| Type of cooking fuel used | |||
| Open fire | 100% | 98.7% | 94.6% |
| Gas/kerosene | 0% | 0% | 3% |
| Other | 0% | 1.2% | 2.4% |
| Type of material used for floor | |||
| Mud | 96% | 92.3% | 68.2% |
| Cement/concrete | 4% | 5.3% | 29.5% |
| Other | 0% | 2.4% | 3.2% |
| Type of material used for roof | |||
| Thatch | 45% | 38.2% | 38.1% |
| Metal | 48.0% | 48.8% | 60.1% |
| Other | 7% | 13.0% | 1.8% |
| Type of material used for wall | |||
| Mud | 54% | 85.8% | 55.1% |
| Wood | NA | 4.1% | 1.5% |
| Cement/concrete/burned brickb | 46% | 10.6% | 14.8% |
Abbreviations: DHS, Demographic and Health Survey; NA, not available; SES, socioeconomic status; TZH, Haydom, Tanzania.
a For DHS, this is lifetime cumulative, age 40–49 years.
b Difference between TZH catchment area SES and MAL-ED SES on this category due to different classifications of burned brick.
Descriptive Studies of Food and Water in the MAL-ED TZH Cohort
These SES survey indicators led us to pursue other potential associations with malnutrition. In particular, we wanted to learn more about water, maize, weaning foods, and the use of iodized salt by the TZH cohort. As such, several activities unique to this MAL-ED cohort study site were pursued by the TZH study team. We collected local and store-purchased salt and performed iodine spot tests [11], and found that of 184 local-salt-using households 165 (89.7%) had no detectable iodine. By contrast, of the 19 (10.3%) households that purchased commercial iodized salt, this salt did have measurable iodine; however, it was at lower levels than advertised. Only 11 of 19 samples (58%) had measured iodine in the range recommended by the World Health Organization (WHO) (15–40 ppm) [12]. These results suggest in the TZH MAL-ED cohort a risk for iodine deficiency with consequent sequelae.
Due to the high reported use of unprotected water sources, a household water quality study was conducted on 51 water samples from households in the TZH cohort. Water samples were evaluated for coliform count (Colilert) and had an overall mean of 21 colonies/mL; 34 (78%) of these water samples were either of “high” or “very high” risk levels per WHO guidelines [13], with only 11 (21%) at a “low” risk level. Households that used an improved source of water had fewer colonies (17 colonies/mL vs 23 colonies/mL among unprotected sources; P < .05). Furthermore, the amount of time required to fetch water was a salient factor. In trips that were <30 minutes, there were 13 colonies/mL, and in trips that were >30 minutes, there was an average of 24 colonies/mL (P < .05). Most respondents did not perform any treatment on the water, with 69% of the 51 households merely permitting water to stand to settle sediment. When water was treated, 17% of households reported boiling water, and 6% reported straining water through a cloth to remove sediment.
Weaning foods in the TZH cohort include fermented animal milk, alone or mixed with maize porridge. Raw milk is fermented at the household level using a dedicated gourd that contains the starter cultures. Seventy-four milk samples from the MAL-ED cohort households were collected and cultured. Seventy of the samples grew >106 colony-forming units/mL lactic acid bacteria and had a pH of ≤4.5, indicating fermentation and a reduced pH sufficient to inhibit many enteropathogens [14]. However, 33 (45%) samples grew gram-negative rods, indicating potential survival of acid-tolerant enteropathogens [15]. Maize is generally of low nutritive value, characterized by low protein. We tested maize samples from a subset of the cohort (n = 57) and found the average maize protein percentage in Haydom to be within expected ranges (7.1%–13.4%, with 8% considered average in Tanzania [16]). There was no correlation between maize protein percentage, soil nitrogen levels (LaMotte Soil Test Kit), or planting practices (fertilizer type or usage; n = 48 households; data not shown).
CONCLUSIONS
The MAL-ED TZH cohort represents a socioeconomically marginalized and rural sub-Saharan African agricultural community. Socioeconomic indicators within this cohort are lower than many national averages. Stunting rates are high and presumed to be linked to dietary insufficiency, poor water quality, and attendant enteropathogens.
Certain aspects of the TZH site merit specific comment. First, the study site is extremely remote; thus, we have observed little in- and out-migration of the cohort, presenting a superb site for stable community-based studies. However, this remoteness also challenges procurement, which for MAL-ED was successful only through close collaboration with the Kilimanjaro Clinical Research Institute (in Moshi, Tanzania, where many supplies were initially received) and the Missionary Aviation Fellowship (which flew supplies from Moshi/Arusha to Haydom at subsidized rates). A further challenge was the staffing of the research team, as trained and experienced research personnel are scarce in Tanzania, particularly in such a remote and rural region. This challenge was partially mitigated by a U.S. National Institutes of Health–funded training grant between the University of Virginia and the Kilimanjaro Clinical Research Institute, which allowed the MAL-ED investigators to train and employ research personnel specifically for the MAL-ED study. The entire research team was as large as 40 individuals. Additionally, the intensity and unprecedented size and scope of this study were a challenge. Frequent communication and collaboration with HLH administration and staff were absolutely critical to implementing this study.
An important aspect of our recruitment strategy was to minimize selection bias. We addressed this by defining a representative catchment, screening every mother in the area for eligibility, and successfully recruiting 99% of children born to eligible mothers. The pilot SES study with 100 randomly selected household independently confirmed that our participants were similar in SES level to other households in the area and that the distance to the hospital had minimal relationship to nutritional status. Compared to the Tanzanian population, socioeconomic indicators are poor for this area, where essentially no household has access to electricity, piped water, or improved sanitary facilities (compared with 14%, 7%, and 12%, respectively, reported nationally). By other measures, such as maternal education and deliveries at health facility, TZH data are typical.
In summary, the TZH MAL-ED cohort is likely representative of other remote rural sub-Saharan African communities where health disparities are often masked when national data are aggregated. Clearly, the Tanzanian study site is characterized by extreme poverty and high malnutrition rates. The findings of our initial studies and those that will be revealed by the entire MAL-ED study will help to distill the interactive effects of socioeconomic, dietary, and microbiologic factors on longitudinal patterns of growth of these children.
Notes
Acknowledgments. The authors thank the staff and participants of the MAL-ED Network for their important contributions.
Financial support. The Etiology, Risk Factors, and Interactions of Enteric Infections and Malnutrition and the Consequences for Child Health and Development Project (MAL-ED) is carried out as a collaborative project supported by the Bill & Melinda Gates Foundation, the Foundation for the National Institutes of Health, and the National Institutes of Health, Fogarty International Center.
Supplement sponsorship. This article appeared as part of the supplement “The Malnutrition and Enteric Disease Study (MAL-ED): Understanding the Consequences for Child Health and Development,” sponsored by the National Institutes of Health and the Foundation for the National Institutes of Health.
Potential conflicts of interest. All authors: No potential conflicts of interest.
All authors have submitted the ICMJE Form for Disclosure of Potential Conflicts of Interest. Conflicts that the editors consider relevant to the content of the manuscript have been disclosed.


Comments