Abstract
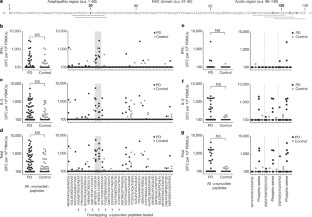
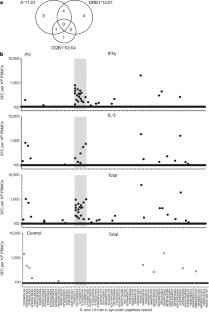
Genetic studies have shown the association of Parkinson’s disease with alleles of the major histocompatibility complex1,2,3. Here we show that a defined set of peptides that are derived from α-synuclein, a protein aggregated in Parkinson’s disease4, act as antigenic epitopes displayed by these alleles and drive helper and cytotoxic T cell responses in patients with Parkinson’s disease. These responses may explain the association of Parkinson’s disease with specific major histocompatibility complex alleles.
This is a preview of subscription content, access via your institution
Access options
Access Nature and 54 other Nature Portfolio journals
Get Nature+, our best-value online-access subscription
$29.99 / 30 days
cancel any time
Subscribe to this journal
Receive 51 print issues and online access
$199.00 per year
only $3.90 per issue
Buy this article
- Purchase on Springer Link
- Instant access to full article PDF
Prices may be subject to local taxes which are calculated during checkout


References
Greenbaum, J. et al. Functional classification of class II human leukocyte antigen (HLA) molecules reveals seven different supertypes and a surprising degree of repertoire sharing across supertypes. Immunogenetics 63, 325–335 (2011)
Hamza, T. H. et al. Common genetic variation in the HLA region is associated with late-onset sporadic Parkinson’s disease. Nat. Genet. 42, 781–785 (2010)
Kannarkat, G. T. et al. Common genetic variant association with altered HLA Expression, synergy with pyrethroid exposure, and risk for Parkinson’s Disease: an observational and case–control study. NPJ Parkinson’s Dis. 1, 15002 (2015)
Spillantini, M. G., Crowther, R. A., Jakes, R., Hasegawa, M. & Goedert, M. α-Synuclein in filamentous inclusions of Lewy bodies from Parkinson’s disease and dementia with lewy bodies. Proc. Natl Acad. Sci. USA 95, 6469–6473 (1998)
Marrack, P. & Kappler, J. W. Do MHCII-presented neoantigens drive type 1 diabetes and other autoimmune diseases? Cold Spring Harb. Perspect. Med. 2, a007765 (2012)
Foix, C. & Nicolesco, J. Cérébrale: Les Noyauz Gris Centraux Et La Région Mésencephalo-Soue-Optique. SuiviD’Un Appendice Sur L’Anatomic Pathologique De La Maladie De Parkinson (Masson et Cie., 1925)
Cebrián, C., Loike, J. D. & Sulzer, D. Neuroinflammation in Parkinson’s disease animal models: a cell stress response or a step in neurodegeneration? Curr. Top. Behav. Neurosci. 22, 237–270 (2015)
Brochard, V. et al. Infiltration of CD4+ lymphocytes into the brain contributes to neurodegeneration in a mouse model of Parkinson disease. J. Clin. Invest. 119, 182–192 (2009)
Wissemann, W. T. et al. Association of Parkinson disease with structural and regulatory variants in the HLA region. Am. J. Hum. Genet. 93, 984–993 (2013)
Cebrián, C. et al. MHC-I expression renders catecholaminergic neurons susceptible to T-cell-mediated degeneration. Nat. Commun. 5, 3633 (2014)
Mor, F., Quintana, F., Mimran, A. & Cohen, I. R. Autoimmune encephalomyelitis and uveitis induced by T cell immunity to self β-synuclein. J. Immunol. 170, 628–634 (2003)
Theodore, S., Cao, S., McLean, P. J. & Standaert, D. G. Targeted overexpression of human α-synuclein triggers microglial activation and an adaptive immune response in a mouse model of Parkinson disease. J. Neuropathol. Exp. Neurol. 67, 1149–1158 (2008)
Benner, E. J. et al. Nitrated α-synuclein immunity accelerates degeneration of nigral dopaminergic neurons. PLoS ONE 3, e1376 (2008)
Harms, A. S. et al. MHCII is required for α-synuclein-induced activation of microglia, CD4 T cell proliferation, and dopaminergic neurodegeneration. J. Neurosci. 33, 9592–9600 (2013)
Vita, R. et al. The immune epitope database (IEDB) 3.0. Nucleic Acids Res. 43, D405–D412 (2015)
Kim, K. S. et al. Proteolytic cleavage of extracellular α-synuclein by plasmin: implications for Parkinson disease. J. Biol. Chem. 287, 24862–24872 (2012)
Hossain, S. et al. Limited proteolysis of NACP/α-synuclein. J. Alzheimers Dis. 3, 577–584 (2001)
Fujiwara, H. et al. α-Synuclein is phosphorylated in synucleinopathy lesions. Nat. Cell Biol. 4, 160–164 (2002)
Anderson, J. P. et al. Phosphorylation of Ser-129 is the dominant pathological modification of α-synuclein in familial and sporadic Lewy body disease. J. Biol. Chem. 281, 29739–29752 (2006)
Wang, W. et al. Caspase-1 causes truncation and aggregation of the Parkinson’s disease-associated protein α-synuclein. Proc. Natl Acad. Sci. USA 113, 9587–9592 (2016)
Kasai, T. et al. Cleavage of normal and pathological forms of α-synuclein by neurosin in vitro. Neurosci. Lett. 436, 52–56 (2008)
Li, W. et al. Aggregation promoting C-terminal truncation of α-synuclein is a normal cellular process and is enhanced by the familial Parkinson’s disease-linked mutations. Proc. Natl Acad. Sci. USA 102, 2162–2167 (2005)
Dufty, B. M. et al. Calpain-cleavage of α-synuclein: connecting proteolytic processing to disease-linked aggregation. Am. J. Pathol. 170, 1725–1738 (2007)
Brahmachari, S. et al. Activation of tyrosine kinase c-Abl contributes to α-synuclein-induced neurodegeneration. J. Clin. Invest. 126, 2970–2988 (2016)
Hernandez, D. G., Reed, X. & Singleton, A. B. Genetics in Parkinson disease: Mendelian versus non-Mendelian inheritance. J. Neurochem. 139, 59–74 (2016)
Martinez-Vicente, M. et al. Dopamine-modified α-synuclein blocks chaperone-mediated autophagy. J. Clin. Invest. 118, 777–788 (2008)
Cuervo, A. M., Stefanis, L., Fredenburg, R., Lansbury, P. T. & Sulzer, D. Impaired degradation of mutant α-synuclein by chaperone-mediated autophagy. Science 305, 1292–1295 (2004)
Orenstein, S. J. et al. Interplay of LRRK2 with chaperone-mediated autophagy. Nat. Neurosci. 16, 394–406 (2013)
Luk, K. C. et al. Pathological α-synuclein transmission initiates Parkinson-like neurodegeneration in nontransgenic mice. Science 338, 949–953 (2012)
Atik, A., Stewart, T. & Zhang, J. α-Synuclein as a biomarker for Parkinson’s disease. Brain Pathol. 26, 410–418 (2016)
Petrich de Marquesini, L. G. et al. IFN-γ and IL-10 islet-antigen-specific T cell responses in autoantibody-negative first-degree relatives of patients with type 1 diabetes. Diabetologia 53, 1451–1460 (2010)
Arif, S. et al. Peripheral and islet interleukin-17 pathway activation characterizes human autoimmune diabetes and promotes cytokine-mediated β-cell death. Diabetes 60, 2112–2119 (2011)
Matheoud, D. et al. Parkinson’s disease-related proteins PINK1 and Parkin repress mitochondrial antigen presentation. Cell 166, 314–327 (2016)
Alcalay, R. N. et al. Glucocerebrosidase activity in Parkinson’s disease with and without GBA mutations. Brain 138, 2648–2658 (2015)
Hughes, A. J., Ben-Shlomo, Y., Daniel, S. E. & Lees, A. J. What features improve the accuracy of clinical diagnosis in Parkinson’s disease: a clinicopathologic study. 1992. Neurology 57, S34–S38 (2001)
Paul, S. et al. HLA class I alleles are associated with peptide-binding repertoires of different size, affinity, and immunogenicity. J. Immunol. 191, 5831–5839 (2013)
Oseroff, C. et al. Molecular determinants of T cell epitope recognition to the common Timothy grass allergen. J. Immunol. 185, 943–955 (2010)
McKinney, D. M. et al. Development and validation of a sample sparing strategy for HLA typing utilizing next generation sequencing. Hum. Immunol. 76, 917–922 (2015)
Paul, S. et al. A population response analysis approach to assign class II HLA-epitope restrictions. J. Immunol. 194, 6164–6176 (2015)
Sidney, J. et al. Measurement of MHC/peptide interactions by gel filtration or monoclonal antibody capture. Current Protoc. Immunol. 18, 18.13 (2013)
Cheng, Y. & Prusoff, W. H. Relationship between the inhibition constant (K1) and the concentration of inhibitor which causes 50 per cent inhibition (I50) of an enzymatic reaction. Biochem. Pharmacol. 22, 3099–3108 (1973)
Gulukota, K., Sidney, J., Sette, A. & DeLisi, C. Two complementary methods for predicting peptides binding major histocompatibility complex molecules. J. Mol. Biol. 267, 1258–1267 (1997)
Sidney, J. et al. Divergent motifs but overlapping binding repertoires of six HLA-DQ molecules frequently expressed in the worldwide human population. J. Immunol. 185, 4189–4198 (2010)
Mao, X. et al. Pathological α-synuclein transmission initiated by binding lymphocyte-activation gene 3. Science 353, aah3374 (2016)
Acknowledgements
Supported by the JPB (D.S., T.M.D), William F. Richter (D.S.), Michael J. Fox (A.S., D.S.) and Parkinson’s Foundations (A.S., D.S.). X.M., V.L.D. and T.M.D. are supported by NIH/NINDS grant P50 NS38377. X.M. is supported by NIA ADRC P50AG005146. T.M.D. is the Abramson Professor. X.M., V.L.D. and T.M.D. acknowledge joint support by AHMMRF, JHH and JHUSOM Parkinson’s disease program, M-2014.
Author information
Authors and Affiliations
Contributions
D.S. and A.S. conceived the study and wrote the paper. C.S.L.A. and F.G. contributed to writing and prepared figures. R.N.A. and L.C. recruited participants and performed clinical evaluations. C.L., J.A.-L. and A.F. maintained patient data and assisted in subject recruitment. E.K. arranged tissue handling and maintained records. F.G., C.O., J.P., M.B.D., C.C., D.W., E.P., S.M., B.P., W.H.H., C.M. and C.S.L.A. conducted analyses of T cells and antigenic epitopes. X.M., V.L.D. and T.M.D. prepared and characterized α-syn proteins and fibrils. J.S. performed in vitro MHC-binding assays.
Corresponding authors
Ethics declarations
Competing interests
Columbia University filed a patent application for the use of α-syn peptides as biomarkers (US patent application number 15/300,713). D.S. (Columbia University) and A.S. (La Jolla Institute for Allergy and Immunology) are listed as inventors.
Additional information
Reviewer Information Nature thanks M. Tansey and the other anonymous reviewer(s) for their contribution to the peer review of this work.
Publisher's note: Springer Nature remains neutral with regard to jurisdictional claims in published maps and institutional affiliations.
Vanderbilt University School of Medicine, Nashville, Tennessee 37235, USA
Extended data figures and tables
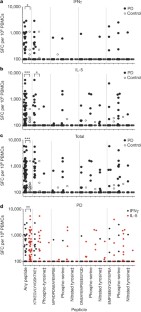
Extended Data Figure 1 T cell reactivity against (wild-type and post-translationally modified) α-syn peptides.
Magnitude of responses, expressed as the total magnitude (SFC per 106 PBMCs) of response per peptide and participant combination. Responses against any α-syn 15-mer peptide spanning S129 and Y39, ‘any peptide’, Parkinson’s disease (n = 209), control (n = 132); and responses against individual α-syn 15-mer peptides spanning S129 and Y39. Each dot represents a peptide and participant combination. Closed circles, Parkinson’s disease (n = 19); open circles, control (n = 12). Two-tailed Mann–Whitney U-test, *P < 0.05, **P < 0.01, ***P < 0.001. a, IFNγ response. b, IL-5 response. c, Total (IFNγ and IL-5 combined) response.
Extended Data Figure 2 Characterization of α-syn-specific responses in Parkinson’s disease.
a, Gating strategy. T cells were gated based on CD3 expression. Boolean gating was used to define cytokine-producing cells expressing CD4 and/or CD8. b, Percentage of total cytokine detected from CD3+ T cells in response to α-syn peptides. Each point represents one participant (n = 9); mean ± s.d. are indicated. Dotted line indicates 0.05% cut-off for specific cytokine production by CD3+ T cells. c, Percentage of responding T cells that produce each cytokine, IFNγ, IL-4, IL-10 and IL-17. Each point represents one participant that exceeded the cut-off (n = 6), mean ± s.d. are indicated. d, Percentage of responding T cells that are CD4+, CD8+, CD4−CD8−, or CD4+CD8+ T cells. Each point represents one participant (n = 6), mean ± s.d. are indicated.
Extended Data Figure 3 Specific T cell reactivity against native or fibrilized α-syn.
Magnitude of responses, expressed as the average spots per 106 PBMC, of response per protein and participant with Parkinson’s disease or peptide and participant with Parkinson’s disease combination (n = 12 Parkinson’s disease participants, each represented by a different symbol). The lines connect discrete values from each individual participant and are present to provide a means to compare responses within and between individuals. The difference between response to unstimulated compared to peptides, the native α-syn and PFF groups is significant by the Wilcoxon signed-rank one-tailed test (values are shown in the figure). No significant difference (Wilcoxon signed-rank two-tailed test) in response to PFF and native protein was apparent in this relatively small sample.
Extended Data Figure 4 HLA-DR surface expression across DRB1*15:01+ or DRB1*15:01− participants with Parkinson’s disease and healthy controls.
a, Gating strategy for FACS analysis. After eliminating non-lymphocytes and doublet cells by forward- and side-scatter, cells were gated based on HLA-DR expression. b–e, HLA-DR and CD3 expression of cells from participants (black, HLA-DR antibody; red, isotype control) with Parkinson’s disease that carry (b; n = 5) and do not carry (c; n = 5) the DRB1*15:01 allele and healthy controls (HC) that carry (d; n = 3) and do not carry (e; n = 5) the DRB1*15:01 allele. f, g, 721.221 (f) and RM3 (g) cells are used as controls that do not and do express HLA class II, respectively. h, Mean fluorescent intensities (MFI) ± s.d. of HLA-DR expression for each participant cohort. i, Percentage of living cells that express HLA-DR. Data are mean ± s.d.
Extended Data Figure 5 HLA class I surface expression across DRB1*15:01+ or DRB1*15:01− participants with Parkinson’s disease and healthy controls.
a, Gating strategy for FACS analysis. After eliminating non-lymphocytes and doublet cells by forward- and side-scatter, cells were gated based on HLA-ABC expression. b–e, HLA-ABC and CD3 expression of cells from participants (black, HLA-ABC antibody; red, isotype control) with Parkinson’s disease that carry (b; n = 5) and do not carry (c; n = 5) the DRB1*15:01 allele and healthy controls that carry (d; n = 3) and do not carry (e; n = 5) the DRB1*15:01 allele. f, g, 721.221 (f) and RM3 (g) cells are used as controls that do not and do express HLA class I, respectively. (h) Mean fluorescent intensities (MFI) ± s.d. of HLA-ABC expression for each participant cohort.
Supplementary information
Supplementary Information
This file contains Supplementary Tables 1-4. (PDF 238 kb)
Rights and permissions
About this article
Cite this article
Sulzer, D., Alcalay, R., Garretti, F. et al. T cells from patients with Parkinson’s disease recognize α-synuclein peptides. Nature 546, 656–661 (2017). https://doi.org/10.1038/nature22815
Received:
Accepted:
Published:
Issue Date:
DOI: https://doi.org/10.1038/nature22815
This article is cited by
-
The involvement of α-synucleinopathy in the disruption of microglial homeostasis contributes to the pathogenesis of Parkinson’s disease
Cell Communication and Signaling (2024)
-
Modeling the neuroimmune system in Alzheimer’s and Parkinson’s diseases
Journal of Neuroinflammation (2024)
-
Human serum-derived α-synuclein auto-antibodies mediate NMDA receptor-dependent degeneration of CNS neurons
Journal of Neuroinflammation (2024)
-
Th1 cells contribute to retinal ganglion cell loss in glaucoma in a VCAM-1-dependent manner
Journal of Neuroinflammation (2024)
-
Immunological aspects of central neurodegeneration
Cell Discovery (2024)
Comments
By submitting a comment you agree to abide by our Terms and Community Guidelines. If you find something abusive or that does not comply with our terms or guidelines please flag it as inappropriate.


