


Introduction
Respiratory tract infections can result in serious illness and death, and have a substantial impact on health care systems [Reference Monto1, Reference Szilagyi2]. Understanding the burden of respiratory tract infections on health and health care services is a key part of improving public health. Firstly, knowing which pathogens are currently causing the most serious illness may inform public health actions, e.g. the prescribing of anti-viral drugs during periods when influenza is circulating [3]. Secondly, understanding the relative burden of different pathogens over time on a population level will inform priorities for public health interventions, e.g. vaccination policies, public health campaigns and public health messaging. Many pathogens have considerable seasonal variation in community incidence; thus, in temperate countries like England, there is an additional burden on health care services during the winter due to seasonal respiratory pathogen activity.
In England, family doctors (general practitioners; GPs) provide the majority of health care. However, the majority of patients presenting to a GP with a respiratory tract infection do not require laboratory testing to confirm the responsible pathogen and doctors will treat patients empirically. Therefore, it is not possible to directly calculate specific pathogen burden on all respiratory tract infections presenting to GPs. Our study models the associations between respiratory pathogen incidence from laboratory reports and GP consultation data for respiratory tract infections. We then estimate the relative contribution of different respiratory pathogens to the seasonal excess in GP consultations for respiratory disease (defined as ‘burden’).
Methods
Data extraction
We extracted weekly positive laboratory reports from the Public Health England (PHE) Second Generation Surveillance System (SGSS). SGSS was commissioned on 1 December 2014 and comprises a single system for the extraction of data from all laboratories in England. Due to the delay in the reporting of some laboratory tests [Reference Noufaily4], we excluded the most recent 6 months of available data as being potentially incomplete. The data used were therefore based on a specimen collection date between International Standards Organisation (ISO) week 3 2011 and week 37 2015.
We included respiratory pathogens in the analysis that were available from routine laboratory testing in England and that previous work had found to be important, based upon clinical and microbiological expertise and experience [Reference Szilagyi2, Reference Cooper5–Reference Hughes9]. Human metapneumovirus (HMPV), respiratory syncytial virus (RSV), coronavirus, influenza (A and B), invasive Haemophilus influenzae, invasive Streptococcus pneumoniae, Mycoplasma pneumoniae, parainfluenza and rhinovirus were included. For organisms causing invasive disease (H. influenzae and S. pneumoniae), tests using either blood or cerebrospinal fluid were included; for the other pathogens, specimen types included were cultures, antigen detection, genomic polymerase or ligase chain reaction detection.
For the purposes of our study, we used GP consultation data, i.e. data extracted from computerised medical records with a coded entry, recorded through national GP in- and out-of-hours surveillance systems [Reference Kumarapeli and de Lusignan10]. PHE extracts anonymised health data, including a range of symptoms and syndromes from a number of healthcare service providers across England. Counts of symptoms and syndromes are aggregated into a number of syndromic ‘indicators,’ e.g. influenza-like illness, cough, vomiting, rash. The numbers of weekly GP consultation counts for upper and lower respiratory tract infections (added together termed ‘respiratory tract infections’) were extracted from the PHE GP in-hours syndromic surveillance system (GPIHSSS) [Reference Harcourt11]. Data were analysed as rates per 100 000 registered GP patients using the GP patient registered population as the denominator.
We extracted consultation data on GP out-of-hours and unscheduled care services from the PHE GP out-of-hours syndromic surveillance system (GPOOHSSS) [Reference Harcourt12]. GP out-of-hours consultation data for acute respiratory infection (ARI) were extracted using an automated process, using the data with the clinician-recorded Read codes [13–Reference O'Neil, Payne and Read15]. To allow for any variations in system coverage, ARI data were analysed as percentages of total Read-coded consultation data.
Statistical analysis
We used multiple linear regression to identify any significant positive associations between laboratory reports for seasonal pathogens and syndromic data for GP diagnosed respiratory tract infections. We selected multiple linear regression to enable comparison with previously published work on telehealth call [Reference Cooper5], emergency department attendance [Reference Hughes9] and GP consultation data [Reference Fleming16, Reference Fleming17]. Specifically, we used fixed-effects, least-squares regression, with GP consultation data, as the dependent variable and laboratory reports and the number of public holidays within each week as the covariates [Reference Ryan18]. The model for estimating respiratory consultation count data on week t (W t) was:
 $$W_t = C + \; \mathop \sum \nolimits^ \alpha _iL_{it} + \; \beta H_t,$$
where C was a constant (representing the number of respiratory counts not associated with the pathogens studied), L it was the number of laboratory reports for pathogen I during week t and H t was the number of public holidays within week t. We used forward stepwise regression to identify which pathogens were significantly correlated to GP consultation data, including in the final model those covariates that were significant with a P-value under 0.05.
Age-specific models
In order to understand differences between patient age bands, we created separate models for each age band using the same methodology as for all ages. Four age bands were used to represent pre-school age children (under 5 years old), school-age children (5–14 years), working age adults (15–64 years) and older adults (65 years and over).
Model lags
There is a potential delay between patients presenting with symptoms and the collection of laboratory samples. Therefore, additional regression models were analysed incorporating lags of between 1 and 4 weeks for each pathogen. The lagged model was  $W_t = C + \; \mathop \sum \nolimits^ \alpha _iL_{i(t + j)} + \; \beta H_t$, where j is a member of {1,2,3,4}. We created separate covariates for each pathogen giving the laboratory counts 1, 2, 3 or 4 weeks after the GP consultation counts. Subsequently, we replaced covariates for pathogens in our models with their lagged counterparts and checked for changes in model fit. We used the adjusted R 2 value to identify whether using lagged covariates improved model fit. The R 2 statistic is sufficient for comparing model fit where the only difference between alternate models is the lag in one covariate, adjusted R 2 is preferred when the model includes more than one covariate.
Regression models were analysed to test the robustness of model fit, including examining residuals. Additionally, we explored the impact of adding and subtracting pathogens. In particular, we considered both the impact of coefficient inclusion on the overall model and on other coefficients. Models were checked to ensure that the removal of one pathogen coefficient did not result in a big change in magnitude or a change in the sign of the remaining coefficients, which would be indicative of an ill-specified model.
The burden of seasonal pathogens
We estimated the number of respiratory tract infections from GP consultation data that were associated with specific pathogens from the regression models. That is, we multiplied model coefficients by actual laboratory counts to calculate the pathogen-specific burden each week.
For GP in-hours consultation data, the burden was expressed in terms of a typical general practice (the premises of a GP working in the community) consisting of 10 000 registered patients. However, for GP out-of-hours patient registration data, representing the population covered was not available and therefore could not be used for presenting the data. Therefore, for GP out-of-hours, we expressed the relative burden of different pathogens in terms of each 1000 patients seen with a Read-coded diagnosis available.
Age-specific burden
In order to calculate the number of patients presenting to GPs based on our age-specific models, we initially had to estimate the age distribution of GP consultation data. Therefore, for GP out-of-hours, we based the age distribution on the mean of all GP out-of-hours Read-coded consultation data during the period. For GP in-hours consultation data, we based the age distribution for the example general practice with 10 000 registered patients on the mean age distribution in England of all registered patients across GPIHSSS (from April 2013 when age-specific data were available).
Results
Data volume
The study included 107 149 positive laboratory reports for the selected respiratory pathogens, a mean of 440 per week across each year of the study period. As expected, the volume of reports varied considerably by pathogen from 130 per week for influenza and 105 for RSV to just four per week for coronavirus.
During the period studied (week 3 2011 to week 37 2015), the weekly mean cross-sectional population included in the GPIHSSS was 24.9 million patients. The total GP in-hours consultation data recorded for upper and lower respiratory tract infections was 12 million, equivalent to 29 consultations per week in a general practice with 10 000 registered patients, ranging from 12 in the quietest week to 89 in the busiest week studied.
GPOOHSSS recorded 23.6 million Read-coded consultation data during the period, including 3.9 million for ARI. ARI consultation data varied from 1200 to 47 800 on the busiest week (the last week in 2012). Similarly, the proportion (of all Read-coded consultation data) coded to ARI ranged from 0.09 to 0.56 during the period studied.
Statistical analysis
We found strong associations (14 values of adjusted R 2 over 80%) between GP consultation data (both GP in- and out-of-hours) and laboratory reports. The largest and most statistically significant associations with GP in- and out-of-hours consultation data were found for two pathogens, influenza and RSV. The regression models that included just these two pathogens explained most of the variation (adjusted R 2 values over 77%). However, the addition of other pathogens into the final models improved the model fit (Table 1).
Table 1. Adjusted R 2 values for selected all ages regression models

GPIHSSS, GP in-hours syndromic surveillance system; GPOOHSSS, GP out-of-hours syndromic surveillance system; RSV, respiratory syncytial virus; HMPV, human metapneumovirus.
In addition to RSV and influenza, there were also positive significant associations between GP consultation data for respiratory tract infections, and both parainfluenza and HMPV. Specifically, for in-hours GP consultation data, HMPV was associated with upper but not lower respiratory tract infections. Additionally, rhinovirus was associated with GP in-hours but not out-of-hours consultation data. On the other hand, invasive S. pneumoniae and M. pneumoniae were associated with GP out-of-hours but not in-hours consultation data.
A clear correspondence can be seen when comparing time series between incidence peaks in influenza, RSV and GP respiratory tract infections (Fig. 1). However, the contribution of other pathogens was more subtle with less pronounced seasonal peaks. Neither coronavirus nor invasive H. influenzae were found to have significant associations and were not included in the all ages models.
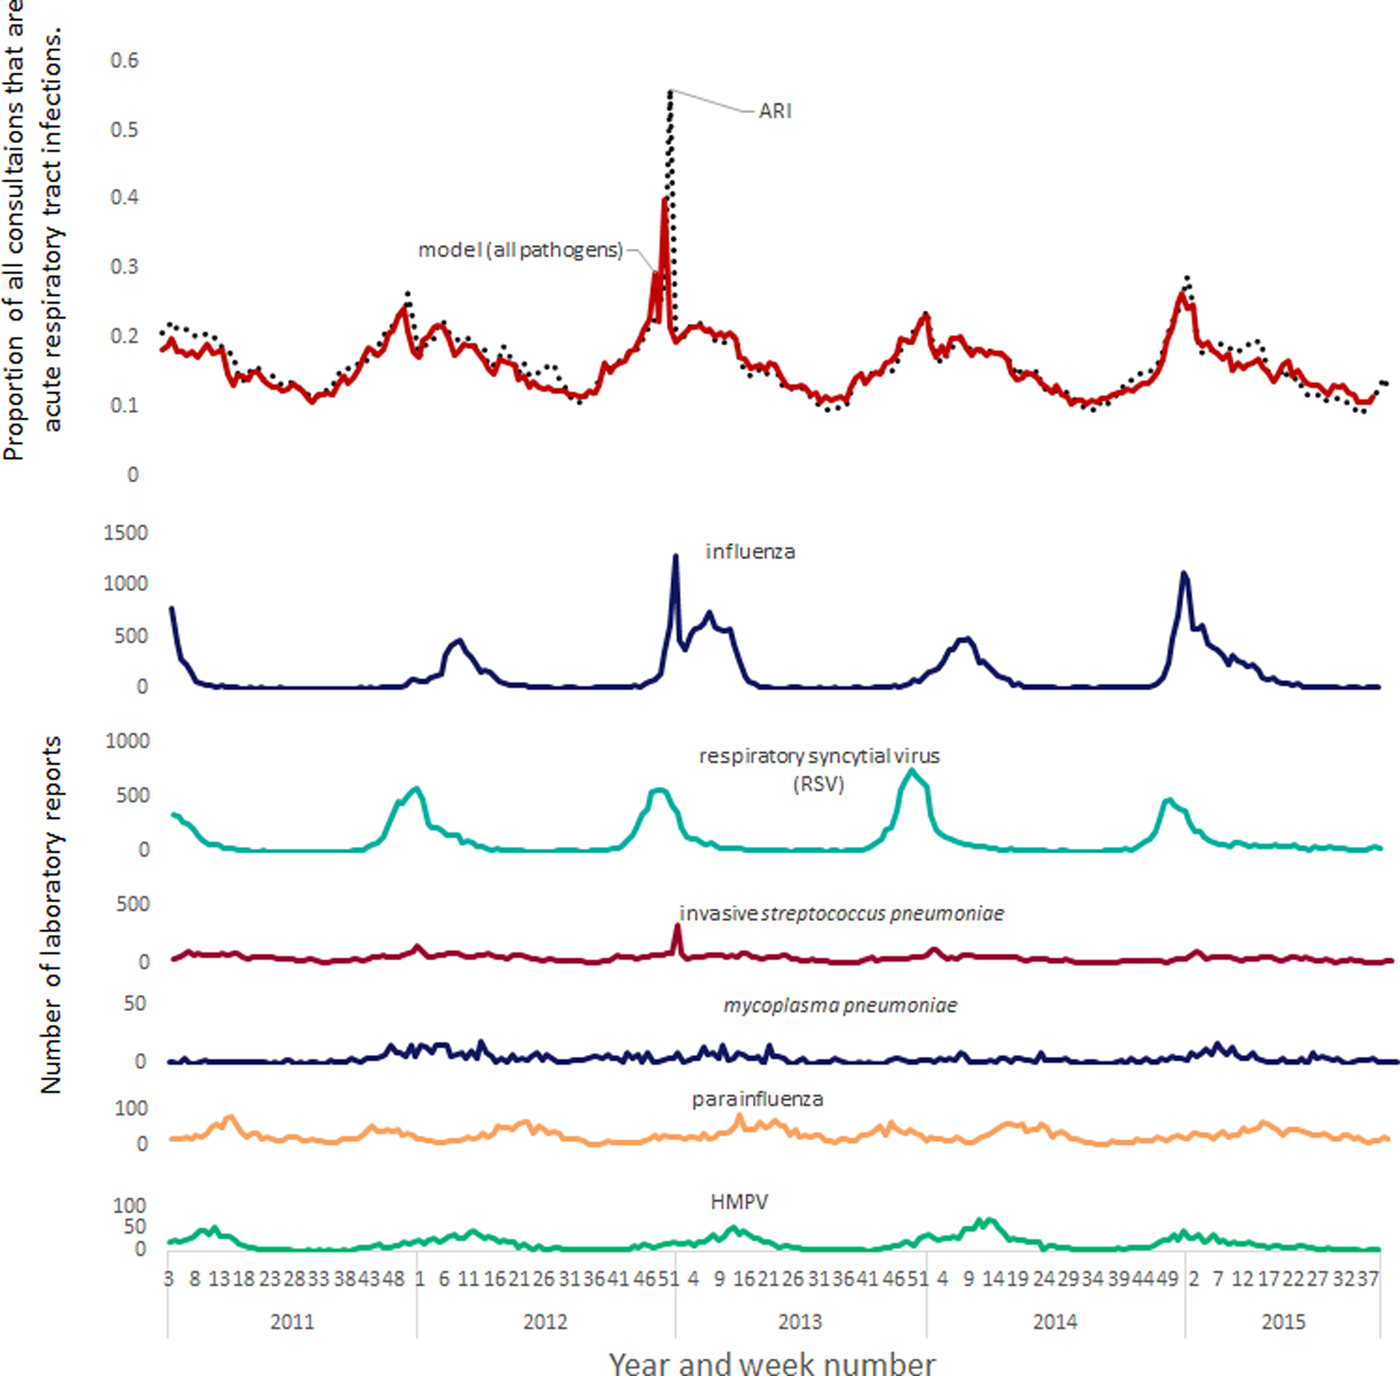
Fig. 1. Modelled contribution of seasonal pathogens to GP out-of-hours and unscheduled care acute respiratory tract infections.
Age-specific models
Influenza and RSV had strong positive associations for every age band; however, some pathogens were found to only have significant positive associations with certain age bands (Table 2). There were positive associations in children aged under 5 years between parainfluenza and both GP in-hours and out-of-hours consultation data. Similarly all the best-fitting models for school-aged children (5–14 years) were positively associated with rhinovirus. By contrast, invasive S. pneumoniae was associated with all the models for adults aged 65 years and over, but not in any of the models involving pre-school age children.
Table 2. Pathogens included in age-specific regression models with adjusted R 2 values

GPIHSSS, GP in-hours syndromic surveillance system; GPOOHSSS, GP out-of-hours syndromic surveillance system; LRTI, lower respiratory tract infection; URTI, upper respiratory tract infection; ARI, acute respiratory infection; RSV, respiratory syncytial virus; HMPV, human metapneumovirus.
Model lags
Model fit, as measured by the adjusted R 2 value, was found to improve when lags were included to allow for delays between GP consultation data and laboratory specimen date. However, the inclusion of lagged data did not alter which pathogens were associated with GP consultation data and the models without lags still had high adjusted R 2 values.
The number of weeks that laboratory specimen dates lagged behind GP consultation data in the best-fitting models varied by pathogen and age band. However, not all associations were improved by including a lag. For instance, rhinovirus was associated with most of the age-specific models but without any lag. The associations with influenza were also only improved by adding a lag in the youngest and oldest age bands. In contrast, the associations with RSV were improved by adding a lag of at least 1 week in almost every model. Specifically, the associations with RSV laboratory reports suggested GP in-hours upper respiratory tract consultation data increasing due to RSV 1 week before lower respiratory tract infections or GP out-of-hours acute respiratory tract infection consultation data. An additional potentially important lag was that GP in-hours models for consultation data in the pre-school age band had the strongest associations when GP consultation data increased 3 weeks before laboratory reports for influenza.
The burden of seasonal pathogens
Age-specific burden
Estimates for total burden of respiratory pathogens on GP consultation data were based on the sum of the age-specific burdens, using age distributions from GPIHSSS and GPOOHSSS. Firstly, a typical general practice comprising 10 000 registered patients would have had 560 patients aged <5 years, 1130 aged between 5 and 14 years, and 1710 who are 65 years or over. For every 1000 patients accessing unscheduled GP care and receiving a Read-coded diagnosis, on average 159 are under 5, 83 aged 5–14, 524 aged 15–64 and 234 aged 65 or over.
When stratified by age band, influenza and RSV resulted in the highest number of GP in-hours respiratory tract infection consultation data overall. However, for patients aged 15 years and over, the single biggest burden was the association with invasive S. pneumoniae (Fig. 2).
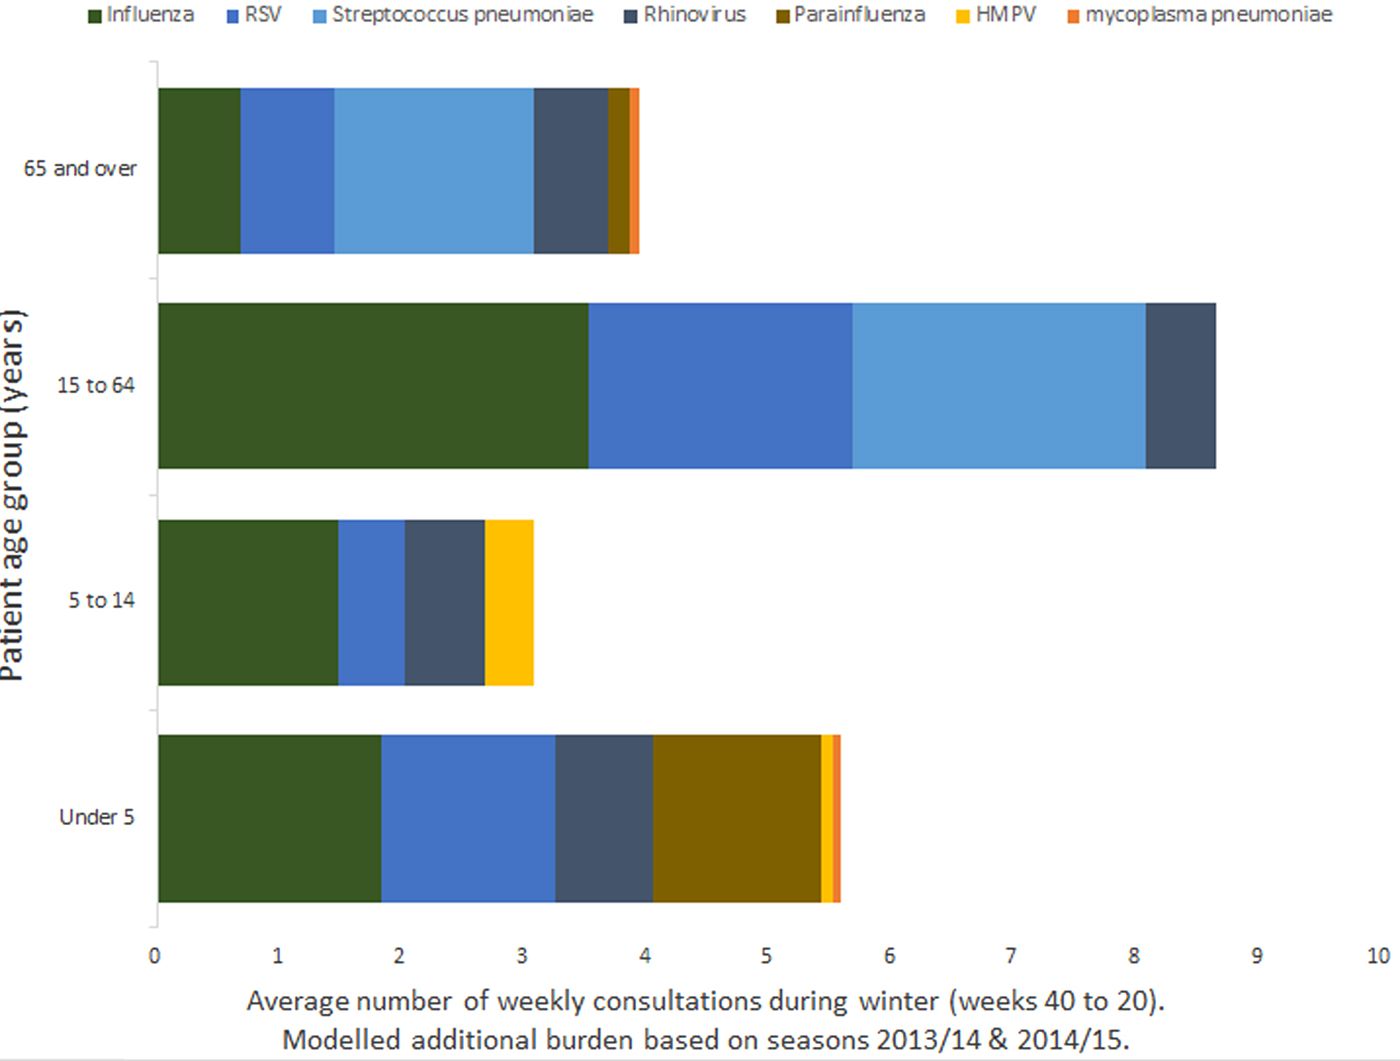
Fig. 2. Mean burden of seasonal pathogens on a GP practice of 10 000 registered patients by age band.
For GP out-of-hours consultation data, the greatest all age modelled burden was associated with invasive S. pneumoniae. Although for children aged under 15 years, the burden is higher for other pathogens, with the largest burden for children under 5 being associated with rhinovirus.
The peak incidence of RSV and influenza
GP consultation data associated with RSV and influenza were not spread evenly throughout the winter, but the vast majority occurred within a few weeks of peak activity. Moreover, as might be expected, the timing of peak activity and overall modelled burden varied from year to year. In particular, RSV incidence was more consistent than influenza, both in the timing of its peak and the overall burden (Fig. 3). Furthermore, between October and December (ISO weeks 40–52), GPs saw more total respiratory tract infection patients associated with RSV than influenza, and during the 2013–2014 season, the overall modelled burden associated with RSV was greater than influenza (Fig. 3).
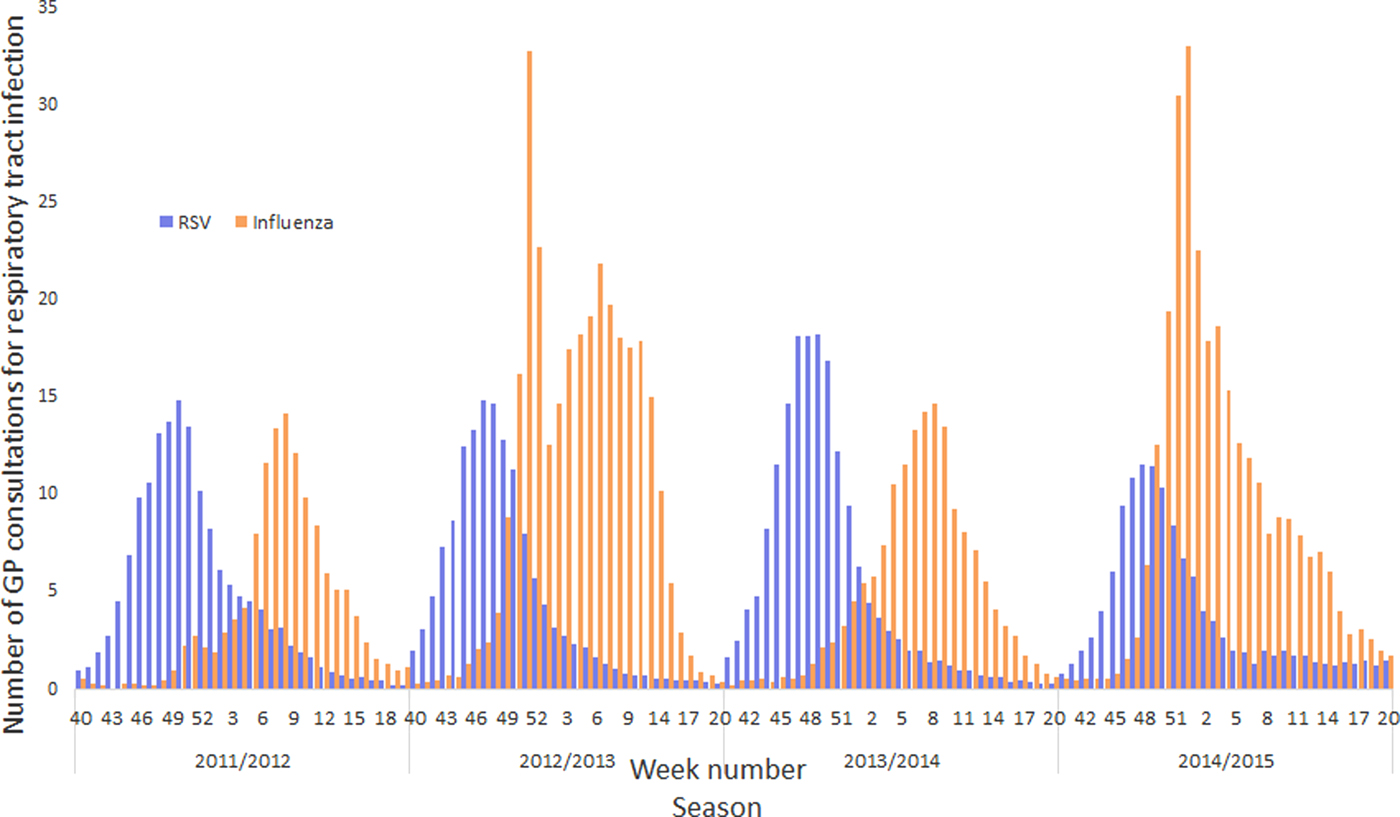
Fig. 3. Influenza and RSV burden to a GP practice with 10 000 registered patients across four winter seasons.
Discussion
Main findings of this study
We modelled the relative burden of a number of common winter respiratory pathogens on GP in-hours and out-of-hours services. Thus, we were able to explain the vast majority of the seasonal variation in GP consultation data for respiratory tract infections in terms of respiratory pathogen activity. Influenza and RSV had the greatest seasonal variation of the pathogens studied and were associated with the biggest modelled burden on in-hours GP consultation data for respiratory tract infections. Streptococcus pneumoniae and rhinovirus also were associated with a significant burden, especially when we considered age-specific models. Streptococcus pneumoniae was associated with the largest burden for adults; however, we did not find a positive association with younger children. The only pathogen studied not to involve a significant contribution for any age band was coronavirus.
When we added lag periods to the models, we found that different pathogens and different age bands had their strongest associations at different time lags. For example, laboratory samples for rhinovirus had the strongest associations with GP consultation data at zero no lag (across all age groups). By contrast, at +1 week lag, RSV had stronger associations, with increases in syndromic consultation data preceding RSV laboratory sample increases by at least 1 week. Furthermore, the best-fitting models for children under 5 years and adults over 65 years included syndromic data preceding laboratory samples for influenza by between 1 and 3 weeks. For other age bands, the best models had zero week lag for influenza. The lags in the best-fitting models suggested that syndromic surveillance consultation data may be able to provide early warning compared with laboratory surveillance of RSV or influenza. The early warning potential of syndromic data for influenza may be further enhanced when based on specific age groups.
What is already known of this topic
In other published work, influenza and RSV have also been found to be the respiratory pathogens with the greatest seasonal variation in other countries, including Belgium [Reference Bollaerts6], the US, Canada and Germany [Reference Fowlkes8, Reference Moineddin19, Reference Campe20]. Our results were comparable with previous studies which investigated the burden of respiratory pathogens: influenza was responsible for the biggest seasonal burden in studies investigating a range of pathogens [Reference Cooper5, Reference Fowlkes8, Reference Fleming17, Reference Campe20]. Other studies also found a significant burden due to RSV and other pathogens, including rhinovirus [Reference Cooper5, Reference Fowlkes8, Reference Campe20]. Furthermore, Taylor et al. found that the burden on children was greater for RSV than influenza [Reference Taylor21], whereas Cooper et al. [Reference Cooper5] found that the second greatest burden on calls to a national urgent care telehealth phone line was due to S. pneumoniae.
We found that the majority of additional influenza cases presenting to GPs during the winter period would be aged over 15 years old, whilst earlier studies showed that the greatest burden was amongst children [Reference Fleming16, Reference Ruf and Knuf22, Reference Hayward23]. However, different types and subtypes of influenza are dominant in different seasons: the age-specific burden varies depending on the circulating strains and therefore the age distribution of influenza impact will depend on the period studied [Reference Fleming16, Reference Hardelid, Pebody and Andrews24, Reference Matias25]. By contrast, RSV burden is less variable year on year and is known to be associated with a significant burden of childhood respiratory tract infection, including bronchitis [Reference Hughes9]: we also identified an associated significant burden for all ages, as previously found by Fleming et al. [Reference Fleming17]. However, we found the associated burden of HMPV-associated consultation data to be age-specific with a positive association with children visiting GPs with respiratory tract infections, as identified in a previous US study [Reference Edwards26].
Limitations of this study
This study used positive laboratory tests as a proxy for community incidence of respiratory pathogens. There are known biases in the laboratory sampling, e.g. in the age distribution [Reference Bollaerts6]. Decisions about which patients are selected for laboratory testing are based on clinical priorities which will impact on representation of the population in the data available for modelling. For example, an adult with uncomplicated self-limiting disease is less likely to have a sample taken for laboratory testing than an infant, or elderly patient, who has developed further complications, or has the potential to develop complications. Consequently, GP consultation data could be affected by some changes in pathogen incidence that are not reflected in the laboratory reports. The numbers of positive laboratory reports for invasive S. pneumoniae were very low compared with RSV or influenza (Fig. 1), but the modelled burden was of a similar magnitude (Fig. 2); the GP consultation data may reflect the burden of non-invasive S. pneumoniae, which is more prevalent than the invasive form. Similarly, GP consultation data for ‘respiratory tract infections’ captured by the syndromic surveillance system are not going to cover the entire burden on the GP services due to respiratory pathogens; some consultation data will be coded instead to other morbidities, e.g. fever, or difficulty breathing. Furthermore, estimates for respiratory burden could be affected by which years are included in the study, the overall burden of influenza in particular varies greatly from one year to the next with pandemics such as the influenza A(H1N1)pdm09 (not included in this study) greatly increasing the burden. Finally, respiratory infections present with a range of severity; the cases captured by syndromic surveillance systems (and laboratory reporting) represent only those symptomatic patients who have presented to a health care service encompassed by a syndromic surveillance system (or presented to a health care professional who has taken a clinical sample for laboratory testing). Therefore, the results presented are underestimates of the burden, and the degree of underestimation will also vary by pathogen, e.g. most rhinovirus cases will not present to a clinician.
What this study adds
This study identifies that influenza and RSV are the main seasonal pathogens associated with seasonal increases in GP consultation data across patients of all ages. Furthermore, invasive S. pneumoniae cases increase the number of consultations in adult age groups. These results further improve understanding of the contributions that different respiratory pathogens make to GP consultation data used for public health surveillance. Whilst our results originate from GP consultation data in England, the results are applicable to other countries with similar health service provision. Improved understanding of the relative burdens and age-specific contributions will help GPs, healthcare professionals and other users of syndromic surveillance data to interpret increases in respiratory tract infections more accurately. Estimates of respiratory burden, including the relatively high burden of S. pneumoniae and RSV on adults, will add to the evidence available for deciding future priorities for public health interventions which have focussed in the past primarily on influenza.
Future work
This work has focussed on the burden of seasonal pathogens, but the results could also be used to validate the early warning potential of the GP syndromic surveillance systems compared with laboratory surveillance. In particular, the use of lags in the regression models for individual pathogens may identify pathogens and age bands that have the highest potential for early warning. However, establishment of specific combinations of pathogens and indicator age bands for consistency across multiple years will require further validation studies spanning multiple seasons.
The GP syndromic surveillance systems use a range of more specific respiratory indicators, for instance ‘influenza-like illness’, pneumonia and bronchitis as well as other syndromes that might capture some of the effects of the respiratory pathogens studied, e.g. eye problems, fever or asthma. Applying the above methodology to more specific respiratory indicators will enable similar estimates to be made of the pathogen burden. Subsequently, it will be possible to estimate the proportion of patients with specific pathogens that are coded to the different syndromes. Thus, further research could result in developing new syndromic indicators or combinations of indicators to differentiate between the incidences of different pathogens circulating in the community.
Acknowledgements
The authors would like to thank and acknowledge the University of Nottingham, ClinRisk® and the contribution of EMIS and EMIS general practices. Data source: version one of the QSurveillance® database. The authors thank TPP, ResearchOne and the SystmOne general practices contributing to the GPIHSSS. The authors are grateful to Advanced Health and Care and the GP out-of-hours and unscheduled care service providers who have kindly agreed to participate in this system. AJE and GES are supported by the National Institute of Health Research's (NIHR) Health Protection Research Unit in Emergency Preparedness and Response. The views expressed are those of the author(s) and not necessarily those of the NHS, the NIHR, the Department of Health or Public Health England.
Declaration of interest
SdeL has received grants through his University from Eli Lilly, Astra Zeneca and Takeda for unrelated projects.


