Article Text

Abstract
Objectives To help people make decisions about the most effective mitigation measures against SARS-CoV-2 transmission in different scenarios, the likelihoods of transmission by different routes need to be quantified to some degree (however uncertain). These likelihoods need to be communicated in an appropriate way to illustrate the relative importance of different routes in different scenarios, the likely effectiveness of different mitigation measures along those routes, and the level of uncertainty in those estimates. In this study, a pragmatic expert elicitation was undertaken to supply the underlying quantitative values to produce such a communication tool.
Participants Twenty-seven individual experts from five countries and many scientific disciplines provided estimates.
Outcome measures Estimates of transmission parameters, assessments of the quality of the evidence, references to relevant literature, rationales for their estimates and sources of uncertainty.
Results and conclusion The participants’ responses showed that there is still considerable disagreement among experts about the relative importance of different transmission pathways and the effectiveness of different mitigation measures due to a lack of empirical evidence. Despite these disagreements, when pooled, the majority views on each parameter formed an internally consistent set of estimates (for example, that transmission was more likely indoors than outdoors, and at closer range), which formed the basis of a visualisation to help individuals and organisations understand the factors that influence transmission and the potential benefits of different mitigation measures.
- COVID-19
- public health
- infection control
Data availability statement
Data are available in a public, open access repository. All protocols, questionnaires and data are freely available at https://osf.io/8269v/.
This is an open access article distributed in accordance with the Creative Commons Attribution Non Commercial (CC BY-NC 4.0) license, which permits others to distribute, remix, adapt, build upon this work non-commercially, and license their derivative works on different terms, provided the original work is properly cited, appropriate credit is given, any changes made indicated, and the use is non-commercial. See: http://creativecommons.org/licenses/by-nc/4.0/.
Statistics from Altmetric.com
Strengths and limitations of this study
This study provided sufficient quantitative data to underpin an interactive visualisation of the main transmission routes of SARS-CoV-2, showing current expert views on their relative importance in different scenarios, and the effectiveness of different possible mitigation measures.
The results highlight differences in opinion among experts around several aspects of virus transmission and mitigation, and important evidence gaps.
The study is limited in its participant pool, with some variable estimates only supplied by four experts, although participants were sourced from a range of disciplines and countries.
The study was carried out entirely online, and although participants could contact the authors for further assistance, many found it difficult to quantify their subjective assessments of risk and provide numerical ranges.
Introduction
Over 185 million cases of COVID-19 have been recorded worldwide and 4 million people have died since the virus was first identified in December 2019. Highly effective vaccines hold great promise, but no vaccine provides 100% protection from infection or illness, and so measures to reduce transmission of the SARS-CoV-2 virus are likely to be required for the foreseeable future.
Reducing the spread of SARS-CoV-2 requires the adoption of effective behavioural and physical mitigation measures, such as wearing face coverings, hand washing, physical distancing, and increasing ventilation in enclosed spaces. Therefore, individuals, organisations and policy-makers need to appreciate the major routes by which the virus is transmitted in order to identify appropriate actions for any particular context, and suitable policies to support such measures. Attempts have been made to help decision-makers, including the public, understand some of these routes through visualisations (eg, the visualisation by Salas and Almodóvar1), but the non-availability of data has, until now, made it almost impossible to illustrate comparative risks of transmission through different routes.
Evidence to date suggests that transmission may occur through inhalation of aerosols when close to a person with infection or when further away (greater than 2 m), direct exposure to larger respiratory droplets when close to an infectious person, or contact with contaminated surfaces.2 Risk factors for transmission include spending time in highly occupied indoor spaces, particularly over long periods of time; activities that may generate a greater number of respiratory aerosols and droplets3; and poor ventilation.4 Infectious SARS-CoV-2 is very hard to detect, especially when airborne and in real-life environments, and outbreak investigations inevitably happen after transmission has happened and evidence for the virus is no longer present. The empirical evidence base for the relative importance of transmission routes and the effects of different environments, activities and mitigation measures on the likelihood of transmitting SARS-CoV-2 is therefore limited, meaning that systematic reviews of high quality empirical evidence are currently challenging. A number of systematic reviews have been conducted with a focus on transmission, but most of these reviews focus on the secondary attack rate and risk factors associated with particular settings rather than the mechanisms for transmission. A small number focus on elements relating to transmission mechanisms, including presence of the virus in the environment,5–7 individual modes of transmission,8 9 and influence of some environmental mitigation measures such as distancing and masks.10 11 However, data are currently insufficient to combine information on transmission routes together in a conclusive systematic review, and to our knowledge only one study has identified sufficient data to draw quantitative conclusions around transmission and mitigation through a meta-analysis approach.10 It will probably be some time before the evidence base is large enough to provide precise answers to many important questions about virus transmission under the variety of conditions encountered in the real world. Decision-makers are therefore in a difficult position as they need to make decisions about mitigation measures before such an evidence base can be established. However, there is a body of knowledge, including narrowly focused systematic reviews, that encompasses clinical trials, theoretical understanding and observational data. Therefore, it may be possible to synthesise sufficient knowledge from a diverse range of experts to be able to make order of magnitude judgements on the factors that influence transmission. While more detailed evidence would be desirable, this level of understanding may well be adequate to support decisions on mitigation measures that do not require precise quantification of every variable in the system, and indeed these decisions need to be taken even in the absence of such information.
We describe a two-stage, pragmatic expert elicitation designed to provide information that could form the basis for communicating information on SARS-CoV-2 transmission through visualisations, including suitable representations of uncertainty. To our knowledge, this is the first attempt to assimilate the necessary information to create such a visualisation. The project has three aspects: constructing a framework to represent possible viral transmission pathways and mitigation strategies; eliciting quantitative estimates of viral dispersion and exposure from experts; and creating a visualisation of the transmission pathways which communicates the state of knowledge in an intuitive enough way to allow it to be useful to members of the public and policy-makers. We describe the first two elements of the process; the visualisation is described in an accompanying manuscript and interactive graphic.12 The study was led by members of a subgroup of the UK Scientific Advisory Group for Emergencies Environment and Modelling Group (SAGE-EMG).13
Methods
Patient and public involvement
Patients and the public were not involved in the design or conduct of this expert elicitation. The visualisation that the elicitation underlies is intended for public use and dissemination, and was user-tested with members of the public during its design by the Winton Centre for Risk & Evidence Communication.
Stage 1: constructing a conceptual transmission framework
Our first step was to construct a conceptual framework (figure 1) intended to represent current evidence on the potential major pathways of transmission of SARS-CoV-2 and where mitigation measures might disrupt the transmission routes in a clear and comprehensible way whilst also containing sufficient detail to explore the possible effects of different environments and activities. The potential infection routes via urine, faeces and sexual transmission were considered but since none has been confirmed in humans, they were not considered worth including at this point.

Main known transmission pathways for SARS-CoV-2 from a person with infection to a susceptible person, and potential mitigation measures (in green) that might affect each pathway.
This framework was specifically constructed to represent transfer from one infectious person to another susceptible individual, and therefore did not include factors that would affect infection risk at a population level, such as prevalence of the virus or the number of people within a given scenario. The framework was proposed with the intention that the amount of virus transferred along each route could be used as the basis for visualising the relative importance of each route and the effect of different scenarios and different mitigation measures. See online supplemental information 1 for more details on the quantitative basis for the planned visualisation.
Supplemental material
This framework provided a basis for the elicitation, guiding the information that would need to be elicited to create a semi-quantitative visualisation of the relative importance of different possible transmission pathways, and the effects of different mitigation measures. We sought quantitative information on:
The relative rates of virus production by a person with infection during different activities (eg, exercising, singing, coughing, speaking).
The split at each node to estimate the relative amount of infectious virus likely to be transferred along each pathway (eg, the ‘percentage of infectious virus’ likely to be transferred to the environment in aerosol vs small droplet fractions of exhaled air).
How or whether the splits would be affected by different environments or activities, including mitigation measures (eg, whether the wearing of a face covering by an infectious person would affect the percentage of infectious virus likely to be transferred to the environment in aerosol vs small droplet fractions of exhaled air).
The loss to the environment of the infectious virus along each pathway, under different environmental conditions or activities, including mitigation measures (eg, the percentage transfer of infectious virus produced in large respiratory droplets to a susceptible person’s mucous membranes—depending on how close the two people are standing, for how long and whether there are any barriers between them such as screens).
The true number of possible factors affecting each of these variables is unknown, and would be impracticably large, so subjective decisions were made to reduce the number of factors to a manageable level while also producing a useful set of options for those needing to make risk management decisions.
Our approach resulted in an initial list of 123 numerical variables to be elicited (see online supplemental information 2), but there were also outstanding questions over whether there were additional variables not anticipated at this stage, and also some questions (eg, time spent in a shared environment) where we asked participants how best to treat the variable. Therefore, the first round of the expert elicitation protocol was designed to help identify which activities and environments should be considered, as well as eliciting estimates for the initial list of variables.
Supplemental material
Stage 2: eliciting estimates
Expert elicitations are often used as a way of providing ‘best estimates’ when the factors that need to be taken into consideration—and the uncertainties associated with them—are so complex as to go beyond what can be simulated, modelled or empirically tested.14–16 Such elicitations have been used in fields from health to economics to climate change policy, where empirical data are lacking and uncertainty is high.17–22
The need for approximate, relative values for key parameters for disease transmission pathways is an excellent example of where expert elicitation is helpful. The uncertainty involved in the estimates is mostly because of a lack of knowledge rather than the play of chance; in other words, epistemic rather than aleatory uncertainty (although of course the estimates themselves are probabilistic, incorporating the aleatory component). There is also considerable variability in transmission or mitigation dependent on an almost infinite variety of factors (such as the behaviour of the individuals concerned, the precise environmental conditions of the encounter etc). Capturing the degree of expected variability per scenario in the real world is very important if the information is to be truly informative to decision-makers, who need to know ‘best case’ and ‘worst case’ likely estimates as much as the average. Some empirical evidence for factors that affect transmission is available from a range of different sources (modelling, laboratory experiments, epidemiological and observational data),23 but with significant gaps, especially when it comes to real-world environments. All of the above considerations make it impossible to determine estimates based purely on published literature, but there is a reasonable expert understanding of the key processes involved in each part of the transmission pathways, although again with some gaps.24–27 By bringing together a range of experts, and encouraging them to consider the real-world variability as well as epistemic and aleatory uncertainty that will create a range around any estimated values, it is possible to obtain more realistic ranges for such estimates than could be gained through any single modelling exercise or experiment (should that even be possible).
The key elements of successful expert elicitation include28–30:
A considered selection of experts to give a well rounded set of opinions.
Making sure that the questions are phrased in such a way as to be not easily misinterpreted or too vague.
Ensuring that the questions help participants produce a subjective quantitative estimate by eliciting values that they are likely to have already considered in a quantitative way if possible.
Helping participants consider all the evidence available to them and alternative viewpoints.
Counteracting the cognitive heuristics and biases that are known to operate, particularly when it comes to framing, and confidence in answers and ranges.
Encouraging the experts to consider and capture the full range of uncertainties in the estimates (both direct, through quantitative ranges, and indirect—issues with confidence in the underlying evidence or expert disagreement), and also expected ranges of the estimates due to variability in the scenarios in the real world.
Our elicitation process was designed to arrive at ranges rather than a single consensus estimate, and to allow for differing opinions. We were also particularly conscious of the possibilities for groupthink, or dominance by certain personalities or specialties. We therefore chose to avoid protocols that relied on behavioural aggregation methods, where discussion takes part between experts and they are encouraged to converge on a consensus answer. The process was also necessarily online only. However, to help participants consider the full range of evidence and opinions from others, two rounds were used, with participants in the second round shown the estimates of participants in the first round and a summary of considerations, references and rationales that were given by participants in the first round (in anonymised form). Unlike the IDEA elicitation framework,29 however, which also employs a similar information-sharing stage, there was no opportunity for discussion or conferral between the rounds to avoid any psychological effects during discussion. Unlike the Cooke protocol,31 there were no seed questions and weighting of expert responses during mathematical aggregation. This was partly to reduce the question burden on participants (given the large number of variables being elicited) and because of the difficulty of providing suitable seed questions with known answers in a relevant field, especially given the broad range of participants’ experiences. Perhaps more importantly, we also wanted to avoid allowing some ‘experts’ to dominate the outputs in such a public study, in contrast to an ‘internal’ analysis where pure accuracy might be more important. The two rounds were also designed to balance out some known biases, as described below.
The first round solicited initial estimated ranges rather than point estimates for each variable. No background information was provided to respondents to avoid biasing results by suggesting numbers on which the participants could anchor, or evidence that might narrow their thought processes to a particular source of data or scenarios.30 32 However, overconfidence when estimating is a universal phenomenon and these ranges are likely to be narrower than justified by the evidence.32
The second round, with a larger sample size and broader range of invited experts, collated the estimates as well as the references and rationales provided by the first round in order to elicit participants’ estimations of the likelihood of the true range of values falling below, within or above the average range provided by participants in the first round. This strategy aimed to encourage participants to consider opinions and evidence that they may not have thought of or been aware of at first, and to counteract framing effects.
The study gained ethical approval from the University of Cambridge Psychology Research Ethics Committee (PRE.20210006), and the method was pre-registered (https://osf.io/rd69j). Full questionnaires and data are available online (https://osf.io/8269v/).
Round 1: methods
An initial set of experts was collated from recommendations from members of SAGE-EMG. The aim was to obtain broad coverage of expertise and a range of likely opinions. At the end of the elicitation survey, each participant was asked to nominate others whom they felt should be invited to participate. Additional experts were reviewed by the authors and invited to participate if they had not already been. Participants were asked to give their broad area of expertise and their country of residence so that further recruitment could address issues of diversity of experience and opinion. The number of participants asked was intentionally limited as this round was to gain initial estimates and references, and a sense of the extent of agreement or disagreement among experts, while leaving a large enough pool of experts for the second round.
The process was designed to be carried out entirely online using Qualtrics (Qualtrics, Provo, UT, USA). Prompts to assist experts in thinking through their estimates were included in the survey design.
Participants were first able to select which of the transmission pathways they considered relevant to their expertise in order to minimise and focus the questions they were asked (figure 2). On the basis of their selection they were then shown the relevant section or sections of the transmission diagram and asked the following:

Division of the transmission diagram into different pathways to allow participants to select those that reflected their expertise.
To give a quantitative estimate in the form of their 95% subjective probability interval for the particular value in question (including both variability due to the range of possible scenarios as well as uncertainty).
To select whether their estimate was based on empirical or modelling evidence or is purely expert opinion.
If they stated that it was based on evidence, to state references for that evidence. If they stated that it was based on evidence, to give a rating of the quality of that underlying evidence (on a scale from 1 to 5 with the extremes marked ‘Low confidence that the findings would hold true in reality’ and ‘High confidence that the findings would hold true in reality’).
To briefly explain their rationale for their estimates.
To outline the key assumptions or considerations that would significantly affect their answer, and whether there is evidence or reliable modelling that would inform how their answer would change in relation to those variables.
It was hoped that prompting them to list and rate the evidence, to give their rationale, and to consider their key assumptions would help participants broaden their estimated ranges by considering the variability and uncertainties more deeply. At all times participants were able to see their estimates to previous questions and alter them.
They were also given the opportunity to add other mitigations or activities that they thought should be considered as part of the elicitation process.
Round 1 was completed between 7 and 28 February 2021.
Round 1: results
Out of fourteen participants invited to take part in round 1, 11 completed at least one pathway section of the survey. Participants were from the UK, the USA and Australia, and described their expertise as coming from medicine (1), engineering (4), biology (2), chemistry (1), epidemiology (1), physics (1) and occupational and environmental health (1). Participants who declined to take part in round 1 were from the UK and Hong Kong.
Forest plots were created for each participant’s estimated range for each of the 123 variables elicited (see online supplemental information 3). We examined the distribution of participants’ estimates for each variable and their rationales. This was a subjective judgement based on the distributions (eg, whether there were ranges that showed no overlap) and the rationales given.
Supplemental material
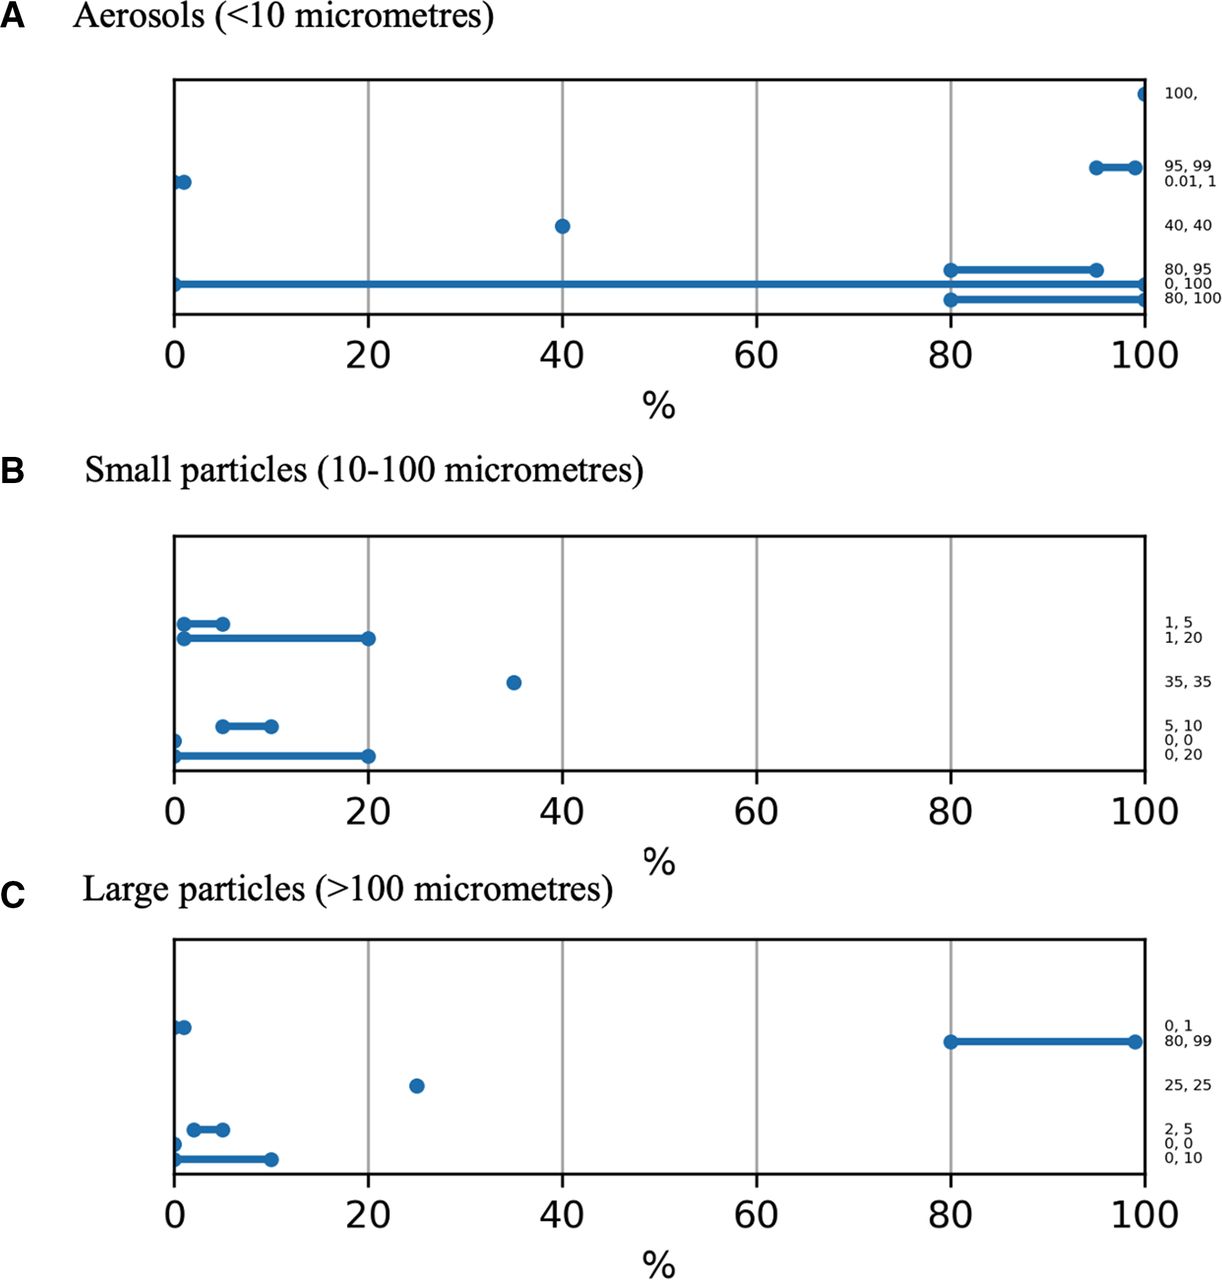
Some estimates appeared to form a unimodal distribution, however in some cases it was clear that there were differences in participants’ understanding about the underlying processes, giving rise to very different ‘camps’ in the estimates. Most of this disagreement related to the proportion of infectious virus spread via aerosols versus larger particles in exhaled air (figure 3). This difference in participants’ underlying conceptual models for virus transmission carried through for most of the variables associated with the airborne pathways, including the effects of potential mitigation measures such as face masks or ventilation. There were also disparities in how highly participants rated the quality of the empirical evidence underlying their estimates on the proportional split of the virus between different particle sizes. On a five-point scale, two participants rated the evidence strength at ‘2’ and two at ‘5’, and one participant stated that there was no empirical evidence underlying their estimates (the remaining two participants rated the evidence quality as ‘3’ and ‘4’).

Example of elicited responses to a variable where participants fell into three 'camps': estimates of the proportion of infectious virus emitted via (A) aerosols (<10 μm), (B) small particles (10–100 μm), and (C) large particles (>100 μm) in the exhaled breath from a person infected with SARS-CoV-2 who was not talking. Checking the free text rationales indicated that some thought that transmission occurred almost entirely through larger particles, some almost exclusively by aerosols, and some that it is more evenly spread across all three sizes of particle. Many mentioned the uncertainties caused by problems in measuring the virus. Numbers on right hand axis show individual responses.
Two other variables split into different ‘camps’: the effect of gloves on transmission via touch, and the effect of a scenario involving handling shared objects such as plates at a shared meal.
Participants otherwise tended to give similar rationales for their estimates, and gave citations for references they had used when producing their estimates; these were often quite different from one participant to another. Some participants gave ranges of ‘0% to 100%’ and stated in their rationales that this was because sometimes people would ‘be lucky’ and sometimes ‘unlucky’ and transmission would either occur or not occur (demonstrating discomfort with probabilistic thinking). Some also indicated that they were not clear how much variation within each possible scenario (eg, behavioural variation in a situation) should be taken into account in their uncertainty ranges. Some explained they were citing 95% confidence intervals from empirical studies (rather than taking deeper uncertainties into consideration in their ranges).
Participants additionally suggested a few more variables to elicit, where they raised potential mitigations (such as hand hygiene) that had not been part of the survey in round 1.
Round 2: methods
Taking the results from participants in round 1, a new survey form using Qualtrics software was created. Participants in round 2 were shown the ‘average range’ for each variable elicited in round 1, and asked how likely they thought it that the actual percentage would fall below, within or above that range. To support them in making a judgement they were also shown a forest plot of the individual responses, a summary of the rationales and assumptions of participants in round 1, and a hyperlinked collation of all the references that round 1 participants had given.
Preparing the ranges to be shown to participants
For variables where the estimates from participants in round 1 formed a unimodal distribution they were combined. The lower and upper bounds of the estimate elicited from each participant were assumed to form 95% intervals of an underlying normal distribution. We could in principle have fitted some three-parameter family of distributions that allowed skewness, but this additional complexity did not seem justified at this first stage when we were deliberately focusing on the ranges rather than the point estimates. Individual normal distributions were fitted to these bounds, and the fitted densities then averaged to form an unweighted linear opinion pool.33 From this combined distribution, an interval was taken to present to participants in round 2. The choice of the intervals to be presented is essentially arbitrary, as it is merely a means to help elicit each participant’s subjective probability distribution, but such intervals become less informative if they are too wide or too narrow (ie, too likely that at least one of the estimated likelihoods—of falling within, above or below the range—would be zero). Although we had pre-registered to take a 95% confidence interval, we chose to change this to a 70% interval given the breadth of many of the combined distributions, which would have made a 95% interval too broad to give informative responses from participants in round 2. For example, see figure 4.

Example of an 'average distribution' from three participants in round 1 (blue) and the 70% confidence interval extracted from that to be displayed to participants in round 2 (green). In this example, the variable elicited is the percentage loss of infectious virus during transmission from a susceptible person’s hand to their mucous membranes (given no mitigations in place).
Where participants’ estimates did not form a unimodal distribution, the estimates from round 1 were grouped into different ‘camps’ to reflect the bimodal or multimodal distribution. Each of these camps was then treated as above—the estimated ranges combined and a 70% confidence interval extracted from each.
Design of the questionnaire
Taking into account some of the difficulties in responding expressed by participants in round 1, we added an introductory section with more detailed guidance on how to interpret the questions asked. To help participants take into account variability in the scenarios and uncertainty around them, and to turn this into a probabilistic range, we suggested that participants sometimes thought in terms of expected frequencies rather than probabilities. This section was also explicit about the need to take into account variability in the scenario as well as uncertainty around an estimate under one set of conditions. (Text used: ‘Sometimes it’s harder to think about scenarios in terms of probabilities. For example, if you’re talking about the likelihood of infection from a ballistic droplet from an infected person hitting another person directly in the eye or mouth it can be tempting to think that the probability can range from 0% to 100% according to chance. However, if you think about 100 such encounters between an infected person and a susceptible person what we’re asking is how many times out of those 100 you would expect the susceptible person to be ‘unlucky’ and get hit by such a droplet, given all the variations in the scenario described that might happen, and we’re asking you to give us that number as a range, to encompass the degree of uncertainty around it (due both to lack of knowledge and about the potential variability in the scenario)’).
As in round 1, participants were first able to select which of the transmission pathways they considered their expertise to be in, and were then shown the relevant section or sections of the transmission diagram. For each variable that was elicited in round 1, participants in round 2 were shown the forest plot of these estimates, an outline of the rationales and assumptions listed by participants in round 1, and a list of the references that they had given (with links to papers provided).
Where participants in round 1 had fallen into more than one camp in their estimates, participants in round 2 were asked initially which camp they fell into. They were then shown the relevant 70% average range from the participants in round 1 and asked the following:
To move sliders (with a forced sum of 100%) to show ‘Considering all the uncertainties and possible true values in the real world, in what percentage of scenarios like this would you expect the true value to fall below, within, or above this range?’
To give any additional references to support their estimates.
To provide a rating of the quality of the underlying evidence (on a scale from 1 to 5 with the extremes marked ‘Low confidence that the findings would hold true in reality’ and ‘High confidence that the findings would hold true in reality’).
To outline the key assumptions or considerations that would significantly affect their answer, and whether there is evidence or reliable modelling that would inform how their answer would change in relation to those variables.
For new variables, not previously elicited in round 1, the question format was the same as in round 1, eliciting percentage ranges de novo.
Participants invited to take part in round 1 were invited to take part in round 2 as well, along with others selected initially by members of SAGE-EMG and then by subsequent snowball sampling from suggestions by participants. Participants were chosen from as many different geographical regions as possible, within the time available, and to represent a range of different expertises. The aim was to maximise the diversity of relevant opinions, through their knowledge, experience and access to different sources of evidence. The same demographic information was collected from participants as in round 1.
Round 2 was completed by participants between 15 March and 4 May 2021.
Summary: round 2
For round 2, 68 participants were individually invited, including all participants from round 1, a range of scientific experts who have published in relevant areas, and representatives from SAGE, WHO, Centers for Disease Control and Prevention (CDC), and European Centre for Disease Control and Prevention (ECDC) committees. From this pool, 23 participants submitted at least some data. Geographically there were participants from the UK (19), the USA (2), Singapore (1) and Thailand (1). Several participants, including some from other countries, started the questionnaire but did not contribute estimates. Participants who declined to take part or who did not contribute estimates were from Australia, Hong Kong, the USA, Canada, Italy, Taiwan, Norway, Germany and Singapore. Expertise represented included engineering (7), medicine (5), chemistry (2), virology/infection control (2), epidemiology (2), aerobiology (1), microbiology (2), social and environmental change (1) and mathematical modelling (1). Seven of the participants in round 2 had taken part in round 1, while 16 were new participants.
Participants’ estimates for the variables that were elicited for the first time in round 2 were treated in the same way as those elicited in round 1, resulting in average distributions.
Where participants’ answers were bounded by having to fall within 0%–100%, their estimates of the likelihood of a variable’s ‘true value’ lying below, within, and above the indicated range were treated as if they summarised a constant distribution within each of those three areas of the 0%–100% scale. Where they were just bounded below by 0 (pathway 1; see figure 2), their underlying beliefs were assumed to form a log-normal distribution; this was obtained by fitting a normal distribution on a logarithmic scale.
In some cases, where there had previously been two or more ‘camps’ of participants in round 1, with their responses falling into bimodal or trimodal distributions, the number of alternative viewpoints decreased. Where participants chose different ‘camps’ on the basis of an initial question but their answers showed that their views were not incompatible with each other (eg, where participants who thought that a value was likely below 50% but their percentages indicated it was near 50%, they were combined with those who had stated that they believed a value was above 50% but whose probability distributions indicated that there was also some likelihood of it being below 50%). In many cases large amounts of disagreement remained between participants, and sometimes emerged where more agreement had been apparent in round 1.
A mean was taken of participants’ estimates of the quality of the underlying evidence for each variable as given in round 2.
Results
Pathway 1: factors that affect the amount of virus exhaled by an infected person
Participants were asked to give their estimate of the percentage relative difference in infectious virus produced by someone with normal respiratory rate during a range of activities in comparison to silent breathing (this was considered to be 100%). This included speaking at average volume (ie, not projecting their voice); speaking loudly such as in a classroom, theatre or lecture; coughing; singing, exercising, eating; infected with a new variant of concern (at this point, the main variant of concern being considered was the alpha variant). Seven participants contributed estimates in round 2; participants’ individual and collated responses are summarised in figure 5 and in table 1, with additional data in online supplemental materials 3. The ranges shown in each case encompass participants’ estimates of the uncertainties and the range of variability due to environmental and individual factors.

Participants’ estimates of the percentage increase that each of a range of different activities would cause in exhalation of infectious virus by an infected person: (A) speaking, (B) speaking loudly, (C) coughing, (D) singing, (E) exercising, (F) eating and (G) infected with a variant of concern. In each case, the top graph shows individual estimates, the middle graph the average of those estimates, and the bottom graph a cumulative probability distribution, with (in green) the median and interquartile range. Values in parentheses to the right show each participant’s estimate of the percentage likelihood of the true value lying below, within and above the range identified in round 1, shown by the orange lines. Values in parentheses in the bottom graph show 25th, 50th and 75th percentile estimates from the combined responses. The vertical dashed line shows the 100% reference case (that is, no different from silent breathing).
Summary of participants’ estimates of the effects of different activities on the amount of infectious SARS-CoV-2 virus produced by individuals (n=7 for each estimate)
Most participants made the assumption that the pattern of infectious virus emission follows that of particle emissions because we cannot directly measure the amount of infectious virus. However, some specifically mentioned that studies with measurements of ‘microbial’ (not viral or SARS-CoV-2) concentrations in respiratory output may not necessarily mirror the pattern of all particle emissions.
Other factors that participants suggested might affect the amount or distribution of infectious virus produced included the individual’s age (with children potentially being lower emitters34), sex (men potentially emitting higher levels of virus), stage of infection (eg, whether they were symptomatic or not), smoking status (with smokers emitting higher levels) or use of snuff and possible other nicotine delivery systems, immune status (with those on immunosuppressive drugs or with reduced immune systems producing higher levels, as well as potentially those with respiratory allergies), and potentially co-infection with other micro-organisms or certain treatments, such as antivirals.
Participants noted that individual differences in speech such as style and language (eg, the amount of ‘plosive’ consonants), loudness and moistness of mouth were all likely to affect projection of infectious virus. Similarly wetter and more ‘productive’ coughs, with copious nasopharyngeal secretions, were thought more likely to have higher infectious components. With the estimates on emission during singing and exercise, participants often mentioned that they were particularly influenced by the studies of real-world ‘superspreader’ events which they felt were more reliable indicators of infectiousness than laboratory studies.
Participants highlighted little evidence for the amount of virus produced while eating, but mentioned reasons for believing that there might be either a potential decrease in time spent with mouth open, or that respiratory fluids were soaked into food and swallowed; or an increase in time spent with mouth open, increased salivation, mechanical movements of the jaw and tongue or people clearing their throats.
When asked about the effects of infection by any of the current variants of concern, participants commented that there was not good evidence of higher viral load or viral shedding in these variants and that their increased infectivity could be due to a greater ability of the virus to evade an antibody response as much as through increased production of viral particles. It should be noted that during round 1, this was mainly the alpha variant B117. During round 2, there were several known variants of concern with apparent higher transmissibility, but the survey was completed before the delta variant became widespread.
Pathway 2: factors that affect the amount of virus emitted to the environment in respiratory output
Size distribution of viral emissions: Respiratory output from individuals contains a spectrum of wet aerosol and droplet sizes, each of which might behave in a different way in terms of persistence in an environment and response to different mitigations. Participants were therefore first asked their opinions about how much of the virus exhaled by an infected person (taken as a baseline 100%) might be contained within each of three broad fractions: path A (aerosols <10 μm in diameter), path B (small droplets, 10–100 μm) and path C (large droplets, over 100 μm). Participants were asked this for an individual who was silent and respiring normally, but also for an individual performing each of the activities outlined in pathway 1 above. Six participants contributed data in this pathway, with data summarised in table 2 and online supplemental information 4. Again, the ranges given encompass participants’ estimates of both the uncertainty and variation due to environmental and individual factors inherent in each scenario described.
Supplemental material
Participants' estimates of the percentage of infectious SARS-CoV-2 produced by an infected person that would be found in each of three different size fractions of respiratory particles
As in round 1, participants were divided on the degree to which they felt the viral particles were predominantly carried in the fraction of the respiratory output falling under the definition of ‘aerosols’. For silent breathing, six out of seven participants suggested that virus may be predominantly in aerosols, for speaking at normal volume, five out of six participants thought that the virus would likely be spread fairly evenly across the different fraction sizes. For the other activities there was further disagreement among the experts, highlighting a substantial gap in knowledge.
Similar to pathway 1, participants discussed the challenges of detecting virus particles in the air, and that a lot of studies assume that virus is distributed evenly across different respiratory particle sizes by volume. There was also discussion on whether people with symptomatic infection would produce a different distribution of particle sizes due to stress, fever and respiratory symptoms.
Participants noted that there were many individual factors that would create variation in the percentage splits, such as the proportion of the time spent breathing through the nose versus the mouth. Environmental factors such as humidity and temperature could also affect the moisture content, but the effects of these factors on viral content is unknown. During coughing, some participants thought that particles from coughing were more likely to come from the deep lung and hence be smaller, while others thought they might be larger. It was noted that there was little empirical research in patients with SARS-CoV-2 specifically.
No participants thought that any of the variants of concern were likely to behave differently on this pathway.
Impact of source control mitigation: Participants were asked to estimate the difference that four different potential face covering mitigations would have on the amount of infectious virus that would reach the environment via each of the three size fractions (A: aerosols, B: small droplets, and C: large droplets). They were asked to assume a reasonable fit (eg, covering the nose) and no resuspension of material deposited on the mask or visor.
Table 3 shows there was a good degree of consensus, with participants judging higher quality face masks to provide the greatest protection against all particle sizes. Home-made face coverings and surgical masks show the greatest variation, which may reflect assumptions relating to both fit and material effectiveness.
Participants' estimates of the effects of different source control mitigations taken by an infected person on the emission of SARS-CoV-2 virus into the environment through three different fractions of their exhaled air
Pathway 3: factors that affect the amount of virus that can be inhaled or inspired from environment by a susceptible person
Seven participants contributed data on this pathway, considering loss to the environment, once exhaled, of infectious virus emitted via aerosols (0–10 micrometre diameter) or small droplets (10–100 μm) under different environmental conditions, or different mitigations that might be applied.
Dispersion of virus with location and ventilation: First, participants were asked to consider the effects of room size and ventilation on the percentage loss during transmission between a single infected person and a single susceptible person standing 2 m apart with no face coverings (note, this is loss once exhaled, while pathway 2 considered exhalation into the environment).
As seen in table 4, participants differed in their opinions of the percentage loss to the environment. Participants in round 2 had been offered low, medium or high loss of aerosols as a way of separating the ’camps’. Although participants coalesced more than in round 1, to just one or two ’camps’, their estimates still showed considerable disagreement over the likely percentage loss (see online supplemental information 5).
Supplemental material
Participants' estimates of the percentage of infectious virus lost to the environment when travelling via aerosols or small droplets in different environments (susceptible person and infected person 2m apart)
Participants in round 1 had already raised the possible effects of humidity and temperature, natural leakage rates of a building affecting air change rates, the physical location of the two people relative to each other and any furniture, and the potential influence of other people on the indoor setting. For the outdoor scenario, wind speed, turbulence and obstructions as well as temperature and humidity were raised as likely significant factors. Participants disagreed in their opinions on whether there would be any reduction at all of infectious virus in the air, regardless of whether the moisture component of the exhaled air evaporated (which itself was contended). Some thought that the viral elements, even in the small droplets, might settle onto surfaces over time. There was near universal agreement that the necessary experiments had not yet been done, exploring air flow patterns using suitable tracers within a number of realistic situations compared against data with actual viral particles.
Dispersion with distance: Participants were then asked to consider the effects of distance, by considering the percentage loss if the infected and susceptible person were either closer than 2 m or further apart than 2 m. Participants rated the quality of the evidence behind their estimates on the effects of distance as 3.0 for aerosols and 3.25 for small particles. A summary of their estimates is shown in table 5, and again participants’ responses showed considerable variability (see online supplemental information 5).
Participants' estimates on the percentage of infectious virus lost to the environment if two individuals were standing closer than, or further apart than, 2m in different environments
One participant pointed out that if participants are closer than 2 m apart then the size of an unventilated room is essentially irrelevant. In ventilated rooms, the design of the ventilation and resulting airflow patterns relative to the location of individuals may become important. Outdoors, the amount of ambient air flow in most scenarios means that beyond 2 m distance participants suggest transmission is very unlikely.
Measures to protect the susceptible person: Finally, participants were asked to estimate any additional percentage loss that might be caused by the susceptible person being behind a face covering or shield (assuming an appropriate fit and no accompanying behaviour change).
There was general agreement that exposure to larger particles would likely be reduced more than smaller ones. When it came to a plastic face visor, some thought that may even increase exposure to small droplets. See table 6.
Participants' estimates of the effects of different mitigations taken by a susceptible person on the potential prevention of infectious SARS-CoV2 inhaled via two different fractions of infected exhaled air
A few participants mentioned other potential mitigation measures, such as air cleaning (although there was no clear evidence of efficacy that they could cite), or personal ventilation systems.35–41
Pathway 4: factors affecting surface transmission of the virus
In this, the largest individual section of the survey, participants were asked their opinions on a range of questions involving the transfer of infectious SARS-CoV-2 virus from large droplets (>100 μm) to surfaces and a susceptible person’s hands. Six participants contributed data to this section.
Fate of large droplets: For four scenarios, participants were asked for their estimates of the proportions of virus they thought likely to be transmitted from large droplets to the hands of an infected person onto all surrounding surfaces, or directly onto the hands of a susceptible person, compared with those likely to remain in the air (ie, going on to pathway 5).
Generally there was agreement that the amount of virus going directly onto the hands of a susceptible person was likely to be very small, and that droplets of this size would mostly tend to fall quite rapidly onto surfaces (table 7). Round 1 data did not obviously show a bimodal distribution in the responses. However, round 2 responses do indicate variations of opinion (see online supplemental information 6). For example, estimates of whether the amount of virus transmitted to surrounding surfaces would be above the indicated range (upper boundary 58.1%), in a situation where participants were not in direct contact, ranged from 1% to 64%. Similar differences are seen in many of the other estimates. We note that these values might also change if symptoms such as a runny nose are features of infection.
Supplemental material
Participants' pooled estimates on the percentage of infectious SARS-CoV-2 likely transmitted through different routes from large droplets (>100 μm) (n=6 for each estimate)
Participants noted that uncertainties and variability in estimates would be caused by factors such as the ambient temperature, humidity and the distance between the individuals, as well as their orientation to each other and their behaviour. Participants mentioned, for example, the amount of talking, respiratory hygiene and amount of coughing. Although these were considered in other parts of the questionnaire and here the intention was to elicit estimates regarding the fate of a given amount (considered 100%) of droplets larger than 100 μm, the proportions that might be projected different distances and in different directions by these sorts of behaviours were seen by participants as important sources of variation in the proportion that would follow each of the specified onward paths.
Participants did note that, although it stated that percentages should sum 100%, the question wording was not specific about whether ‘surrounding surfaces’ should include only those that might be touched (eg, excluding the floor), or for all surfaces, which might explain some of the diversity of views. In the scenarios involving tables or desks, most participants thought that more was likely to be deposited on these as they were closer to and more in line with people’s faces (as well as being ‘shared surfaces’). The nature of shared objects was also a cause of uncertainty in some scenarios, although again some participants’ answers suggested that they were already attempting to take into consideration aspects of the transmission that were to be considered further ‘downstream’, such as the amount of contact with those surfaces.
Some participants thought there would be no effect of duration of exposure, one that there would be an upward curve to steady state and one that it would keep increasing with time. One cited references, without comment.42–44 All agreed that it was unlikely that any variants of the virus would cause different estimates at this point in the transmission pathway.
Mitigating large droplet transfer: Participants were asked whether a range of potential mitigation measures would affect the transmission of the virus to the hands of the infected or susceptible person or surrounding surfaces; see table 8 and online supplemental information 6 for graphs of the individual and pooled responses.
Participants' pooled estimates of the likely percentage reduction of transfer of infectious virus along different paths under a number of different potential mitigation strategies
Some participants thought that ventilation could change air flow paths to the extent that transmission might be reduced along all pathways to a small degree, but several others thought that ventilation indoors would make no real difference at all to large droplets. It was also speculated that ventilation might change relative humidity, which might change transmission along these pathways. Outdoors, ultraviolet levels, humidity and localised air flow patterns were all suggested to have an effect, with increased wind speed potentially carrying droplets further.
There was agreement that the infected person wearing a face mask was likely to substantially reduce large droplets being spread both through direct capture and changing the wearer’s behaviour to reduce face touching. Participants suggested that a Perspex screen between the infected and susceptible person might reduce the chance of large droplet transmission directly to the hands of the susceptible person, and reduce the extent of spread to shared surrounding surfaces.
Participants were split on respiratory hygiene, with some thinking it could almost block some of the potential transmission paths, and others being a lot more pessimistic about its effectiveness, thinking that the percussion behind a sneeze or cough is too great for a tissue or sleeve to catch the particles. One participant pointed out that contamination to the susceptible person’s hands may even increase if they were holding the tissue. When asked about gloves, participants said that absorbent materials might behave differently from skin or non-porous materials and also that gloves may affect behaviour. Some participants may have already been thinking ahead to the next stage of the transmission chain—the likelihood of virus survival or passing on to a susceptible person from hands or gloves. This may explain some diversity in answers, but it is important to note that here the diversity of opinions ranges from ‘0%’ to ‘70%–100%’ for the potential reduction in virus transmission to the infected person’s hands and the susceptible person’s hands.
When asked about halving the length of the time of the encounter, participants generally thought this would make little difference in terms of the infected person’s hands because these would be infected outside of the timeframe of the encounter. For contamination of surrounding surfaces or the susceptible person’s hands, one participant described a linear proportional increase with time, then becoming balanced by exponential natural inactivation of the viral particles (faster on skin than on most other surfaces), based on references indicated.
None believed that any of the variants of concern of the virus known about at the time were likely to behave differently in this pathway.
Transfer from hands to surfaces and people: Participants were then asked their estimates for the proportion of infectious virus present on the hands of an infected person that would likely be passed on in a viable form to surrounding surfaces compared with those that might be transferred directly to the hands of another person under a number of different scenarios —with no mitigations and with encounters long enough for virus transfer to be at steady state (but no prior contamination until the infected person enters the scenario). See online supplemental information 6 for participants’ individual estimates and table 9 for a summary.
Participants' pooled estimates on the percentage of infectious SARS-CoV-2 likely transmitted from a contaminated hand to surrounding surfaces or a susceptible person’s hands (assuming some remains on the contaminated person’s hands; n=4 for all estimates)
Participants mostly based their answers on work done on other pathogens, suggesting hand-to-surface transfer efficiencies would depend on the materials involved, the area of contact, and potentially duration of contact. Inactivation rates of the virus would need to be borne in mind, but most participants assumed that in these scenarios it would be irrelevant as contact would be a short time after contamination of the hand. On the ‘shared desk’ scenario, one participant cited work showing high rates of contact with desks, but overall transfer was thought to be below 50% on this path. As direct contact increased, the probabilities increased, and one participant mentioned that there was some evidence that transfer efficiencies are log-normally distributed.45
No one knew of evidence that any variants of concern would behave differently in this pathway.
In mitigating transfer of virus through hand hygiene (table 10), participants were asked to assume it was carried out well, but raised the importance of timing (including how soon after washing their hands contact with surfaces happened, during which time there was the opportunity for recontamination) and the variable effectiveness of hand hygiene. Participants discussed uncertainties associated with contamination during donning and doffing of gloves, and the behavioural changes that gloves might encourage such as potentially less face touching, but potentially a feeling of protection leading to more sneezing into hands and more surface touching.
Participants’ estimates for the effect of different mitigation measures on loss of infectious virus during transfer from hands to surrounding surfaces or a susceptible person’s hands
When asked about the effects of halving the time spent in a scenario, participants generally indicated that the question was not answerable because it was absolute time, not relative time, that was important; and far more important than time was frequency of surface touching.
Transfer from surface to hands: The final section of this pathway focused on transfer from a contaminated surface to the hands of a susceptible person. Participants were asked about likely loss during transference in a number of different scenarios, initially with no mitigations.
Participants discussed uncertainties caused by the unknown duration and frequency of touch, the humidity and roughness of the surfaces, and whether the virus was in wet or dried respiratory secretions. Some thought that metal and ceramic surfaces would potentially support longer survival of infectious virus than paper and card; others were not so sure. Some thought that transfer efficiency would likely be higher on hard, smooth surfaces and lower with paper. Others raised the differences in gripping behaviour with different surfaces and objects—with small items such as plates or condiments more likely to encourage overlapping areas of grip between hands, increasing potential transfer. See table 11 for a summary of their estimates, and online supplemental information 6 for the individual estimates.
Participants’ estimates of the percentage loss of infectious SARS-CoV-2 during transfer from different surfaces to hands
They agreed that there was no evidence to suggest that any of the variants of concern would behave differently in this pathway.
Participants mentioned that surface cleaning (described as ‘cleaned thoroughly with an alcohol-based cleaning product’) had large uncertainties associated with the timing between cleaning and surface touching, although the cleaning itself, if done appropriately, could be highly effective. With gloves, some thought there was even enhanced possibility for transfer due to a larger surface area, and the differences between different glove materials was discussed. When it came to hand hygiene, participants mentioned that washing changes the surface properties of hands temporarily to become more hydrophilic, and some speculated that if hands are not dry they may increase surface transfer efficacy. See online supplemental information 6 for their individual estimates, and table 12 for summaries.
Participants’ estimates on the percentage loss of infectious virus during transfer from surfaces to hands under different potential mitigation strategies
When asked about transfer efficacy from contaminated hands which were secondarily contaminated, rather than directly contaminated from an infected person’s respiratory secretions, participants noted that the amount of drying that would have taken place along the chain of contamination would likely reduce transfer efficacy.
Another potential mitigation that participants raised but about which opinions were not elicited was the potential role of anti-microbial surfaces such as copper.
Pathway 5: factors affecting the transmission of large particles directly to a susceptible person’s mucous membranes
In this section, participants were asked their opinions on how much infectious virus was likely to be lost to the environment from large droplets in the air (>100 μm) before reaching a susceptible person’s mucous membranes under different conditions. Four participants contributed data to this pathway. See online supplemental information 7 for details of their estimates.
Supplemental material
Many participants in round 1 had found these estimates particularly difficult to make because of the degree of chance and variability according to specific conditions involved, such as the directions the people involved were facing, their behaviour, their speech and respiration patterns. The wording in round 2 appeared to help participants, although there was still a fair degree of difference of opinion (see figure 6). It was noted that the UK’s ‘2 m rule’ was based on the distance that these larger particles might travel but that coughing (or an exhaled ‘puff’) was not considered in this rule.

Participants’ estimates of the percentage of infectious virus carried in large (>100 μm) airborne particles that would NOT reach a susceptible person’s mucous membranes if the infected and susceptible person were (A) within 2 m of each other and (B) further than 2 m apart from each other in an unventilated room. In each case, the top graph shows individual estimates, the middle graph the average of those estimates, and the bottom graph a cumulative probability distribution, with (in green) the median and interquartile range. Values in parentheses to the right show percentage below, within, and above the range. Values in parentheses on the left of the bottom graph show 25th, 50th and 75th percentile estimates from the combined responses.
All participants agreed that it was unlikely that any of the variants of concern of SARS-CoV-2 would behave differently in this pathway. They also agreed that their estimates of the likelihood of transmission along this pathway would not be affected by ventilation of the room or whether the people were outdoors rather than indoors. See table 13 for a summary of their estimates.
Participants' estimates of the percentage loss of infectious virus from large droplets (>100 μm) in the air after exhalation from an infected person before it reaches the mucous membranes of a susceptible person nearby
When asked how the length of time of exposure might affect estimates, participants mentioned that this was not known but that it probably increased linearly—possibly up to a threshold at which point infection was almost certain. However, this point was not yet known.
Face coverings worn by the susceptible person were thought to reduce the large droplet transmission potential because they cover the mouth and nose (although not the eyes). One mentioned that contamination from the outside of the mask to the hands or the inside of the mask could occur, but that transfer from a porous fabric to a hand was likely to be low. Participants generally thought that FFP3 masks were likely to offer little additional reduction in these larger droplets over a surgical face mask. A large factor in variability of mitigation offered by a surgical face mask would be tightness of fit. It was mentioned that a face visor formed a physical barrier which, in other diseases and in observational data from COVID-19 outbreaks, seemed to reduce infection risk from larger droplets.
When considering Perspex screens, participants mentioned that the positioning was important, and in the real world many were located too far away. They also mentioned that a poorly positioned screen could potentially increase exposure to infected aerosols.46 47 See table 14 for a summary of their estimates.
Participants' estimates of the percentage reduction of infectious virus from large droplets (>100 μm) caused by different mitigation measures employed by a susceptible person (n=4 in all cases)
In terms of other possible mitigations, one participant mentioned a study from China suggesting that wearing glasses may decrease transmission by protecting the eyes, but that this had not been followed up with more evidence.48
Pathway 6: how much virus is likely to be transmitted from a susceptible person’s hands to their mucous membranes under different conditions
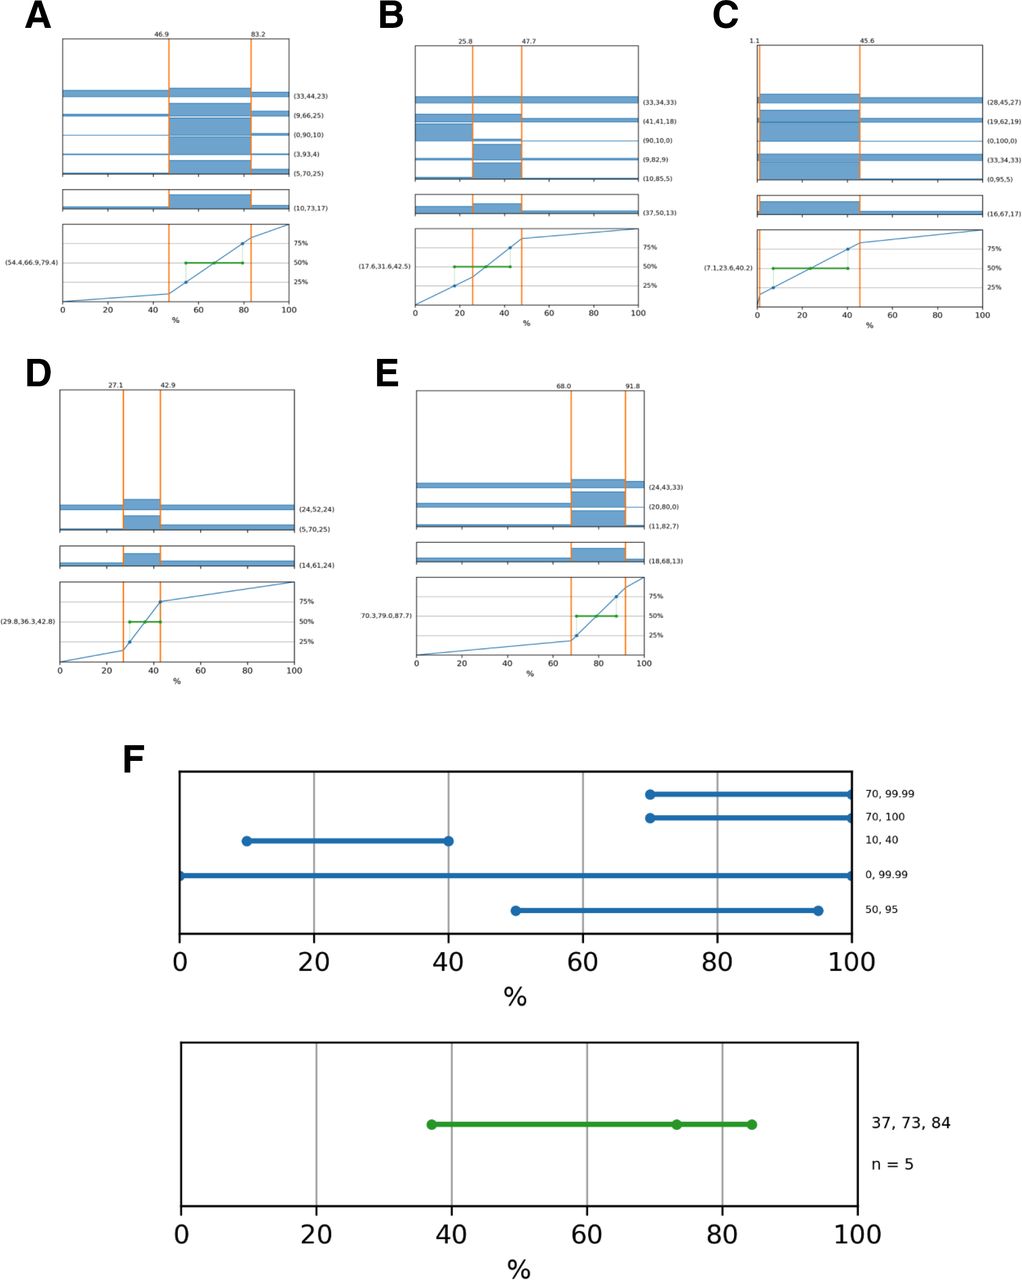
Five participants contributed data on pathway 6. They were first asked the likely percentage loss of virus during transfer from a susceptible person’s hands to their mucous membranes with no mitigations in place, and then the loss due to different potential mitigations that the susceptible person might employ. Participants’ individual estimates and summary graphs are given in figure 7 and table 15.
Participants’ individual estimates (top graphs) and pooled estimates (middle and bottom graphs) of the percentage reduction in infections virus transferred from a person’s contaminated hands to their mucous membranes A) under normal conditions, (B) if the person was wearing a face shield, (C) if the person was wearing gloves, (D) & (E) if the person was wearing a face covering (participants divided into two distinct camps on this question), (F) intervals elicited for the first time in round 2 from individuals (top graph, blue) and pooled (bottom graph, green) if the person were practising good hand hygiene. For graphs (A) to (E) the top graph shows individual estimates, the middle graph the average of those estimates, and the bottom graph a cumulative probability distribution, with (in green) the median and inter-quartile range. Values in parentheses to the right show percentage below, within and above the range. Values in parentheses in the bottom graph show 25th, 50th and 75th percentile estimates from the combined responses. The vertical dashed line shows the 100% reference case. For graph (F) the figures on right hand axis show individual responses in the upper graph and the 25th, 50th and 75th percentile values in the lower graph.
Participants' estimates of the percentage reduction in infectious virus transferred from a person’s contaminated hands to their mucous membranes under different circumstances
Participants mentioned that uncertainties around the behaviour of the individual such as the amount of face touching was important and there may be some gender differences.49 The time elapsed since hands were contaminated (‘fresh’ or dry), the environmental conditions of the hands (moisture content, pH, temperature etc) and the part of the hand used/contaminated50 were all cited as relevant factors that may influence hand-to-mucous membrane transfer. Participants pointed out that face coverings do not protect the eyes, but there is evidence that they can reduce the frequency of face touching in general. With gloves, there was not so much evidence on how much they might change face touching, but there was a view that viral transfer was still possible from contact between gloves and membranes. When asked about face visors, they mentioned that although visors may remind people not to touch their face, they were much more able to reach under it to do so than with a face mask, and that an itch could be scratched ‘though’ a fabric mask without skin-to-skin contact.
Hand sanitisation, participants said, could be very effective but depends how frequently and how well it is performed, leaving very high variability and uncertainty in any estimate.
It was pointed out that the different degrees of absorption of infectious virus through different mucous membrane routes (eg, eyes vs nose vs mouth) was unknown, and that almost all studies on this pathway (such as exist) are laboratory based and so miss out on crucial ‘real world’ behavioural aspects, and many are not on SARS-CoV-2 specifically and so their generalisability to this particular virus is unknown.
They were not aware of any evidence that would suggest that any of the variants of concern behaved differently on this pathway. However they raised other methods of transference such as touching cigarettes, inhalers and other oral devices; food and drink.
Discussion
The purpose of this pragmatic expert elicitation was to collate current knowledge relating to the mechanisms of SARS-CoV-2 transmission for which there is a paucity of empirical evidence. The intention was that this process would generate expert-informed estimated ranges for a number of key parameters that could then be used to quantify (approximately) the relative importance of different routes of transmission of SARS-CoV-2 in a range of contexts.
In some cases, this process has been relatively successful in achieving our aim. Pathways 1 and 6 (and to a lesser extent, 5), for example, showed a reasonable degree of expert agreement on the ranges elicited. The amount of disagreement relating to large droplet and surface contact transmission (eg, pathway 4) may have been masked by a lack of diversity in opinions in round 1, which meant that participants were not offered different ‘camps’ during round 2. Their responses in round 2 (see online supplemental information 6) often revealed considerable disagreement, which may have been better reflected as alternative camps of opinion. However pathways 2 and 3, describing the production of aerosols and small particles by an infected person and the extent to which these two fractions of respiratory output remain in the environment, revealed considerable disagreement between experts.
We examined whether the differences of opinion seen on the degree to which aerosols and droplets were involved in transmission were a matter of consistently different camps of opinion, perhaps related to participants’ domain of experience. Table 16 shows that in some cases there appears to be a majority opinion, while in others (particularly in pathway 3), there was considerable disagreement, even between participants with the same fields of expertise. It is likely that more diversity of opinion exists in the broader pool of worldwide experts than is apparent in round 2 of this elicitation process since some camps of opinion represented in round 1 were not represented in round 2 because the two rounds had different (but overlapping) participant pools.
Individual participants’ opinions on the dominance of aerosols and the loss through aerosols and droplets (where there were ‘camps’ of opinion) shown by specialism. Here aerosols are less than 10 μm in diameter, while droplets include small (10–100 μm) and large (>100 μm). Individual responses shown for the estimates from tables 2, 4 and 6. Colours are used to differentiate the different camps visually
This study highlights the substantial lack of empirical evidence relating to many aspects of SARS-CoV-2 transmission. Despite this, the study confirms three main findings: (1) expert views suggest SARS-CoV-2 is likely to be transmitted via a number of different routes, the relative contributions of which will vary by context, but all of which may be of relevance; (2) there is a lack of scientific consensus on the importance of each of the pathways even among those who have studied elements of these pathways for SARS-CoV-2 and other diseases in detail; and (3) effectively reducing transmission of the virus likely requires bundles of interventions that target multiple different routes simultaneously because in many scenarios there are multiple potential routes for infection.
The lack of consensus on the likelihoods of transmission via critical pathways, indicated not just by experts’ different mathematical estimates but by the rationales they gave which showed that these differences were truly based on fundamental differences of opinion, shows that further research is required to elucidate these in more detail, and with more certainty. More importantly there is a need for stronger evidence for the absolute and relative effects of mitigation measures, used alone and in combination. Even in a world where the overall majority of the population has been vaccinated against this particular infection, large numbers of people will remain vulnerable to all strains (and future respiratory-borne diseases), and some simple measures are likely to be required over the medium to long term.
What we might perhaps learn, then, is first the importance of specific empirical studies, on SARS-CoV-2 where possible, including data from a variety of real-world environments to better inform our understanding of transmission. Second, however, perhaps a greater admission and communication of the large uncertainties that we still have about the transmission process. Public health communications which confidently state ‘facts’ without also communicating uncertainty in the absence of a firm knowledge base not only misinform the public but could be damaging to public trust as new information emerges.
The study has many limitations. Perhaps the greatest is the possibility of bias within the participant pool. It was hard to identify a suitable range of experts who were also prepared to give up the considerable time required to participate in this study, and many invited experts found the process too long, difficult or time consuming to complete the survey. This self-selecting population inevitably leaves open room for biases, as does the initial pragmatic based selection.
Another limitation is that by using a purely online survey form, rather than in-person interviews, it was not possible to help guide participants through the difficult process of translating their subjective knowledge into numerical, probabilistic ranges. It is clear from the answers in both rounds that many participants struggled with the task (for example, see the round 1 answers in figure 3, where some participants gave point estimates with no uncertainty at all when asked for their subjective 95% probability interval, while others gave a range of ‘0%–100%’). The addition of extra clarification wording in round 2 to help participants understand what was being asked of them (for example, to take into account both epistemic uncertainty and variability of the situation into their ranges) may have helped, but a one-to-one conversation would almost certainly have helped more. Despite working in numerical disciplines, many experts still struggle with expressing their knowledge in the form of probabilities and calibration of their uncertainty.28 Internal consistency in answers was also variable, although when the estimates were collated and transformed to be used in the interactive visualisation, in only one case did the majority opinion prove inconsistent (the percentage loss of virus in a large unventilated room being lower than that in a small unventilated room), and in this single instance the minority estimate had to be taken for the overall visualisation to prove consistent and logical.
It is also important to note that this process concentrated on transmission between two individuals meeting in a particular scenario, and hence does not consider population-level mitigation strategies such as self-isolation. It also does not include vaccination as a mitigation.
Because of these limitations, we emphasise that none of the estimated ranges obtained in this expert elicitation should be taken in isolation as a figure on which to base decisions. However, taken as a whole, with all uncertainties and variability in scenarios accounted for, we believe the results serve a useful purpose.
Despite the lack of consensus in the underlying expert judgement and the difficulties that experts had in completing it, this study has provided a basis for assessing the current views on many different elements of the transmission process. By breaking down the transmission process into multiple steps, the study enabled understanding of precisely which elements of transmission currently carry the most epistemic uncertainty and hence would benefit most from further study. Importantly it provides a framework of estimates that can be taken together to communicate the relative importance of different routes of transmission as well as their uncertainties (https://sandpit.bmj.com/graphics/2021/trans/). This can be taken as reflecting the current state of knowledge of transmission of SARS-CoV-2, and despite its limitations due to lack of strong empirical evidence, appears likely to be of use for decision-makers wanting to understand the relative importance of different possible mitigation actions and their associated variability and uncertainties. It would be valuable to revisit the process in the future to determine how the underpinning evidence and the related expert opinion has developed. It might also serve as a template for more rapidly examining transmission of other infectious pathogens. Indeed, the overall method of producing an interactive visualisation to represent a quantified—but not precise—representation of ‘the best current state of knowledge’ of a system for practical use could be of use in many other different circumstances, such as financial, environmental or transport systems.
Data availability statement
Data are available in a public, open access repository. All protocols, questionnaires and data are freely available at https://osf.io/8269v/.
Ethics statements
Patient consent for publication
Acknowledgments
The authors would like to thank members of SAGE-EMG for their helpful comments throughout the development of this study and Professor Sir John Aston for his assistance with the statistical approach to data from round 2. DS and AF would also like to thank the David & Claudia Harding Foundation for their donation which supports the Winton Centre for Risk & Evidence Commuication.
References
Supplementary materials
Supplementary Data
This web only file has been produced by the BMJ Publishing Group from an electronic file supplied by the author(s) and has not been edited for content.
Footnotes
ALJF and SP are joint first authors.
Twitter @DrSDFitzgerald, @harryrutter
Collaborators Experts who took part in the elicitation process and did not wish to remain anonymous are considered collaborators on this project: Linsey C. Marr, Mark H. Weir, Allan Bennett, Danielle Solomon, Lidia Morawska, Alan Beswick, Jonathan Reid, Ben Killingley, Amanda Wilson, Marco-Felipe King, Stephanie Dancer, David Fishwick, Bill Bahnfleth, Chandra Sekhar, Liora Malki-Epshtein, Stephen Griffin, Patrin Watanatada, Martin McKee, Daniel Miller, Edward Wynne-Evans, Peter Openshaw, James Dodd, Hemant Desai, Oleksiy Klymenko.
Contributors AF, SP, HR, SF, AS, RM and CN devised the transmission diagram and the approach to the visualisation, and nominated experts as participants; AF devised the elicitation protocol and collated the data; DS devised the statistical approach to the analysis; SP conducted the analysis; AF and SP drafted the manuscript; all authors completed the manuscript and approved it. AF acts as guarantor for the manuscript.
Funding Funding to support development of the visualisation tool and publication was provided by the PROTECT COVID-19 National Core Study on transmission and environment, managed by the Health and Safety Executive on behalf of HM Government.
Competing interests We have read and understood the BMJ policy on declaration of interests. SF is a co-investigator on the UKRI AIRBODS research programme, CN is principal investigator on the UKRI TRACK, Breathing Cities and HECOIRA projects and co-investigator on the NIHR CONTACT study. SP is co-investigator on the UKRI TRACK project. HR, SF, AS, CN were on the working group for the Royal Academy of Engineering Infection Resilient Environments report. CN was on the working group for the Academy of Medical Sciences reports on COVID-19 in 2020 and 2021.
AF, SP, CN, SF, AS, RM and HR are members of SAGE-EMG.
Patient and public involvement statement Patients and the public were not involved in the design or conduct of this expert elicitation. The visualisation that the elicitation underlies is intended for public use and dissemination, and was user-tested with members of the public during its design by the Winton Centre for Risk & Evidence Communication.
Provenance and peer review Not commissioned; externally peer reviewed.
Supplemental material This content has been supplied by the author(s). It has not been vetted by BMJ Publishing Group Limited (BMJ) and may not have been peer-reviewed. Any opinions or recommendations discussed are solely those of the author(s) and are not endorsed by BMJ. BMJ disclaims all liability and responsibility arising from any reliance placed on the content. Where the content includes any translated material, BMJ does not warrant the accuracy and reliability of the translations (including but not limited to local regulations, clinical guidelines, terminology, drug names and drug dosages), and is not responsible for any error and/or omissions arising from translation and adaptation or otherwise.