Article Text

Abstract
Objectives In 2002, the UK's National Institute for Health and Care Excellence concluded that the multiple sclerosis (MS) disease modifying therapies; interferon-β and glatiramer acetate, were not cost effective over the short term but recognised that reducing disability over the longer term might dramatically improve the cost effectiveness. The UK Risk-sharing Scheme (RSS) was established to ensure cost-effective provision by prospectively collecting disability-related data from UK-treated patients with MS and comparing findings to a natural history (untreated) cohort. However, deficiencies were found in the originally selected untreated cohort and the resulting analytical approach. This study aims to identify a more suitable natural history cohort and to develop a robust analytical approach using the new cohort.
Design The Scientific Advisory Group, recommended the British Columbia Multiple Sclerosis (BCMS) database, Canada, as providing a more suitable natural history comparator cohort. Transition probabilities were derived and different Markov models (discrete and continuous) with and without baseline covariates were applied.
Setting MS clinics in Canada and the UK.
Participants From the BCMS database, 898 ‘untreated’ patients with MS considered eligible for drug treatment based on the UK's Association of British Neurologists criteria.
Outcome measure The predicted Expanded Disability Status Scale (EDSS) score was collected and assessed for goodness of fit when compared with actual outcome.
Results The BCMS untreated cohort contributed 7335 EDSS scores over a median 6.4 years (6357 EDSS ‘transitions’ recorded at consecutive visits) during the period 1980–1995. A continuous Markov model with ‘onset age’ as a binary covariate was deemed the most suitable model for future RSS analysis.
Conclusions A new untreated MS cohort from British Columbia has been selected and will be modelled using a continuous Markov model with onset age as a baseline covariate. This approach will now be applied to the treated UK RSS MS cohort for future price adjustment calculations.
- quality of life
- risk sharing scheme
- interferon-beta
- glatiramer acetate
- Markov model
This is an Open Access article distributed in accordance with the Creative Commons Attribution Non Commercial (CC BY-NC 3.0) license, which permits others to distribute, remix, adapt, build upon this work non-commercially, and license their derivative works on different terms, provided the original work is properly cited and the use is non-commercial. See: http://creativecommons.org/licenses/by-nc/3.0/
Statistics from Altmetric.com
Strengths and limitations of this study
-
Identification of a new natural history cohort for the UK Risk-sharing Scheme, consisting of untreated patients with multiple sclerosis (MS) in an era when disease-modifying drugs for MS were not available, minimising potential selection bias.
-
Identification and validation of a Markov model for disease progression in MS which can be applied to data collected in clinical practice over multiple years of follow-up.
-
The identification of an analytical model which can use data collected at any time point within the follow-up period.
-
The study related to observational data collected in clinical practice; unseen or unmeasured confounding cannot be adjusted for.
-
Different techniques to assess effectiveness of drugs in observational studies such as matching on propensity scores cannot be directly compared to this methodology.
Introduction
In January 2002, the UK's National Institute of Health and Care Excellence (NICE) opted not to recommend the use of the disease modifying therapies (DMTs) interferon β and glatiramer acetate for multiple sclerosis (MS) on the basis of cost-effectiveness analyses using data derived from the pivotal 2–3-year randomised controlled trials.1 However, they recognised that uncertainties over the assumptions made in the modelling could unpredictably influence the long-term estimates of cost effectiveness. Thus in February 2002, the UK's Department of Health launched the ‘Risk-sharing Scheme’ (RSS)2 with a circular entitled the ‘Cost effective provision of DMTs for people with MS’ in collaboration with the Association of British Neurologists (ABN), the MS Trust, the MS Society and the pharmaceutical companies manufacturing interferon β and glatiramer acetate. Between 2002 and 2005 the scheme enrolled over 5000 patients with MS initiating a DMT in the UK, with the aim of measuring their disability annually over a 10-year period.
The principle of the RSS is to use a Markov model to predict, for each DMT separately, the expected movement of patients between the Expanded Disability Status Scale (EDSS) states both ‘on’ and ‘off’ treatment. For patients ‘off’ treatment, the model uses a matrix of transition probabilities derived from the actual progressions seen in the ‘natural history’ comparator cohort. These transition matrices are modified for patients ‘on’ treatment by multiplying by the HR (relative rate of disease progression) derived separately for each DMT from the pivotal randomised controlled clinical trials. The model then predicts how the distribution of patients will evolve over a 20-year horizon, starting with the actual distribution at baseline for the primary analysis RSS cohort. Comparing the average observed loss of utility (average utility-weighted disease progression) for patients in the RSS to the expected loss calculated by the Markov model for patients ‘on’ treatment; it is calculated as follows. The expected ‘benefit’ of treatment (with a specific DMT) is the ‘hypothetical’ difference between the expected outcome without treatment and with treatment, as calculated in each case from the Markov model. The actual ‘benefit’ of treatment is the ‘observed’ difference between the expected outcome without treatment and the actual outcome with treatment. The ‘deviation’ of the actual benefit from the expected is the primary outcome measure and calculated as a percentage of the expected benefit. This measure can have negative or positive values so that a negative deviation implies that the observed benefit was greater than predicted, a positive deviation suggesting that it was worse than predicted and a value of 0 indicating that it was exactly as predicted. A positive deviation beyond the level agreed (confidential and individual between each pharmaceutical company and the Department of Health) would lead to a price adjustment down to achieve the target cost effectiveness. Details can be found in the Health Service Circular.2
The original cost-effectiveness model3 produced a target outcome based on transition probabilities obtained from a pre-existing natural history (DMT naive) cohort of patients from London, Ontario, Canada along with HRs from the pivotal randomised control trials (unpublished data provided to the Department of Health by the manufacturers). Complementary quality of life data collected by the MS Trust4 and cost data from Kobelt et al5 were used to populate the cost-effectiveness model. The targets ensured that the UK's National Health Service (NHS) benchmark of £36 000 (€46 000/US$56 000) per quality-adjusted life year (QALY) was reached over a 20-year projection, based on a planned 10-year follow-up period within the RSS with two yearly interim analyses. Before being allowed to enter the scheme, the cost of each drug was assessed against the NICE bench mark over a 20-year time horizon. Price reductions were implemented to ensure each product reached the target cost per QALY using the original NICE calculations,3 an average 13.7% price reduction was achieved for the NHS at the outset of the Scheme.
The 2-year analysis revealed significant inconsistencies in a number of sensitivity analyses.6 Depending on the underlying assumptions, some analyses suggested that observed disability progression in the treated cohort was worse than that predicted for the historical untreated cohort while others demonstrated the contrary effect. A detrimental effect of DMT did not match the described effect on short term, 2–3 year, disability seen in the randomised placebo controlled trials.7–12 With the predetermined analytical approach (based on a discrete Markov model) appearing to produce unreliable results with wide variation, a decision was made to postpone any decision on cost-effectiveness to allow for a reappraisal of the process and to reconsider whether the statistical models and control data chosen were ‘fit for purpose’.
In retrospect, both the control dataset and analysis model selected, when setting up the RSS, were found to have intrinsic flaws that made them unsuitable for the task.6 The natural history cohort (from London, Ontario, Canada) was unexpectedly found to contain retrospectively smoothed disability data (rather than actual, real-time collected disability scores), censoring any improvement in EDSS. Comparing our uncensored treated cohort to data retrospectively smoothed in this way would have the effect of unpredictably underestimating any treatment effect. In addition, individual-level patient data were not available from the London, Ontario cohort, which prevented precise baseline matching between the two cohorts, limiting our validation of the underlying (Markov) model for disease progression. Furthermore, there were only 342 patients matching the ABN prescribing criteria from which to generate the models.
This paper outlines the development of a more appropriate analysis plan and the choice of a cohort fit for the needs of the scheme. The method described will be applied in the 4-year and 6-year cost-effectiveness analyses. The analysis plan was approved by the scheme's independent Scientific Advisory Group in December 2012 in advance of unlocking the newly collected 4-year and 6-year UK RSS data planned for autumn 2013.
Methods
Identification of a new MS natural history dataset
The Scientific Advisory Group undertook a detailed examination of all the available dataset through literature reviews, expert opinion, discussion with the clinical leads for the RSS and discussion with the Sylvia Lawry Centre for Multiple Sclerosis Research, Germany (http://www.slcmsr.net). Selection criteria included availability of EDSS score measurements and access to the unprocessed (actual) scores (ie, no data smoothing or other data manipulation). Other factors considered were size of the database, prospective data collection and length of follow-up, and the broader setting such as a close match to the UK in terms of the health system and MS prevalence in the underlying population. While no single perfect dataset existed, the British Columbia Multiple Sclerosis (BCMS) database, Canada (est. 1980) was identified as the best natural history comparator cohort for our purposes.13 ,14 In this dataset—as in the RSS—actual EDSS scores were recorded prospectively. It is estimated to capture 80% of the BCMS population15 ,16 and as such is considered representative of the wider MS population. EDSS scores were recorded by MS specialist neurologists after a face-to-face consultation with the patient; this typically occurred at the annual MS clinic visit. Patient data was not truncated if secondary-progressive MS was reached; that is, all relapse-onset patients with MS and their respective EDSS scores were considered eligible. By 2004, the database had records for over 5900 patients spanning 28 years (>25 000 cumulative years) of prospective follow-up. Until 1996 DMTs were not widely available in British Columbia.
Patient and data selection from the BCMS database
In order to generate relevant data for our needs, patients were only selected from the BCMS database if they fulfilled the 2001 ABN criteria for interferon β and glatiramer acetate (IFN-β/GA) use (adapted from online supplementary appendix IV Health Service Circular 2002/2004), defined as: EDSS≤6.5; ≥18 years old; two relapses in the last 2 calendar-years.
Baseline for each patient was the 'first eligibility date,’ meaning the first date at which a patient fulfilled the ABN eligibility criteria. Only patients with definite MS (Poser et al's criteria17) and a minimum of two EDSS scores at least 9 months apart were considered.
In order to be comparable with the RSS data the following adjustments and selection were applied:
-
EDSS scores taken during a relapse or when disability was affected by other factors considered largely unrelated to MS (eg, hip fracture) were excluded.
-
For the original discrete Markov model (see below) as well as visual presentation of the yearly descriptive data (see Results section), annual EDSS scores were needed. However, as is typical in clinical practice, not all visits/EDSS assessments occurred at exactly yearly intervals and the exclusion of some EDSS scores (eg, due to a relapse or hip fracture) also affected the availability of a yearly score. Therefore, data was selected such that only EDSS scores 1 year apart (± 3 calendar months) were considered. See online supplementary appendix 1 for further details.
-
For the continuous Markov model, (see below) all eligible EDSS scores were used regardless of their measurement interval, that is, no yearly data selection, as in (2), was needed.
-
All patient data was truncated to the end of 1995 (ie, the last full year in which the DMTs were not widely available in BC although initially it was planned to truncate individual patient profiles only once a DMT was initiated (in order to maximise the number of EDSS assessments), even when this extended past 1995 when treatment would have been available). It became apparent that this introduced a bias into the data, likely related to ‘indication bias,’ whereby patients ‘doing well’ would be less likely to start a DMT.
Analysis
The primary purpose of the analytical work was to find the best statistical model able to predict EDSS progression in a natural history cohort based on entry demographic and clinical data. The following models were applied in the current study and their performances were critically evaluated:
-
The discrete Markov model18 as in the original 2-year analysis,6 that is, disability scores (EDSS) had to be measured at discrete, fixed time points.
-
A continuous Markov model allowing for EDSS scores to be collected at any time, that is, at any unevenly spaced time intervals, as is typical in clinical practice.19 Such a model also allowed covariates to be included. This model allows for a more complete use of EDSS scores collected at irregular time intervals both in the BCMS and RSS cohorts.
With regard to the ‘MS course’ (ie, relapsing remitting vs secondary progressive) as a potential covariate, we did not distinguish between these disease states when developing the Markov models because secondary progressive MS is simply a later stage of the relapsing remitting form of the disease and the transition has considerable overlap.
Predicting outcomes in the continuous Markov model (b)
A multistate model algorithm (‘R’ library ‘msm’19) allows the EDSS distribution to be predicted at any time t (see online supplementary appendix 2 for further details).
To keep computations feasible, only integer EDSS values were used and fractional values rounded down (ie, EDSS 1.5 was scored as 1, 2.5 was scored as 2 etc). Moreover, ‘msm’ as a tool for multistate modelling requires a consecutive numbering of (disease) states, starting with ‘1’. Therefore the (rounded down) EDSS 0 became ‘state 1’, EDSS 1 ‘state 2’ etc, leading to the 10 EDSS ‘states’ (1–10) representing EDSS 0–9. Transition probability and intensity matrices as the output of these models were then used to predict disease progression in terms of EDSS as follows.
Covariates considered in the models
The selection of potential covariates by the scientific advisory group was based on; (1) those which were reliably and consistently recorded in both the BCMS and the RSS database and (2) a priori knowledge of those associated with the outcome of disability progression. As a result, sex, age at MS symptom onset, as well as disease duration and disability (EDSS)—combined into a Multiple Sclerosis Severity Score (MSSS)20 were tested in the continuous Markov model with up to two covariates. In addition, for the more promising models an alternative model was considered with dichotomous covariates (split at the median) replacing the continuous variables. This has the advantage that the resulting model can be formulated as the aggregate of a small number of discrete Markov models, so computations can be carried out without requiring special software, especially since the EDSS values in the RSS have been collected at strict yearly intervals, as opposed to the BCMS data which was based on routine clinical practice, and therefore do not necessitate a continuous model.
Critical evaluation of the models was performed using the following validation techniques, with the goal being to identify the most appropriate model to represent the natural progression of MS (see online supplementary appendix 3 for further details).
-
Transition probabilities derived from the complete eligible, BCMS natural history data were applied to the baseline data to predict outcomes over the subsequent 10 years to assess how well it matched the observed data from which the model was derived.
-
The BCMS dataset was repeatedly randomly divided into two subsets of equal size, with one-half only being used to derive transition probabilities (as in #1). The probabilities derived from this half were then applied to the baseline characteristics of the second half, generating a model whose goodness of fit could be judged against the actual, observed 10-year disability data of this second half.
Measuring goodness of fit
Goodness of fit was assessed via visual inspection of the graphical displays as well as numerically. These included progression over time (mean EDSS profiles) for the cohort as a whole as well as comparisons with the proportions in a particular EDSS state over time.
For the numerical assessment a classical mean square prediction error (weighted root mean square over years of the prediction error in the average quantity shown, weighted by the number of patients contributing data in the given year) and the likelihood, resulting from the maximum likelihood algorithm were calculated for each of the covariate models to allow comparison.
Results
Data description
The baseline demographics showed the BCMS and RSS cohorts to be remarkably well matched. Patient characteristics are shown in table 1.
Characteristics of patients reaching the ABN criteria in the BCMS database after 1980 (the ‘natural history’ untreated comparator cohort) and the RSS cohort
The natural history BCMS comparator dataset comprised of 898 patient profiles with 7335 EDSS scores providing 6357 transitions between consecutive EDSS states, that is, 6357 ‘events’ where EDSS values were recorded at consecutive visits. In any given ‘transition’, a patient's EDSS could increase, decrease or stay the same.
Discrete Markov model
When applying the discrete Markov model to the BCMS reference data, the goodness of fit was unsatisfactory, underestimating EDSS in earlier years and overestimating in later years (see figure 1). Consequently, the discrete Markov model was no longer considered appropriate, and the development of a continuous Markov model was pursued.

Transition probabilities obtained from the BCC dataset using the discrete Markov model were then applied to the baseline Expanded Disability Status Scale (EDSS) of the same cohort, projected over 10 years to produce a predicted mean EDSS outcome (red) and compared with the observed mean EDSS course of the cohort (blue).
Continuous Markov models
The following continuous 10-state Markov models (EDSS 0–9), with and without covariates, were evaluated:
-
Model without covariates
-
One covariate model with age at onseti
-
One covariate model with MSSSi at baseline
-
One covariate model with disease durationi at baseline
-
One covariate model with sex
-
Two covariate model: sex and age at onseti
-
Two covariate model: MSSSi at baseline and age at onseti
-
Two covariate model: disease durationi at baseline and age at onseti
There was a systematic deviation with a slight overestimation when the continuous Markov model without covariates was applied (figure 2). Hence this model was not considered further.

Transition probabilities obtained from the BCC dataset using the continuous Markov model were then applied to the baseline Expanded Disability Status Scale (EDSS) of the same cohort, projected over 10 years to produce a predicted mean EDSS outcome (red) and compared with the observed mean EDSS course of the cohort (blue).
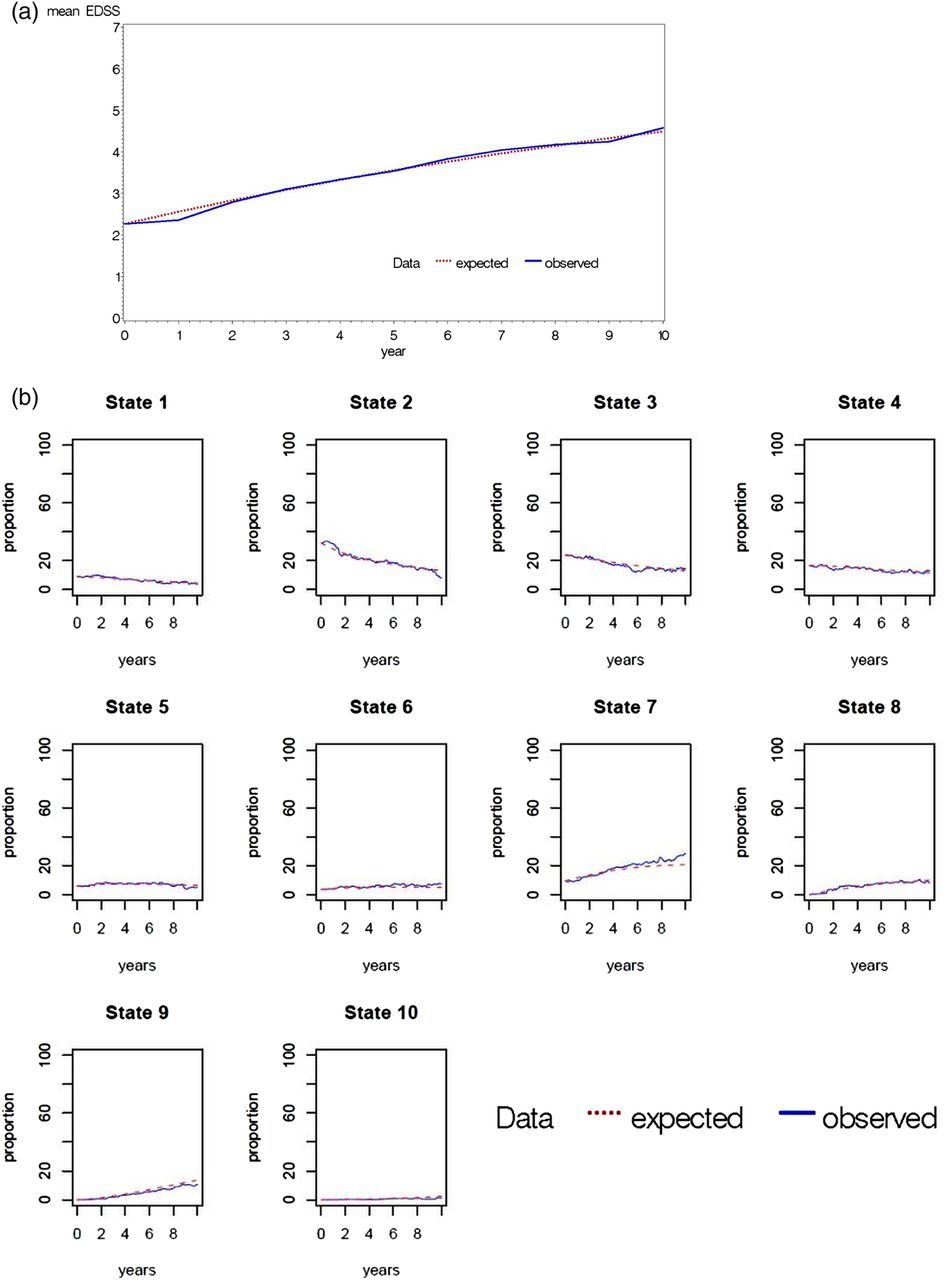
After validation was repeated for all covariate models (table 2), it was noted that inclusion of a second covariate did not reveal any additional benefits. With one covariate, the model with ‘age at onset’ as a binary covariate (median: 28 years) was selected because it displayed the smallest −2 log likelihood and minimal EDSS prediction error (see table 2). Further, the goodness of fit was acceptable when comparing the predicted and observed EDSS profiles, as shown in figure 3A. A more detailed comparison of observed and expected proportions ‘per EDSS state’ is shown in figure 3B which confirmed that no systematic deviations were present which might otherwise have been cancelled out when only looking at an average EDSS profile. It was concluded that only random fluctuation remained, and a systematic deviation was no longer visible. When comparing figure 1 with figures 2 or 3 it should be noted that the former is based on the annual EDSS data which were obtained as described in online supplementary appendix 1 while figures 2 and 3 show the EDSS at any time t, that is, not necessarily when an observation was recorded (while the continuous Markov model takes into account all observations at any time t it is not straightforward to define what the ‘observed EDSS’ at any time t is in a graphic representation; for details on how to define and calculate what is the observed EDSS at a given time see online supplementary appendix 2).
‘Goodness of fit’ statistics for the 10-state† disability (EDSS) Markov models

Transition probabilities obtained from the BCC dataset using the continuous Markov model with one covariate ‘age at onset’ (binary version) were then applied to the baseline Expanded Disability Status Scale (EDSS) of the same cohort, projected over 10 years to produce a predicted outcome (red) compared with the observed course of the cohort (blue): (A) mean EDSS shown in the predicted and actual cohorts. (B) The proportion of patients predicted to be in each of the 10 EDSS states over time (state 1; EDSS 0, state 2; EDSS 1 and 1.5, state 3; EDSS 2.0 and 2.5, state 4; EDSS 3.0 and 3.5, state 5; EDSS 4.0 and 4.5, state 6; EDSS 5.0 and 5.5, state 7; EDSS 6.0 and 6.5, state 8; EDSS 7.0 and 7.5, state 9; EDSS 8.0 and 8.5, state 10; EDSS 9.0 and 9.5).
Using this ‘best’ model, transition probabilities were extracted from half of the BCMS cohort and applied to the other half. This gave good predictions, with the mean EDSS profiles (observed vs predicted) being similar to each other and to those of the entire cohort.
In summary, the continuous Markov model with a single covariate—onset age—was considered the model of choice to be used in future RSS analysis. The respective transition matrices are presented in table 3.
Transition matrices for the 10-state disability (EDSS) Markov model with ‘age at onset’ as binary covariate and annual transition probabilities
Discussion
This paper outlines the successful identification of a more suitable natural history cohort for the UK MS RSS, with the British Columbia, Canada dataset now replacing the London, Ontario, Canada cohort in the RSS analysis plan. The analytical work is based on a Markov model which has been frequently used for ordinal data from relapsing (remitting) diseases, especially MS.21–23
Further, because use of the British Columbian data has now allowed access to a richer dataset, including full access to original, ‘real-time’ disability (EDSS) assessments, as well as individual patient level, we have been able to explore and develop more appropriate approaches. Specifically, we were able to employ more advanced statistical models, making use of all the available data and including clinically relevant patient-level characteristics as covariates in order to identify the most accurate predictive model to be applied to the RSS. Finally, we observed that to minimise ‘indication bias’ in relation to initiation of a DMT in the natural history cohort (British Columbia), censoring (data truncation) was more appropriate at the population (rather than individual) level.
Findings from our validation procedures indicate future feasibility with respect to obtaining reliable cost-effectiveness results in the upcoming 6-year RSS analyses. For instance, visualisation of the predicted and observed outcomes in the final model showed an almost perfect overlap, with a one-covariate model, with no additional improvements from introducing further covariates. In addition, the final model was able to predict accurately the MS disease course (disability) in half of the cohort (randomly selected) having obtained the transition probabilities from the other half. These observations along with the baseline comparability of the BCMS and the RSS cohorts suggest the transition probabilities from the BCMS cohort within this model can be used to predict the untreated progression of patients in the RSS.
An additional strength of this continuous model is the ability to include all valid disability (EDSS) assessments, regardless of their exact timing, maximising data usage. We acknowledge the potential limitations of using a historical control from a geographically discrete population. It is possible that the natural history of MS has changed over time or that the BCMS population is not representative of a UK one. However, in British Columbia, it has been previously shown that disability progression (as measured by the EDSS) has not substantially changed overtime (1980–200924). Further, we have previously shown that the use of a ‘contemporary’ untreated control cohort—that is, where patients are potentially eligible for a DMT in an era when the DMTs are readily available, but remain untreated—is subject to indication bias and thus a historical control cohort, with data collected pre-DMT use, is likely to be more appropriate.25 Although we are proposing using a dataset from Canada (as was the original RSS natural history dataset) and cannot rule out differences between the BCMS patients and the UK RSS cohort, we are reassured that the baseline features are comparable except baseline EDSS, but in the underlying Markov model we calculate the transition probabilities between EDSS ‘states’, and different baseline EDSS distributions would only matter if baseline EDSS as such had a prognostic value, which does not seem to be the case when looking at the rates of EDSS progression stratified by EDSS at baseline. In addition, the underlying ethnicity of the two jurisdictions was similar; around the time of the cohort selection in British Columbia, 30.2% of the population self-identified as British and within the wider BCMS database, >90% were Caucasian,26 ,27 which is comparable to the UK cohort. Both cohorts may have enrolled a small number of patients with neuromyelitis optica (we estimate this to be less than 0.5% of the total28) because the availability of the antibody assay occurred after 2007 (and after enrolment to the RSS scheme). An additional limitation is the potential for different ways of measuring the EDSS scores between the BCMS and the UK RSS cohorts because of changes in how the EDSS is interpreted over time and also because of differences in the physicians performing the assessments.
Observational studies, such as the RSS, provide a pragmatic approach when assessing drug effectiveness in a disease such as MS. As MS disability accrues over decades, the cost-effectiveness of disease modifying treatments cannot be assessed by short-term randomised controlled trials. However, observational studies are not without their own unique challenges. Identifying and validating models to predict the untreated outcome of treated cohorts is a crucial step to measuring the long-term benefits of MS treatments. MS is the commonest cause of progressive disability in the western world, thus identification of treatments that might significantly impact long-term disability outcomes in MS could have major cost and quality of life benefits. Additionally, any models developed here would be readily transferable to other chronic diseases.
The current model described here will form the basis for calculating the drug cost per QALY and for informing decisions on price adjustment in order to deliver the treatments cost effectively to UK patients with MS in an ongoing manner. The model will be used to calculate the HR at which each product delivers efficacy against the NICE agreed cost per QALY and should any product fall short price reductions will be implemented by the DH.
Further work on repeated measures modelling, testing the models on other untreated appropriate MS datasets and identifying sensitivity analyses (such as the effect of drop outs, switching to a different class of DMT and the effects of treatments on backward transitions, ie, disability improvements) are also planned.
Acknowledgments
At the outset of the Risk-sharing Scheme (RSS) agreement was reached between the UK Health Departments and the four manufacturers of the DMTs that all costs for this research project would be split 72 centres participated in the collection of data for the Risk-sharing Scheme from across the UK. Data were collected over a 10-year period and thus changes have been seen within the clinical teams. The authors are grateful to all the clinicians for the work undertaken at the centres which made the RSS possible. A list of the centres can be found at http://www.mstrust.org.uk/research/risksharingscheme/. The independent Scientific Advisory Group has been chaired by Professor Lilford and involved Professor Yoav Ben-shlomo, Professor Richard Gray and Professor Pelham Barton. The Multiple Sclerosis (MS) Trust has performed an administrative coordinating role in the RSS and PAREXEL have performed the data collection from the sites and undertaken the analytical work. The British Columbia MS (BCMS) database was created by Donald Paty FRCPC and Donald Studney MD FRCPC and maintained over the years by grants from various sources, including the MS Society of Canada, the MS/MRI Research Group, the US National MS Society and the Canadian Institutes of Health Research. The authors gratefully acknowledge the BCMS Clinic neurologists who contributed to the study through patient examination and data collection (current members listed here by primary clinic): UBC MS Clinic: A Traboulsee, MD, FRCPC (UBC Hospital MS Clinic Director and Head of the UBC MS Programs); A-L Sayao, MD, FRCPC; V Devonshire, MD, FRCPC; S Hashimoto, MD, FRCPC (UBC and Victoria MS Clinics); J Hooge, MD, FRCPC (UBC and Prince George MS Clinic); L Kastrukoff, MD, FRCPC (UBC and Prince George MS Clinic); J Oger, MD, FRCPC; Kelowna MS Clinic: D Adams, MD, FRCPC; D Craig, MD, FRCPC; S Meckling, MD, FRCPC; Prince George MS Clinic: L Daly, MD, FRCPC; Victoria MS Clinic: O Hrebicek, MD, FRCPC; D Parton, MD, FRCPC; K Atwell-Pope, MD, FRCPC. The views expressed in this paper do not necessarily reflect the views of each individual acknowledged.
References
Supplementary materials
Supplementary Data
This web only file has been produced by the BMJ Publishing Group from an electronic file supplied by the author(s) and has not been edited for content.
Files in this Data Supplement:
- Data supplement 1 - Online supplement
Footnotes
-
Contributors All authors (1) made substantial contributions to the conception and design, acquisition of data, or analysis and interpretation of data; (2) were involved in drafting the article or revising it critically for important intellectual content and (3) were involved in the final approval of the version to be published. JP was involved in the identification of the alternative dataset, interpretation of the analysis and was involved in the drafting and revising of the manuscript. TB was involved in the drafting and revision of this manuscript. HT, FZ and JO were responsible for the preparation of the British Columbia Multiple Sclerosis (BCMS) dataset, analysis of the data, and drafting and revision of the manuscript, MB was involved in the identification of the alternative dataset, interpretation of the analysis and was involved in the drafting and revising of the manuscript, MD was involved in the interpretation of the analysis and was involved in the drafting and revising of the manuscript, CD was involved in the analysis of the data, its interpretation and was involved in the drafting and revising of the manuscript.
-
Funding This research received funding via the MS Trust; five equal contributions to the RSS funding from the Department of Health and the four participating pharmaceutical companies.
-
Competing interests JP serves on the scientific advisory board for Charcot Foundation, and has performed advisory work for Biogen Idec, Merck Serono Ltd, Bayer Schering Pharma, Novartis Pharmaceuticals UK Ltd, Teva Pharmaceutical Industries Ltd, Gilenya, Ono Pharmaceutical Co Ltd, Primary i-research, Chugai Pharma Europe and CI Consulting. She receives research support from the MS Society, QIDIS, Merck Serono Ltd, Novartis Pharmaceuticals and Bayer Schering Pharma, plus conference expenses from Novartis and Merck Serono Ltd. TB is an employee of PAREXEL International (Department of Biostatistics) has been working for numerous pharmaceutical companies, including those which are participating in the UK MS Risk Sharing Scheme. no financial interests to declare. HT is funded by the Multiple Sclerosis Society of Canada (Don Paty Career Development Award), Michael Smith Foundation for Health Research and is the Canada Research Chair for Neuroepidemiology and Multiple Sclerosis. She has received: research support from the US National Multiple Sclerosis Society, CIHR, and UK MS Trust; speaker honoraria and/or travel expenses to attend conferences from the Consortium of MS Centres, US National MS Society, the University of British Columbia Multiple Sclerosis Research Program, Bayer Pharmaceutical (speaker, 2010, honoraria declined), Teva Pharmaceuticals (speaker 2011), ECTRIMS (2011, 2012), UK MS Trust (2011), and the Chesapeake Health Education Program, US Veterans Affairs (2012, honorarium declined), Novartis Canada (2012) and the US National MS Society (2012, honorarium declined). Unless otherwise stated, all speaker honoraria are either donated to an MS charity or to an unrestricted grant for use by her research group. JO is funded by the University of British Columbia and has received grants and contracts from Biogen-Idec, Bayer, EMD Serono, Merk Serono. He has received speaker fees, Advisory Board membership and travel grants from Bayer, Novartis, Serono and the Ministry of Health of British Columbia. His lab is partially funded by the Christopher Foundation. MB sits on advisory boards for Bio CSL, genzyme & Biogen Idec. Received sponsorship to attend international meetings from Novartis & BioCSL. Department has received funding to develop services from Biogen Idec, Genzyme and Novartis. MD over the past 5 years received speaker honoraria, consulting fees and travel grants from, Bayer, BiogenIdec, Novartis, Merck-Serono and Teva.
-
Ethics approval University of British Columbia's Clinical Research Ethics Board (H08-01544).
-
Provenance and peer review Not commissioned; externally peer reviewed.
-
Data sharing statement The British Columbia Multiple Sclerosis (BCMS) database is held at the host institution and analysis and access to the data are limited to on-site access. More detailed analysis results are available on request to the corresponding author.
-
↵i Two variants were implemented: continuous (original) data and a ‘binary’ version with the median used for categorisation.
Linked Articles
- Correction