Article Text

Abstract
Objective Design a metric to assess the comparative effectiveness of biomedical data elements within a study that incorporates their statistical relatedness to a given outcome variable as well as a measurement of the quality of their underlying data.
Materials and methods The cohort consisted of 874 patients with adenocarcinoma of the lung, each with 47 clinical data elements. The p value for each element was calculated using the Cox proportional hazard univariable regression model with overall survival as the endpoint. An attribute or A-score was calculated by quantification of an element's four quality attributes; Completeness, Comprehensiveness, Consistency and Overall-cost. An effectiveness or E-score was obtained by calculating the conditional probabilities of the p-value and A-score within the given data set with their product equaling the effectiveness score (E-score).
Results The E-score metric provided information about the utility of an element beyond an outcome-related p value ranking. E-scores for elements age-at-diagnosis, gender and tobacco-use showed utility above what their respective p values alone would indicate due to their relative ease of acquisition, that is, higher A-scores. Conversely, elements surgery-site, histologic-type and pathological-TNM stage were down-ranked in comparison to their p values based on lower A-scores caused by significantly higher acquisition costs.
Conclusions A novel metric termed E-score was developed which incorporates standard statistics with data quality metrics and was tested on elements from a large lung cohort. Results show that an element's underlying data quality is an important consideration in addition to p value correlation to outcome when determining the element's clinical or research utility in a study.
- Epidemiology
- Oncology
This is an Open Access article distributed in accordance with the Creative Commons Attribution Non Commercial (CC BY-NC 3.0) license, which permits others to distribute, remix, adapt, build upon this work non-commercially, and license their derivative works on different terms, provided the original work is properly cited and the use is non-commercial. See: http://creativecommons.org/licenses/by-nc/3.0/
Statistics from Altmetric.com
Article summary
Article focus
-
Develop a metric to assess the overall usefulness or ‘effectiveness’ of biomedical data as it relates to a given outcome.
-
Evaluate the metric on a large lung cancer cohort for 47 clinical variables using survival as an endpoint.
-
Evaluate the metric on simulated data to determine whether it is informative across a large range of data values.
Key messages
-
A novel metric termed Effectiveness score was developed to assess a data element's real-world usefulness.
-
The metric consisted of two parts; the p value derived from the data element's correlation to survival, and an Attribute score derived by quantitation of four element components; Completeness, Comprehensiveness, Consistency and Overall-cost.
-
The metric was tested on a large cancer cohort and on simulated data.
Strengths and limitations of this study
-
The main strength of this study is the evaluation of the metric on a large real-world cohort.
-
The main limitation is the current lack of more subjective data for the cost of data acquisition.
Introduction
According to the Institute of Medicine committee, comparative effectiveness research (CER) is defined as ‘the generation and synthesis of evidence that compares the benefits and harms of alternative methods to prevent, diagnose, treat and monitor a clinical condition or to improve the delivery of care. The purpose of CER is to assist consumers, clinicians, purchasers and policy-makers to make informed decisions that will improve healthcare at both the individual and population levels.’1 In recent years, CER has garnered much attention on the basis of two main factors: (1) the sharp rise in medical care cost, and (2) the passage of the Patient Protection and Affordable Care Act (P.L. 111–148). Additionally, there is a long-studied and often-quoted phenomenon termed practice pattern variation. This observation by J Wennberg and colleagues at the Darmouth Institute for Health Policy and Clinical Practice, shows that there is great geographical variation in treatment for the same condition with some of the treatments being inferior to others in terms of effectiveness and cost. Furthermore, if these variations could be eliminated a savings of up to 30% in total healthcare cost could be possible.2–8 In light of this observation and the aforementioned factors, congressional interest and subsequently funding for CER increased with $1.1 billion of the American Recovery and Reinvestment Act of 2009 allocated to CER alone. Indeed, the research presented in this article was conducted under a grant from that very stimulus money.
As defined above, CER is concerned with the effectiveness of treatments in the medical setting, and uses numerous methods to determine the treatment, diagnosis or prevention most optimal for the patient population as a whole. The work described here is similar in nature with traditional CER but is undertaken at a more fine-grain level and is more generalisable to different types of clinical and biomedical data. Whereas traditional CER research typically uses multiple attributes to assess a particular procedure or treatment's effectiveness for a population we use multiple attributes of each individual data element to assess its effectiveness with respect to a given outcome variable. One can think of this approach as quantifying the comparative effectiveness of the individual elements within a study that are often in turn used to perform comparative effectiveness research at a higher level. To accomplish this, quantitation of the correlation of a data element to an outcome and the underlying quality of the data element itself is performed. These measures are then incorporated into a metric termed the effectiveness score (E-score).
We propose that calculation of an E-score for all data elements considered in a CER study is critical for the following reasons. First, the most effective predictors of a given outcome variable may be any number of elements ranging from demographic and socioeconomic factors, such as age, race, education or income, to the altered expression of a gene or protein. It is beyond the ability of a researcher to anticipate all of the elements that may be correlated to a given. We, therefore, begin from the assumption that all elements in a study are equally valuable in predicting outcome. Second, the quality of the data comprising any particular element is made up of several factors, here termed attributes, that ultimately determine the ability to use any given data element for CER. The E-score, therefore, provides information about the utility of an element beyond a simple ranking by outcome-related p value and gives CER investigators a more thorough understanding of the true utility of each data element allowing for more advanced data mining and multivariate analyses using standard statistical and machine learning techniques.
The main objective in this study was to design a metric for the assessment of the utility of biomedical data that incorporates both standard statistical relatedness to a given outcome and a measurement of the quality of an element's intrinsic attributes within a given dataset with the hope that this metric can then be used for a more thorough evaluation of individual data elements in determining their utility for inclusion into higher dimensional CER research.
Materials and methods
Lung cohort
The data set used in this study consisted of 874 patients diagnosed with adenocarcinoma lung cancer who consented to Moffitt Cancer Center's Total Cancer Care (TCC) protocol. TCC is a multi-institutional research protocol that prospectively enrolls cancer patients to permit access to self-reported and medical record data, blood samples and tissue for research purposes. Patients who consent to TCC are followed for life, including screening, diagnosis and treatment of cancer.
Patient data
Each patient has a total of 47 accompanying data elements encompassing demographic and clinical variables from Moffitt's Cancer Registry and TCC source systems. For a full list of data elements see table 2. Moffitt's Cancer Registry abstracts information on demographics, diagnosis, stage, treatment and chemotherapy from the medical record. Follow-up for survival occurs annually through passive and active methods. Patients seen for second opinions are not included in the Cancer Registry database because they do not fall under current reportable state and/or federal guidelines. Smoking status is categorised as self-report ever smoker (current or former smoker) or never smoker. Where available, pathologic TNM staging was utilised and if these data were missing we utilised clinical stage.
p Value calculation
The p value for either a categorical or a continuous element was calculated using the Cox proportional hazard univariable regression model for overall survival in 2-year follow-up. Asymptotic likelihood ratio test was used to quantify the p value for each element.
A-score calculation
An attribute or A-score was calculated by quantification of an element's quality attributes. For this study, we limited the A-score to include four main components; Completeness, Comprehensiveness, Consistency and Overall-cost. The definitions for each of the four components along with their mean, median and SD within the lung data set is given in table 1. The first three components can be thought of as more quantitative in nature as predefined formulas were used in their calculation. The final component, Overall-cost, was by necessity, more subjective due to the inclusion of gross estimates of the relative cost of a procedure or treatment, as well as a subjective assessment of the effect of a procedure on the patient's quality of life (QOL). All A-scores are represented as an integer between 1 and 100, with 100 representing the optimal A-score value, that is, higher quality data with less cost and impact for the patient, and one representing the least optimal value. Calculation of the A-score consisted of simply averaging the four components.
Attributes used for A-score calculation
E-score calculation
Conditional probabilities for A-score and p value components.
The E-score is calculated as the product of the conditional probabilities; A-score and p value components. The conditional probability is the probability of the observed p value or A-score being the smallest within the set of observed values. Assumptions include independence of data elements, independence of the p value and A-score and the most significant p value or A-score is smallest or largest within the tested elements. The E-score can be written as in equation 1.

where i is the ith data element tested; p the p value associated with a hypothesis test; a the A-score associated with a particular data element; U the distribution of p values; W the distribution of A-scores; R(·) the rank of the element’ s p-value or A-score compared to U (W).
Using the assumption of independence of tests, we can rewrite equation 1 into equation 2.

where M is the number of data elements tested.
In brief, the p value portion of the ES is directly computable from the p value, accounting for the number of tests performed. The A-score portion is computed using the empirical cumulative distribution function observed (W).
function(p,m) { ((1−(1−p)m))/(m×p)}
function(a,m,W) { ((1−(ecdf(W)(a))m)/(m×(1−ecdf(W)(a))))}
Results
A-score components quantification
Mean, median and SD (STDV) for each of the four A-score components are given in table 1. The first component, Completeness had the highest mean, median and lowest STDV. The Completeness component does not directly address the type of entry but rather only any form of non-null entry in the database for that element. The component, Comprehensiveness, had the second highest mean and median values. This component is an attempt to measure the amount of coverage an entry for a data element provides for a given topic. For example, take the data element survival; the expected level of coverage would be time in months. If the entry was given as time in years then the Comprehensiveness component would be penalised due to lack of coverage granularity. An entry such as time given in days would not be penalised as this could readily be converted to months. The Consistency component showed much greater variation than either Completeness or Comprehensiveness. This component measures the degree of equivalency of information across disparate databases. In this study, data was derived from three separate data sources so that this entry represents the equivalency of entries across these three sources. Overall-cost had the lowest mean, median and highest STDV of the four components. This component represents a subjective qualitative measurement of overall burden to both the patient and the institution in terms of financial cost and QOL. Financial cost and QOL were given a relative cost score between 1 and 100 with 1 being the least expensive and 100 being the most expensive.
A-score distribution
We wanted to determine the frequency of A-scores within the potential range of values for the elements within this study. Figure 1 shows a frequency histogram of the A-scores for the entire lung cancer cohort. A large majority of A-scores fell into the upper half of the possible range of values (50–100). This is a direct reflection of the make up of the A-score as the components Completeness and Comprehensiveness showed near perfect scores for many of the elements. Because of this fact the useful distribution of A-scores is between the values 50 and 100 and is driven by the large variation in the remaining two A-score components, Consistency and Overall-cost.
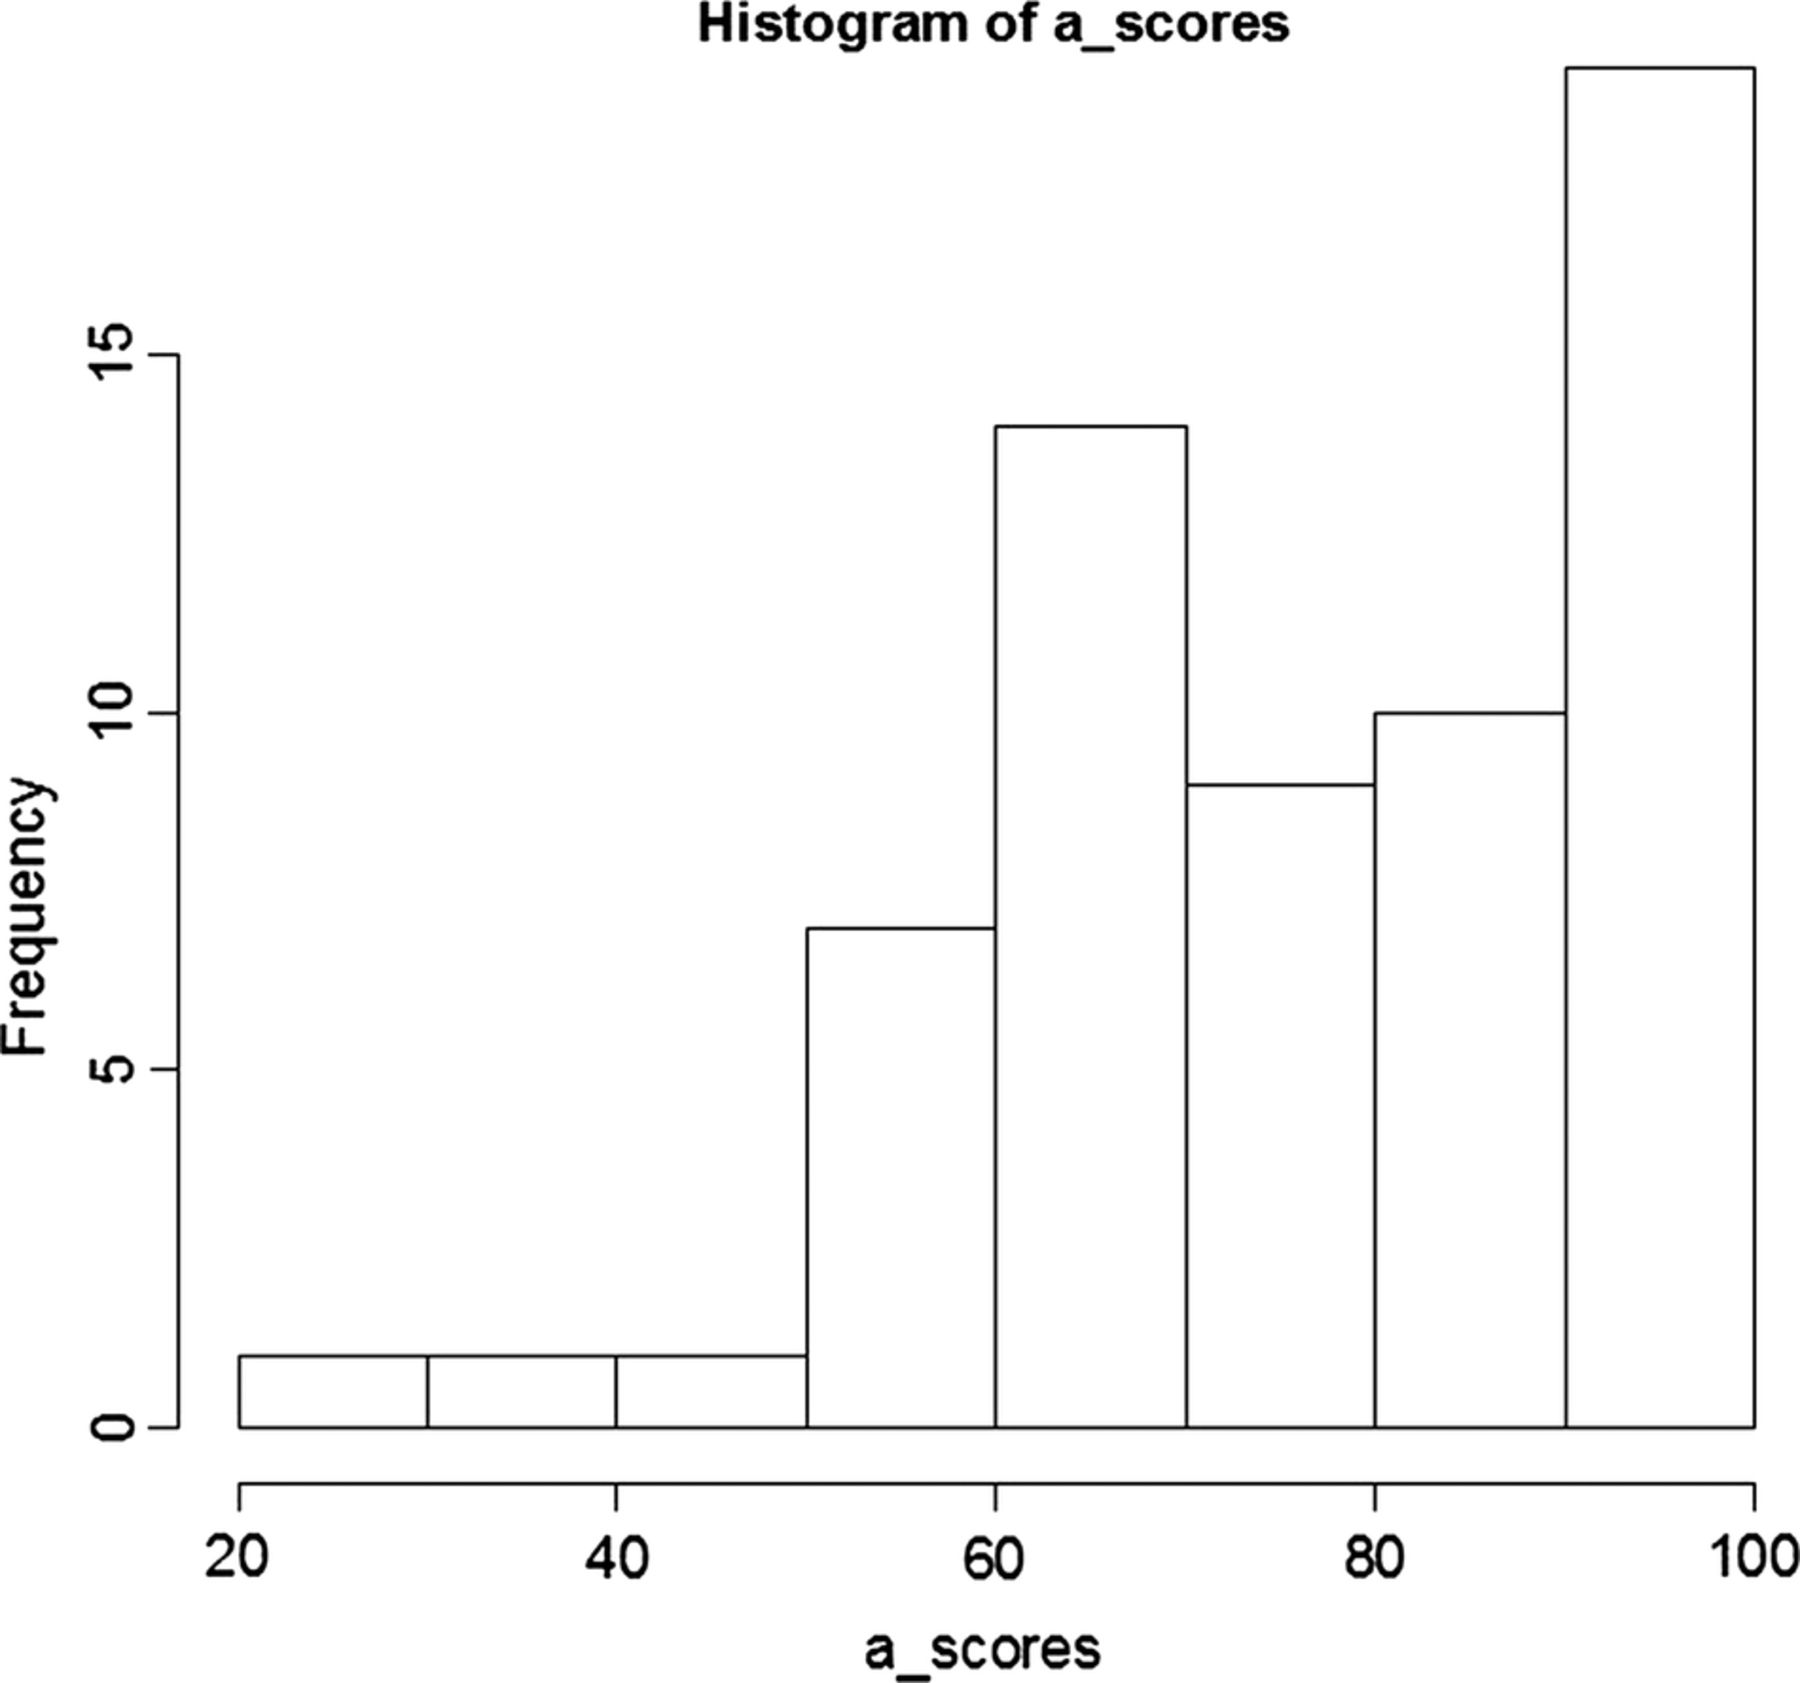
Frequency histogram of attribute-scores for entire lung cancer cohort.
E-score distribution
We wanted to study the distribution of E-scores for all elements for the entire lung cohort used in this study. Figure 2 is a log10 plot of the E-scores for all 47 elements across the 874 patients with lung cancer. The E-scores are distributed across an approximate threefold range (0001–1). The E-scores plotted here were calculated as described in the Materials and Methods section and were normalised between 0 and 1 before being converted to log10 values. This conversion was chosen to best visualise the overall distribution of the data.

log10 of effectiveness-scores for entire lung cancer cohort.
Element ranking
To understand the value and rank relationships between p value, A-score and E-score we calculated these three values for each of the 47 elements. Table 2 is a summary of each element's p value, A-score and E-score along with their respective rankings within the lung dataset. The Element column contains the name of each of the 47 elements used in this study. The p value column includes the value derived from the Cox regression log likelihood test using 2-year survival as an endpoint. The A-score column contains the summary of the four A-score components as described in the Materials and Methods section. The E-score column consists of the values calculated for the current data set comprising 874 patients with lung cancer; with the entire value set scaled between 0 and 1. The table lists the elements by descending E-score ranking. The ranking for the p value, A-score and E-score are also provided. The most significant E-score for this dataset was Age-at-DX, age at diagnosis. The p value for this element with respect to 2-year survival was also the lowest in the entire data set. Additionally, the A-score for this element was ranked in the first position as well. For a more complete description of each element refer to online supplementary table S1.
Ranking by E-score of the 47 elements from the lung cancer cohort
Effect of A-score variation on E-scores for a subset of survey elements
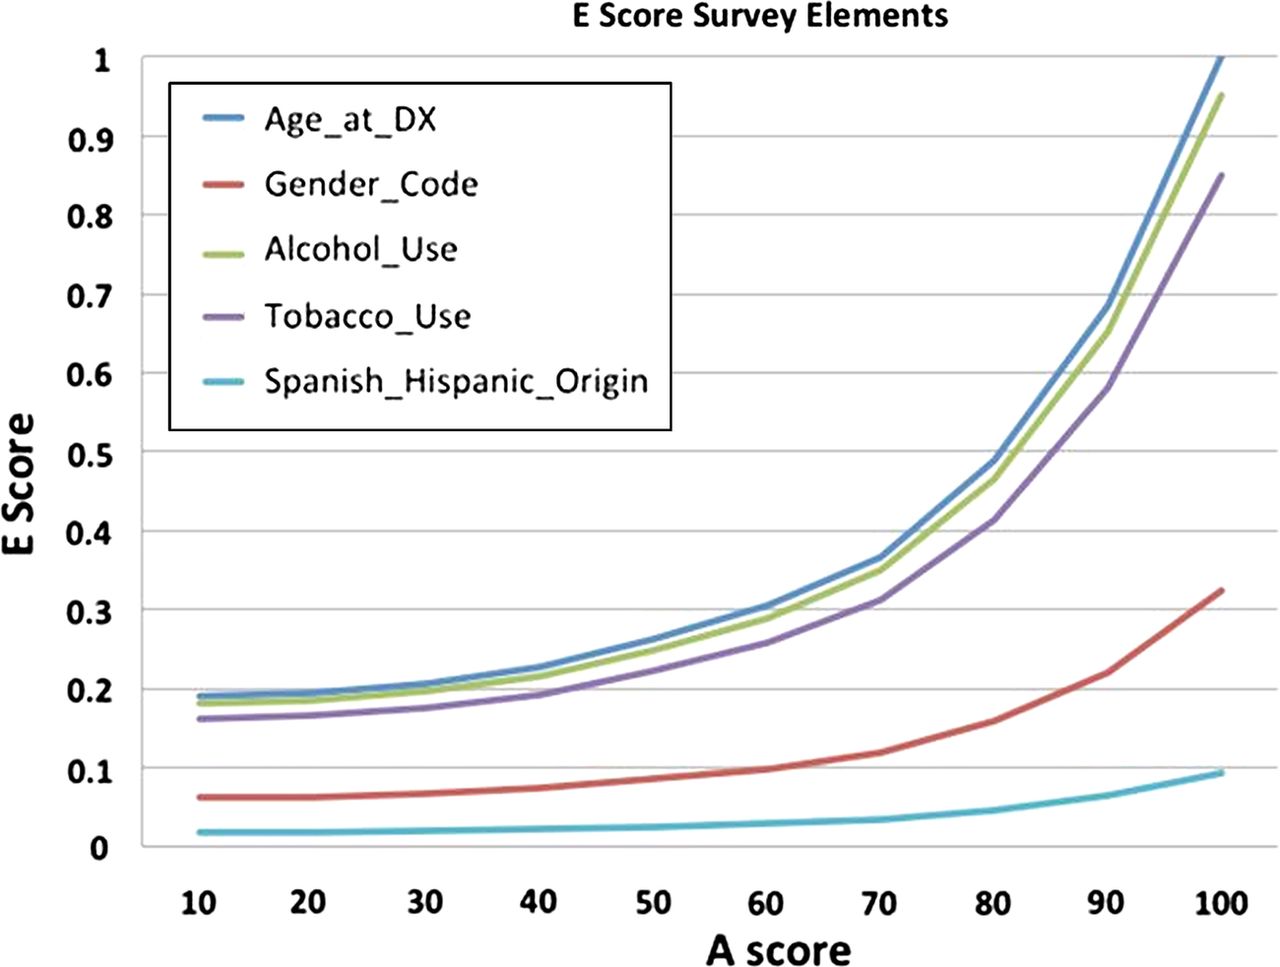
To test the behaviour of the E-score metric we analysed the effect of A-score variation on E-score values for a chosen set of survey elements. Figure 2 is a graph of the E-score values calculated for five selected survey elements using a set of 10 simulated A-scores at 10 unit intervals between 10 and 100. It is important to note that the true p value calculated from the data for each of the elements was used here (see table 2 for the p values of each element) and that only the A-scores were simulated.
Effect of A-score variation on E-scores for a subset of procedure elements
We wanted to test the behaviour of the E-score metric for a set of procedure elements with varying A-scores. Figure 3 is a graph of the E-score values for four selected procedure elements for a series of 10 simulated A-scores between 10 and 100. As in figure 2 the actual p value calculated from the data was used here (see table 2 for the p values of each element) and only the A-score was simulated.

Graph of the five survey-type elements showing changes in effectiveness-score with varying attribute-score.
Discussion
Determination of the ‘best’ or most effective data element that is prognostic for an outcome variable may at first glance be a simple process. One needs only to pick an appropriate endpoint, such as overall survival, and calculate p values for each element that is possibly related to that outcome. A simple ranking of the elements by lowest to highest p value will result in the most correlated elements. However, in practice this approach is often not as straightforward as it may seem for various reasons. First, there can often be several elements with similar p values. How then is the correct one chosen? It is unlikely that elements with very similar p values would not show ranking changes if they were calculated on a slightly different data set or using a different formula. Hence, the ‘best’ element with respect to a given outcome may change depending on the data set or the method being employed. Second, the data underlying the elements within the dataset may have differed drastically in their acquisition, from something as simple as asking a patient their age and smoking history to performing an invasive diagnostic test. The cost in dollars and to the patient's QOL will therefore be drastically different for acquisition of these two types of data elements. Does the researcher simply ignore any underlying cost or data quality considerations and use the element with the slightly lower p value? What if the researcher decides to consider these factors and wants to quantitate the cost and quality attributes of selected elements? How is this quantitation formulated? To address these questions for ourselves and for the biomedical research community at large we developed a novel metric to quantify an element's underlying data attributes and incorporate that value with the element's relationship to outcome as defined by standard statistical techniques.
To determine the underlying quality and cost of a given element we first decided to select four categories or components that we felt would best cover variations seen in biomedical data. While there were a virtually infinite number of choices depending on the focus of the research and type of element, we settled on the four components described in table 1 for calculation of our A-score; Completeness, Comprehensiveness, Consistency and Overall-cost. The mean and median for Completeness and Comprehensiveness was very high for our dataset indicating that the majority of the samples first, had an entry for the 47 elements and the entry provided the expected level of coverage for the topic at hand. The Consistency component was chosen to address a common problem seen at our institution and many others; inconsistency of entries for the same data element across different source systems. We had always suspected this was an issue with our data but had not quantified its level until now. This component along with Overall-cost accounted for the majority of variation seen in the A-score. Overall-cost had the lowest mean, median and highest STDV of the four components. This result was expected as the data elements naturally fall into two main categories consisting of demographic or survey-type elements in which data acquisition is relatively easy resulting in a higher value, and procedure-based elements when the information is acquired as part of a procedure or treatment. These procedure-based elements had a higher cost both in terms of dollars and in patients QOL and, therefore, lower values. The distribution of A-scores (figure 1) was a direct reflection of the median values of its four components with Completeness and Comprehensiveness being of high quality and Consistency and Overall-cost of medium quality. One could argue that because the majority of A-scores are distributed between 50 and 100 we could have simply ignored the first two components. Although this is a valid argument for this study it may not hold well for a different data set. Additionally, there were several elements that showed large variability in the first two components of the A-score and we did not want to lose the ability to identify these types of elements in this and future studies solely to simplify determination of the A-score.
To assist the research in selecting the ‘best’ element(s) our derived score must have some meaningful distribution so that two scores could be determined to be different by a reasonable assessment. To determine the range of values for our E-score within the lung cohort we plotted the distribution of E-scores for all 47 elements. The range for E-score values was approximately threefold (figure 2). This range indicated significant E-score variation within the dataset to rank elements with respect to E-score. However, if E-score is simply a reflection of the p value calculated for survival or a reflection of the A-score for data quality and cost it would be of little additional value. We wanted to determine whether E-score would in some cases alter the ranking of elements with respect to their p values calculated for a given outcome or A-score. The results in table 2 show the rankings for all three of these values for each of the 47 elements. The most significant E-score for this dataset was Age-at-DX (ie, age at diagnosis). The p value for this element with respect to 2-year survival was also the lowest in this data set. This element was, therefore, very effective at predicting overall survival for this dataset. Additionally, the A-score for this element was ranked in the first position as well. Typically, survey or demographic type elements should have a higher A-score which is evident in table 2. However, some of these types of elements had lower A-scores than expected due to inconsistencies across databases within the institution or to missing entries. Interestingly, Lung tumour size had the lowest E-score for this cohort. This was due to its high p value or lack of correlation to survival and its low A-score due to low values for the Completeness and Consistency components of the A-score.
Most interestingly, the results here demonstrate large variations among p value, A-score and E-score ranking suggesting that a high p value or A-score rank does not necessarily relate to a high E-score rank. For example, Pathological-TNM stage had the second highest p value rank in our dataset; however, it was down-ranked by E-score due to its low A-score ranking, indicating the high cost in terms of dollars and patient QOL to acquire this data. A similar situation is noted for the Histology_Behavior element. It had a very high p value rank but a low E-score rank due to its low A value. The opposite effect was observed for the elements Gender, Alcohol_Use and Tobacco_Use. Where these three elements had relatively low p value rankings 19, 10 and 14, respectively, they had E-score rankings of 2, 3 and 4, respectively, due to high A-score values. These observations indicate that application of the E-score to a given data element in many cases can give the investigator a measurement of the utility of a data element beyond p value alone.
Next, we wanted to determine whether our E-score would be able to reflect changes across a range of A-scores for a relatively stable p value as could happen when using a different data set? To address this important question we first selected five survey-type elements, and four procedure-based elements. We used their actual p values calculated within our data set but varied the A-scores to determine its effect on E-score. Figure 3 shows a large range of variation between elements with changing A-scores and demonstrates the ability of the E-score to scale or reflect changes in the underlying quality of the data, that is, A-score changes. Additionally, and more importantly, these large variations in E-score are only observed for those elements for which the p value with respect to survival was significant as was the case for Age and Diagnosis, Alcohol Use and Tobacco Use. Variation of the A-score had little to no effect on the two elements that had p values that were not statistically significant, that is, Gender and Spanish Hispanic Origin. Similarly, figure 4 shows a large range of variation in E-scores between two of the elements, Pathological-TNM Stage and Histologic Type, with changing A-scores. Both of these elements had p values that were highly significant with respect to overall survival. Note that although the p values of the two elements differ by a factor of two relative p value ranking within the data set is close, thus accounting for the overlapping E-scores seen here. As can be observed in figure 3, for the survey elements the E-score is able to reflect changes in the underlying quality of the data, that is, E-score changes in a consistent and interpretable manner. Again, variation of the A-score of those elements having non-significant p values, that is, Tumor Site and Clinical Tumor Size had little to no effect on the E-score.

Graph of the two procedure-based elements showing change in effectiveness-score with varying attribute-score. Note the Pathological_TNM_Stage and Histologic_Type have nearly overlapping lines due to similar p value ranking for these elements.
Limitations
The limitations of this type of work are twofold: determination of the components defining quality and cost for the A-score metric; and procurement of data needed to calculate the A-score. As stated previously, the number of choices for the A-score components is almost infinite. It would be unlikely that any two researchers would choose the same four components or define them in the same manner as we have performed. It is the subjective nature of this selection process and its application to underlying data that makes this approach difficult to reproduce for a different dataset or at a different institution. The questions that arise however is whether strict adherence to the same A-score composition chosen for this study is necessary. It would seem that a reasonable approach would be selection components deemed important to define cost and quality of the underlying data based on the question at hand and on data availability and formulate an A-score metric from there. Otherwise, a very detailed description of each components that make up the A-score and how they are applied to each data element would be needed to assure the same results across different data sources.
The second consideration is the amount of additional data necessary to calculate the A-score. Normally, only the value of outcome variable and the variable(s) thought to be related to it are used. Here, those variables along with the additional metadata for such components as Completeness and Comprehensiveness would need to be collected. Additionally, cost both in financial terms and to the patient's QOL would need to be determined either as a purely subjective measurement or as a qualitative measurement or a combination of the two. This process would greatly add to the cost of the process. Clearly, this approach works best when data already exist for these components and/or some of the values for the components, such as Overall-cost can be reasonably estimated.
Conclusion
In summary, a novel metric termed E-score has been developed which incorporates standard statistics with data quality metrics. This E-score was applied to a set of clinical attributes from a lung data set. Our results show that an element's underlying data quality can be combined with standard statistical calculation of correlation to an outcome variable in determining the element's clinical or research utility.
Footnotes
-
Contributors GB (PI) conceived the idea of the Effectiveness score, developed the idea, performed the analysis and wrote the final manuscript. S E assisted in refining the concept of the Effectiveness score, developed the R application used to perform the analysis, assisted in development of the statistical model for the E-score and helped revise the draft manuscript. GH assisted in development of the underlying statistical approach for calculation of the E-score. MS provided input in the conceptual development of the E-score and guidance in the manuscript preparation. NB provided assistance in the determination of optimal data quality attributes for the data elements. AM contributed in the conceptual development of the E-score. SM played a major role in the calculation of the data quality attributes for the elements. DF contributed to the conceptual development of the E-score.
-
Funding National Cancer Institute 1RC2CA148332-01 (PI: Fenstermacher).
-
Competing interests None.
-
Provenance and peer review Not commissioned; externally peer reviewed.
-
Data sharing statement Extra data can be accessed via the Dryad data repository at http://datadryad.org/ with the doi:10.5061/dryad.54r13.
Linked Articles
- Correction