Article Text

Abstract
Objectives This study assessed the extent of educational and income inequalities in self-rated health (SRH) in the German adult population between 2003 and 2012 and how these inequalities changed over time.
Design Repeated cross-sectional health interview surveys conducted in 2003, 2009, 2010 and 2012.
Setting and participants The study population was the German adult population aged 25–69, living in private households in Germany. In total 54 197 randomly selected participants (2003: 6890; 2009: 16 418; 2010: 17 145; 2012: 13 744) were included.
Main outcome measures SRH was assessed with one single question. Five answer categories were dichotomised into good (‘very good’ and ‘good’) versus poor (‘moderate’, ‘poor’, ‘very poor’) SRH. To estimate the extent of the correlation between absolute and relative inequalities in SRH on the one hand, and income and education on the other; slope indices of inequality (SII) and relative indices of inequality (RII) were estimated using linear probability and log-binomial regression models.
Results There were considerable and persisting educational and income inequalities in SRH in every survey year. Absolute educational inequalities were largely stable (2003: SII=0.25, 95% CI 0.21 to 0.30; 2012: 0.29, 95% CI 0.25 to 0.33; p trend=0.359). Similarly, absolute income inequalities were stable (2003: SII=0.22, 95% CI 0.17 to 0.27; 2012: SII=0.26, 95% CI 0.22 to 0.30; p trend=0.168). RII by education (2003: 2.53, 95% CI 2.11 to 3.03; 2012: 2.72, 95% CI 2.36 to 3.13; p trend=0.531) and income (2003: 2.09. 95% CI 1.75 to 2.49; 2012: 2.53, 95% CI 2.19 to 2.92; p trend=0.051) were equally stable over the same period.
Conclusions We found considerable and persisting absolute and relative socioeconomic inequalities in SRH in the German adult population between 2003 and 2012, with those in lower socioeconomic position reporting poorer SRH. These findings should be a concern for both public health professionals and political decision makers.
- health inequalities
- self-rated health
- socioeconomic inequalities
- time trends
This is an open access article distributed in accordance with the Creative Commons Attribution Non Commercial (CC BY-NC 4.0) license, which permits others to distribute, remix, adapt, build upon this work non-commercially, and license their derivative works on different terms, provided the original work is properly cited, appropriate credit is given, any changes made indicated, and the use is non-commercial. See: http://creativecommons.org/licenses/by-nc/4.0/.
Statistics from Altmetric.com
Strengths and limitations of this study
An additional data source is used for the first time to assess time trends in socioeconomic inequalities in self-rated health in Germany.
The large sample size and repeated cross-sectional design with de novo random sampling in each survey year enhanced the generalisability and accuracy of the trend analysis.
We consistently reported summary measures of both absolute and relative income and educational inequalities simultaneously to prevent biassed judgements about health inequality trends.
The study period of one decade may have been too short to detect significant trends in health inequalities.
The design of our study does not allow any inferences about potential underlying causal pathways between socioeconomic and health inequalities.
Introduction
Social inequalities in health are a great public health challenge worldwide and have become a burgeoning field of epidemiological research.1–3 The existence of a social gradient in health is well established for a broad variety of health outcomes and measures of socioeconomic position (SEP).4–6 SEP is an aggregate concept that includes resource-based and prestige-based measures of an individual’s social position and integrates diverse pathways by which SEP affects health.7 8 The most frequently discussed are behavioural, material and psychosocial pathways, which should be regarded as complementary to one another.9 10 Behavioural explanations focus on the social patterning of unhealthy behaviours (eg, smoking, physical inactivity and so on) with those in lower socioeconomic position at higher risk for unhealthy behaviours.11 Material explanations are focusing on direct effects of absolute material deprivation, such as the health effect of low-quality food, fuel poverty, poor housing conditions and so on, whereas psychosocial explanations focus more on relative deprivation and the psychological and biological sequelae of being relatively deprived from material and social resources.12 Income can be regarded as an SEP measure that reflects available material resources. Educational attainment is stronger related to non-material resources such as cognitive abilities, self-efficacy, knowledge, attitudes and values shaping health behaviours and the use of health services. Each SEP measure can be independently correlated to specific health outcomes and hence cannot be used interchangeably but should be used complementarily in social epidemiological studies.7 9 11–14
Health inequalities can show distinct dynamics over time among different social groups and countries.5 15–17 Consecutive monitoring of these inequalities is thus needed to identify adverse trajectories and potential opportunities for public health interventions. Evidence about time trends of socioeconomic health inequalities in Germany is still scarce. Only a few studies have analysed the dynamics of socioeconomic inequalities in self-rated health (SRH) in the German adult population.18–20 These studies all used the German Socioeconomic Panel (GSOEP) as data source and exclusively used income or education as single measure of SEP. The results have been mixed: While Moor et al 18 found stable educational inequalities between 1994 and 2014, Lampert et al 19 and Siegel et al 20 reported increasing income inequalities in SRH for the same time period. Very few studies have investigated time trends of socioeconomic inequalities in SRH during the last decade on an international level. Like the previous results for Germany, such studies have shown mixed results: Hu et al 21 analysed trends in 17 European countries, excluding Germany, between 1990 and 2010 and found persisting but stable absolute and relative educational inequalities in a pooled analysis of all countries, but the results differed decidedly by country, sex and between absolute and relative inequalities. Leão et al 22 reported stable absolute and slightly increasing relative educational inequalities in SRH in a pooled analysis of data from 26 European countries, whereas absolute inequalities increased throughout the study period in some European countries, including Germany. Another recent study by Mackenbach et al 23 found a continuing trend of decreasing less-than-good SRH in a pooled analysis of Western European countries, with a faster decline among the highly educated and hence, increasing relative health inequalities.
Our study contributes to the debate around time trends in socioeconomic health inequalities by adding evidence from an additional data source not previously used for such analyses. Furthermore, we use both education and income to assess absolute and relative SRH inequalities with summary measures. This enables us to give reliable estimates of the extent and dynamics of socioeconomic inequalities in SRH. By selecting 2003–2012, we focus on a decade during which fundamental reforms of the welfare system and the labour market were implemented in Germany. Further, the 2008 financial crisis affected the economy and hence possibly the conditions in which people live and work. The objectives of this study were to analyse the extent of socioeconomic inequalities in SRH in the German adult population and how they might have changed between 2003 and 2012.
Methods
This article follows the Strengthening the Reporting of Observational Studies in Epidemiology guidelines.24
Data source
This analysis is based on data obtained from four national German telephone health surveys. The first was conducted in 2003 and then continued by the subsequent German Health Update surveys in 2009, 2010 and 2012.25 These surveys are part of the national health monitoring system administered by the Robert Koch Institute on behalf of the German Ministry of Health. The study population was the German adult population (aged >18 years) living in private households, who were contactable by landline telephone and had sufficient language proficiency to be interviewed in German. In each survey year, the sample population was obtained by a two-stage random sampling process: First, random digit dialling26 was used to get a random sample of German landline phone numbers and then the ‘last-birthday method’27 (2003, 2009, 2010) or the ‘Kish Selection Grid’28 (2012) was used to randomly select one adult interviewee from each household. The participants were asked for verbal consent before computer-assisted telephone interviews were conducted by trained interviewers. The American Association of Public Opinion Research response rate 329 was 29.1% in 2009, 28.9% in 2010 and 22.1% in 2012.25 30 The response rates in 2003 could not be calculated comparably to those reported for the other surveys, but sample quality estimates showed that the sample bias according to key sociodemographic characteristics increased only slightly between 2003 and 2009 and remained constant thereafter.30 Weighting factors were used to adjust for unequal sampling probabilities and survey non-response by age, sex, region of residency and education using official German demographic data to improve the representativeness of the samples. A detailed analysis of the non-participants of the 2003 telephone survey showed that the most important reason for not participating was time restriction. The second most important reason was a general refusal to participate in surveys. Non-participants were slightly more often women, were older and had slightly more often another country of birth than Germany.31 Further details on design and response have been reported elsewhere.25 32 For this study, only members of the adult population aged 25–69 years were included into the analysis (2003: n=6890, 2009: n=16 418, 2010: n=17 145, 2012: n=13 744). This restriction was imposed to ensure comparability to the national health monitoring system and to other results from previous trend analyses.19 30 33 34 In addition, a considerable proportion of those aged <25 years might not yet have reached their full educational attainment, one of our two measures of SEP.
Measures
Self-rated health
In this analysis, the outcome variable (SRH) was assessed using the question, “In general, would you say your health is very good, good, moderate, poor, or very poor?” as recommended in the literature.35–38 We then dichotomised the SRH measure into ‘good SRH’ (‘very good’ and ‘good’) and ‘poor SRH’ (‘moderate’, ‘poor’ and ‘very poor’) to address data scarcity in the more extreme groups (eg, the youngest age group and very poor SRH) and to improve comparability to previous findings. SRH is one of the most frequently used health measures in public health and social epidemiology.35 Its predictive value for mortality and health services use is well established and has been confirmed by several studies in different populations.39–43
Education
To assess their level of educational attainment, participants were asked their highest levels of schooling and professional training. We used the Comparative Analysis of Social Mobility in Industrial Nations (CASMIN) classification scheme44 to distinguish three levels of educational attainment: low (CASMIN 1: primary/lower secondary education), medium (CASMIN 2: intermediate/higher secondary education) and high (CASMIN 3: tertiary education).
Income
We used equivalised net disposable household income as the other indicator of SEP in this analysis. The modified equivalence scale45 provided by the Organisation for Economic Co-operation and Development (OECD) was used to calculate equivalised household income. Income item non-response was handled with regression-based imputation of the missing values using the participant’s values for age, education, occupation and mean income of the area of residency.46 47 We then grouped and recoded the income variable: the first quintile was designated as the ‘low income’ group; the second, third and fourth quintiles as the ‘medium income’ group and the fifth quintile as the ‘high income’ group.
Measures of health inequality
The exclusive use of either absolute or relative measures of health inequality can have a crucial impact on the conclusions drawn from the results. This is particularly the case if the focus lies on the temporal dynamics of those inequalities. For instance, research has shown that relative inequalities might increase while absolute inequalities remain stable or even decrease over time.48–51 We therefore constantly and simultaneously used absolute and relative measures of health inequality throughout the analysis. The most frequently used measures of inequalities are still simple measures (eg, ORs, prevalence differences), which are most commonly pairwise comparisons between two socioeconomic groups, usually the most disparate categories of a given socioeconomic scale. The problem with these measures is that they do not account for the information of other socioeconomic groups besides the two compared, and they do not consider the size of each group. That is a particular concern when comparing populations at different time points, as the population share of socioeconomic groups might change over time. We estimated the slope index of inequality (SII) and relative index of inequality (RII) as summary measures of absolute and relative health inequality, respectively.52 53 SII and RII can be interpreted as the change in health by moving from the highest to the lowest socioeconomic group while accounting for the entire socioeconomic distribution in its estimation. That means that SII can be interpreted as the difference in health status between a hypothetical person at the bottom and top of the socioeconomic distribution, whereas RII can be interpreted accordingly as the ratio of health status of those at the bottom to that of those at the top of the socioeconomic distribution.
Statistical analysis
We estimated the crude prevalence of poor SRH for each survey year, stratified by sex, age, income and education group. Crude prevalence differences within the subgroups were assessed using χ2 tests for proportions. To account for the changing demographics of the different sample populations over time and to adjust for the different age and sex distributions within the income and education groups, we calculated the age and sex-standardised prevalence of poor SRH stratified by education and income group. The revised 2013 European Standard Population was used for standardisation.54 We assessed the time trends within each subgroup using the logistic regression method: the year variable was used as a continuous time variable with a range of 0–1 for the entire study period (2003–2012), coded as 0 for 2003, 0.667 for 2009, 0.778 for 2010 and 1 for 2012 to account for the different time periods between the surveys. We ran a logistic regression model to test for a linear effect of year on prevalence of poor SRH. The resulting p values (p trend) were used to assess the statistical significance of the linear trend over time for each population subgroup.
We estimated standardised prevalence differences (PDs) and ORs between the different income and education groups as simple measures of health inequality. Generalised linear models for binominal data with an identity link function (linear probability model) were used to estimate the standardised PDs, and generalised linear models for binominal data with a logistic link function were used to estimate the OR. These models were adjusted for sex, age and the interaction between sex and age (total population) or age (male and female population). We tested for linear trends over time by using the same models but including an interaction term between the continuous year variable and the categorical income or education variable while adjusting for sex, age and the interactions between sex and age, between sex and year and between age and year (total population) or adjusting for age and year and the interaction between age and year (male and female populations).
To estimate SII and RII, we first converted the ordered categorical income and education variables for the total, male and female populations to metric fractional rank variables ranging from 0 (highest) to 1 (lowest), as recommended in the literature.55 56 We then included the resulting variables (ridit scores) in linear probability models.30 56–58 The models to estimate the SII (RII) for the total population were adjusted for sex, age and the interaction between sex and age.56 The models for men and women were adjusted for age. We tested for a linear trend over time by adding an interaction term between the continuous year variable and the income or education ridit variable while adjusting for sex, age and the interactions between sex and age, between age and year and between sex and year (total population) or adjusting for age, year and the interaction between age and year (male and female populations).
Weighting factors were used to account for unequal sampling probabilities and to adjust the distribution of each sample by sex, age, education and region to match official German population statistics. All analyses were performed using the survey data functionality of STATA V.15.1 (StataCorp).
Patient and public involvement
Patients and the public were not involved in the design or planning of the study.
Results
Study population and descriptive statistics
Overall, 54 197 participants aged 25–69 years were included in the analysis. In total, 196 participants were subsequently excluded because of missing values: 45 (2003: 4, 2009: 20, 2010: 15, 2012: 6) had missing SRH values, 43 (2003) had missing income values and 108 had missing education values (2003: 33, 2009: 30, 2010: 23, 2012: 22). The sample characteristics are summarised in table 1.
Characteristics of the study population by survey year
Between 2003 and 2012, the proportion of the study population with a high educational level (CASMIN 3) increased, and the proportions with medium (CASMIN 2) and low (CASMIN 1) education decreased (table 1). The overall crude prevalence of poor SRH was constant over the study period but differed considerably by sex, age, education and income (table 2).
Crude prevalence of poor self-rated health for different subgroups of the study sample by survey year
Standardised prevalence of poor SRH
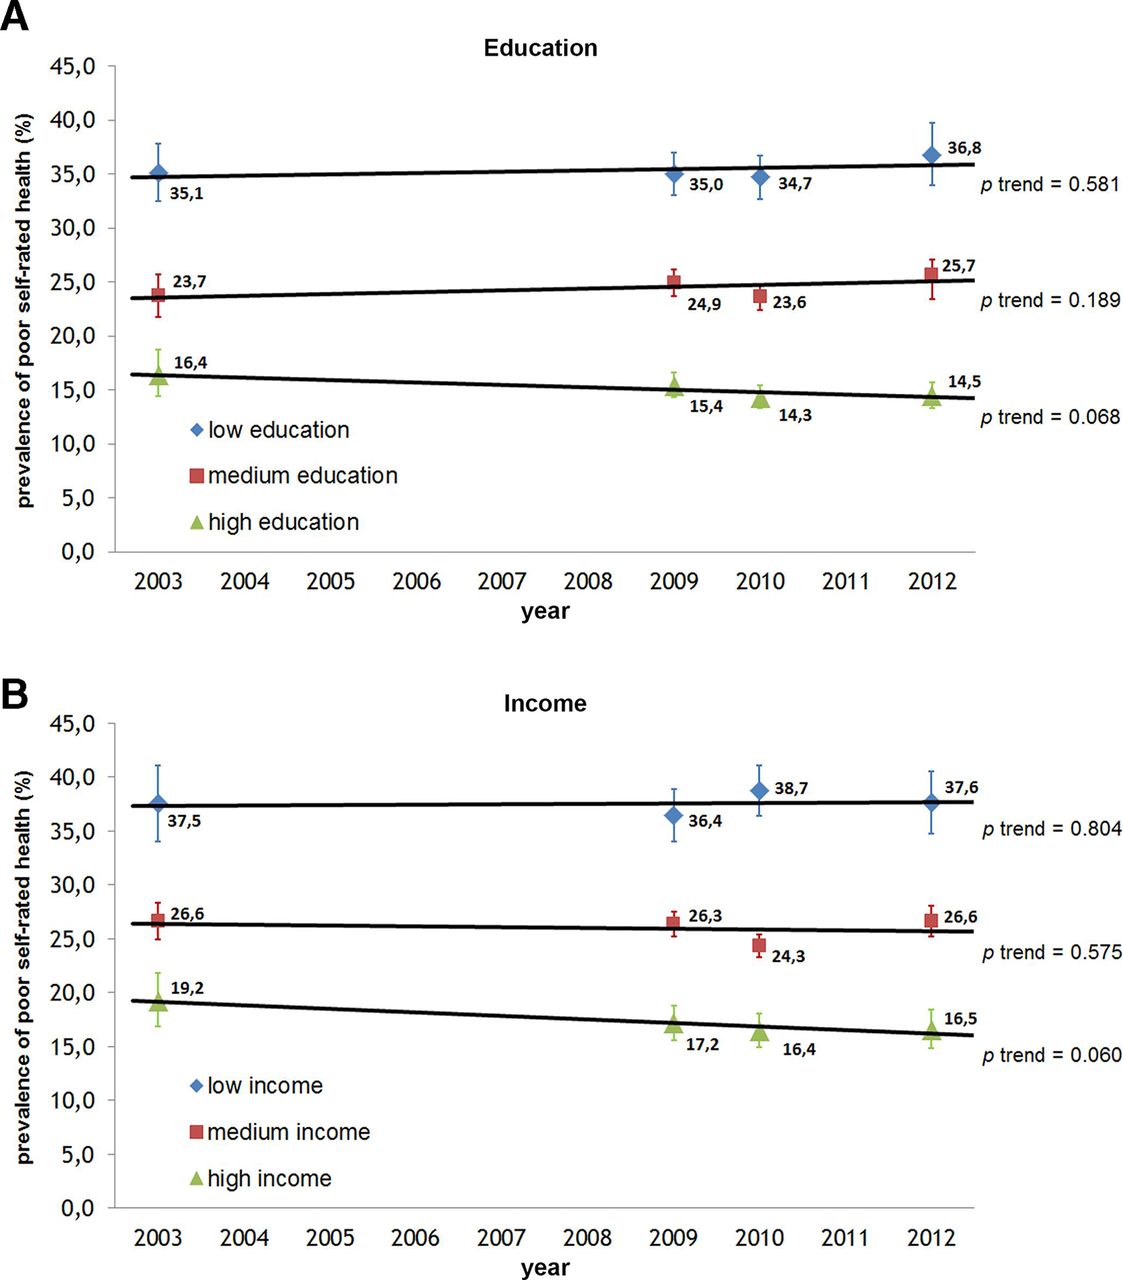
The total age and sex-standardised prevalence of poor SRH was 27.3% (95% CI 26.0% to 28.6%) in 2003 and 26.6% (95% CI 25.6% to 27.7%) in 2012, with no statistically significant evidence of a linear trend over time (p trend=0.288). The standardised prevalence of poor SRH differed considerably between income and educational groups, with a higher prevalence in lower SEP groups (figure 1).
Age and sex-standardised prevalence of poor self-rated health by (A) education and (B) income groups and survey year.
The age and sex-standardised prevalence of poor SRH was constant in the low and medium income and education groups but slightly decreased in the high status groups (see figure 1). There is weak evidence against the null hypothesis of there being no linear trend over time for the decrease in the high education (p trend=0.068) and high income (p trend=0.060) groups. The decrease in prevalence of poor SRH in the high status groups was more pronounced in the female than the male respondents: in men, the age-standardised prevalence was 14.2% (95% CI 11.9% to 16.7%) in 2003 and 13.1% (95% CI 11.7% to 14.7%) in 2012 in the high education group (p trend=0.476) and 19.1% (95% CI 16.0% to 22.6%) in 2003 and 17.9% (95% CI 15.4% to 20.5%) in 2012 in the high income group (p trend=0.337). In women, the standardised prevalence decreased over the same time period from 19.7% (95% CI 16.2% to 23.8%) to 16.1% (95% CI 14.4% to 18.1%) in the high education group (p trend=0.047) and from 19.3% (95% CI 15.8% to 23.2%) to 14.6% (95% CI 12.4% to 17.1%) in the high income group (p trend=0.078).
Absolute educational and income inequalities in poor SRH
Age and sex-standardised PD between the low and high education groups and income groups remained stable during the study period. For the total population, the standardised PD between the low and high education groups was 18.7% (95% CI 15.3% to 22.1%) in 2003 and 22.4% (95% CI 19.3% to 25.4%) in 2012 (p trend=0.146). The standardised PD between the low and high income groups was 18.3% (95% CI 15.3% to 22.1%) in 2003 and 21.1% (95% CI 17.7% to 24.5%) in 2012 (p trend=0.221).
In addition to the standardised PD as a simple measure of absolute inequality, we estimated the SII as a summary measure of absolute inequality for the total, male and female populations for each survey year for education and income. The SII for education and income remained largely stable between 2003 and 2012 in the total, male and female populations (table 3). The p values derived from the linear trend test indicate no significant evidence against the null hypothesis of there being no linear trend over time.
Absolute inequalities in poor self-rated health by education and income: SII for each survey year, stratified by sex
Relative income and educational inequalities in poor SRH
The OR for reporting poor SRH between the low and high education groups was 2.75 (95% CI 2.28 to 3.30) in 2003 and 3.49 (95% CI 3.00 to 4.07) in 2012 (p trend=0.083).The OR between the low and high income groups was 2.61 (95% CI 2.09 to 3.28) in 2003 and 3.15 (95% CI 2.62 to 3.79) in 2012 (p trend=0.143). In addition to these simple measures of inequality, we estimated the RII as summary measure of inequality. The RII for education and income in the total, female and male populations are shown in table 4.
Relative inequalities in poor self-rated health by education and income: RII for each survey year, stratified by sex
Relative inequalities (as measured by RII for education and income) were largely stable within the total, female and male populations throughout the study period. There is only suggestive evidence against the null hypothesis of there being no linear trend over time in income inequalities across the total population (p trend=0.051) and no evidence against the null hypothesis when stratified by sex or for trends of SRH according to educational inequalities (table 4).
Additionally, we treated SRH as a dichotomous outcome with different cut-offs as well as a continuous outcome to evaluate how this might change our results. We found that the observed absolute inequalities became smaller (SII (education) total: 2003: 0.07 (95% CI 0.05 to 0.10), 2009: 0.07 (95% CI 0.05 to 0.09), 2010: 0.07 (95% CI 0.05 to 0.09), 2012: 0.08 (95% CI 0.06 to 0.10), p trend=0.735) and relative inequalities became larger (RII (education) total: 2003: 3.34 (95% CI 2.15 to 5.19), 2009: 3.17 (95% CI 2.33 to 4.31), 3.47 (95% CI 2.56 to 4.69), 3.54 (95% CI 2.53 to 4.95), p trend=0.865) when using less than moderate SRH instead of less than good SRH as outcome with similar results for the test for a linear trend indicating no evidence against the null hypothesis of there being no linear trend over time. The overall prevalence of reporting less than moderate health was 5.9% (95% CI 5.6% to 6.2%) and was stable over the observation period. When good or very good SRH was used as outcome, a reversal of the association between SEP and SRH was seen as expected. When treating SRH as continuous outcome, the association between SEP and SRH stayed similar with there being no evidence against the null hypothesis of there being no linear trend over time. In conclusion, this sensitivity analysis indicates that we calculated robust estimates of time trends in socioeconomic inequalities in SRH.
Discussion
This study investigated the extent and dynamics of socioeconomic inequalities in SRH in Germany between 2003 and 2012. We found considerable income and educational inequalities in SRH in the German adult population (aged 25–69 years) in each survey year, with those in higher SEP in better health than those in lower SEP. The difference in the prevalence of poor SRH (as measured by SII) was more than 20 percentage points in every survey year and participants in low SEP had more than twice the odds of reporting poor SRH. The dynamics in terms of inequalities were mainly driven by decreasing prevalence of poor SRH in groups of high SEP, whereas the prevalence of poor SRH was mainly constant in the low and medium status groups. However, the observed dynamics over time were not significant at a 5% level, and no clear linear trend over time was found. In summary, there were considerable and stable absolute and relative inequalities in SRH in the German adult population in every survey year between 2003 and 2012.
Comparison with previous research
The results of this analysis are consistent with previous studies that described persistent inequalities in Germany and other European high-income countries after the year 2000: Moor et al 18 reported constant educational inequalities in SRH in the middle-aged population of Germany between 1994 and 2014 using data from GSOEP, whereas Lampert et al 19 found stable educational inequalities but increasing income inequalities between 1994 and 2014, also using data from the GSOEP. In contrast to other studies that used this data source,19 20 our results only weakly suggest increasing income inequalities in SRH. On an international level, our results are in line with the findings of Hu et al 21 who reported persisting but on average stable absolute and relative educational inequalities in 17 European countries between 1990 and 2010. In contrast, Leão et al 22 reported increasing absolute educational inequalities in ‘Bismarckian welfare regimes’ including Germany between 2005 and 2014. However, these results are not directly comparable to our findings, as they were based on a pooled analysis of different countries with similar welfare regimes. Furthermore, Leão et al dichotomised SRH but used only ‘bad’ and ‘very bad’ as poor SRH, in contrast to our measure of less than good SRH including the middle category of ‘moderate’ SRH. The same applies to the contrasting results reported by Mackenbach et al,23 who found a continuing trend of declining prevalence of poor SRH across all educational groups with increasing relative inequalities in a pooled analysis of 27 European countries.
This study complements the few previous findings on trends in socioeconomic inequalities in health in Germany by using a cross-sectional and representative data source not previously used for analysing trends in SRH. It offers an accurate estimate of the extent and dynamics of socioeconomic health inequalities through consistent use of summary measures of absolute and relative inequalities, which prevents biassed judgements about health inequality trends from selective reporting of inequality measures.59 It focuses on a period of particular interest for social epidemiology, as it includes the 2003–2005 reforms of the German welfare state and the 2008 global financial crisis. Contrary to our initial assumption, these historical events do not seem to have affected the socioeconomic inequalities in SRH significantly, at least in the short-term to midterm period until 2012. This may reflect the fact that Germany (in contrast to other European countries) did not experience a prolonged economic recession after the financial crisis but recovered swiftly and then rapidly achieved record export numbers and decreasing unemployment rates.60 Interestingly, we found that the standardised prevalence of poor SRH decreased in the high income and education groups but was stable in the low and medium status groups. This might reflect the findings that those in higher status groups tend to adopt healthier behaviours earlier than those in lower status groups, as previously shown for example, for smoking and physical activity.30 33 Another explanation might be that reporting behaviours changed specifically and in different ways for different socioeconomic groups with those in higher SEP more likely to report good or very good subjective health. Further research is needed to explain these trends more precisely.
Strengths and limitations of this study
The strengths of this study include the large sample size and the high representativeness of the data source and hence the generalisability of our results to the German adult population. In addition, we enhanced the accuracy of the estimates of the extent and dynamics of inequalities by consistent and simultaneous use of summary measures of both absolute and relative health inequalities. However, some possible limitations should be considered when interpreting the results. The cross-sectional survey data we used for this analysis might be prone to selection bias. Unit non-response and restricting the study population to those living in private households, reachable by landline telephone and with sufficient German language proficiency might have introduced selection and coverage bias. Migrant populations and ethnic minority groups were under-represented in the surveys. Furthermore, the study design did not allow more detailed analyses of the impact of for example, ethnicity on the observed socioeconomic inequalities. This is particularly a concern when SRH is regarded as a proxy of objective health. There is an ongoing debate around the possibly varying significance and predictive value of SRH for different social groups, particularly regarding gender,61–63 age,64 ethnicity65 66 and socioeconomic position.67–74 Most of the literature on socioeconomic differentials in reporting SRH suggests that the underlying socioeconomic inequalities in objective health might be underestimated by using SRH as health outcome.67 75 Our study might hence give conservative estimates of the existing health inequalities in Germany’s adult population. Despite the repeated cross-sectional design with two-stage random sampling, the national representativeness is limited to the following characteristics: age, sex, region of residence and education as the weighting factors used to analyse the data were based on those characteristics. Furthermore, item non-response (particularly on the income item) may be a reason for concern, as it might have introduced bias. Generally, those not responding to income questions tend to be more homogeneous in several characteristics than responders.76 Simply excluding those with income non-response from the analysis thus might introduce bias that would most probably lead to an underestimation of socioeconomic inequalities. We therefore used regression-based imputation to mitigate this bias.47 The proportion of imputed values was largely constant over the study period, and the method of imputation was the same across all surveys. Another limitation is the relatively short study period of one decade. Although welfare reforms were implemented and social change progressed in Germany between 2003 and 2012, the period of one decade may have been too short to detect significant changes in the extent of socioeconomic inequalities in SRH. Future studies focusing on trends in health inequalities over time should therefore include longer periods of observation.
Conclusions
In conclusion, we found considerable and persisting educational and income inequalities in SRH in the German adult population between 2003 and 2012. Although these dynamics were not statistically significant, we observed persisting high levels of poor SRH in lower status groups and slightly decreasing poor SRH in higher status groups. These findings should be a concern for both public health professionals and political decision makers. Further research is needed to reassess our results and expand the focus to the time after 2012. Moreover, the underlying causal pathways must be better understood to develop qualified and targeted political interventions to tackle health inequalities sustainably.
Acknowledgments
We would like to thank all the study participants and all the employees of the Robert Koch Institute who helped to conduct the surveys that underlie this analysis. We thank Richard Lipkin, PhD, from Edanz Group (http://www.edanzediting.com/ac http://www.edanzediting.com/ac) for editing a draft of this manuscript.
References
Footnotes
Contributors BW designed the analysis, conducted the statistical analyses and wrote the first draft of this article. JH contributed to the statistical analysis and revised the manuscript. TL supervised the study and revised the manuscript. All authors approved the final version of the manuscript.
Funding The authors have not declared a specific grant for this research from any funding agency in the public, commercial or not-for-profit sectors.
Competing interests None declared.
Patient consent for publication Not required.
Provenance and peer review Not commissioned; externally peer reviewed.
Data availability statement Data are available upon reasonable request.