Article Text

Abstract
Objective To assess job satisfaction for different categories of Norwegian doctors from 2010 to 2016–2017.
Design Cross-sectional surveys in 2010, 2012, 2014 and 2016–2017 of partly overlapping samples.
Setting Norway from 2010 to 2016–2017.
Participants Doctors working in different job positions (hospital doctors, general practitioners (GPs), private practice specialists, doctors in academia). Response rates were 67% (1014/1520) in 2010, 71% (1279/1792) in 2012, 75% (1158/1545) in 2014 and 73% (1604/2195) in 2016–2017. The same 548 doctors responded at all four points in time.
Main outcome measure Job Satisfaction Scale (JSS), a 10-item widely used instrument, with scores ranging from 1 (low satisfaction) to 7 (high satisfaction) for each item, and an unweighted mean total sum score.
Analysis General Linear Modelling, controlling for gender and age, and paired t-tests.
Results For all doctors, the mean scores of JSS decreased significantly from 5.52 (95% CI 5.42 to 5.61) in 2010 to 5.30 (5.22 to 5.38) in 2016–2017. The decrease was significant for GPs (5.54, 5.43 to 5.65 vs 5.17, 5.07 to 5.28) and hospital doctors (5.14, 5.07 to 5.21 vs 5.00, 4.94 to 5.06). Private practice specialists were most satisfied, followed by GPs and hospital doctors. The difference between the GPs and the private practice specialists increased over time.
Conclusions From 2010 to 2016–2017 job satisfaction for Norwegian doctors decreased, but it was still at a relatively high level. Several healthcare reforms and regulations over the last decade and changes in the professional culture may explain some of the reduced satisfaction.
- job satisfaction
- doctors
- Norway
- repeated surveys
This is an open access article distributed in accordance with the Creative Commons Attribution Non Commercial (CC BY-NC 4.0) license, which permits others to distribute, remix, adapt, build upon this work non-commercially, and license their derivative works on different terms, provided the original work is properly cited, appropriate credit is given, any changes made indicated, and the use is non-commercial. See: http://creativecommons.org/licenses/by-nc/4.0/.
Statistics from Altmetric.com
Strengths and limitations of this study
The surveys had high response rates.
The data allowed for generalisation to the whole doctor workforce in Norway.
There were similarities in survey methods and measurements at all four points in time.
The 10-item version of the Warr-Cook-Wall scale for job satisfaction was specifically modified for GPs in the UK, but it has been used extensively in doctor populations both in Norway and elsewhere.
Analyses were based on self-reported questionnaire data with the possibility of both overestimation and underestimation.
Introduction
Job satisfaction is important both for individual employees and organisations. It is linked to employees’ productivity,1 absenteeism,2 turnover,3 physical and mental health and well-being.3–6
For doctors, wellness is crucial to the delivery of good healthcare and has been identified as a missing quality indicator.7 Satisfaction is a substantial element of professional wellness and has as such become a key performance indicator in quality systems.8 While a high level of job satisfaction is associated with positive outcomes, doctors’ job discontent may become a threat to the quality of patient care and safety, on an individual as well as on a system level.9–14
Doctors’ job satisfaction is related to work load, healthcare organisation and management, professional autonomy, the ability to provide high quality healthcare and financial systems including personal income.14–19
Two important reforms were introduced in Norway at the beginning of the 21st century: ‘The Regular General Practitioners Scheme’ in 2001 and ‘The Hospital Reform’ in 2002. The Regular General Practitioners Scheme introduced a list-patient system whereby all inhabitants in Norway have their assigned general practitioner. This reform aimed at enhancing access to general practitioners and continuity in the patient-doctor relationship. The implementation of the list-patient system has modified the structure of GPs’ remuneration into a combination of three sources: capitation based payment from the local government, fee-for-service payment from the National Insurance System (NAV: Ny arbeids- og velferdsforvaltning) and out-of-pocket payments from patients. The Hospital Reform transferred the ownership of hospitals and specialist health services from the county to the state level, organised through central and local health enterprises.
Previous studies showed that the satisfaction level among doctors in Norway was stable and high from 1994 to 200220 and even increased from 2000 to 2006.21 General practitioners and private practice specialists were generally more satisfied than hospital doctors.21 22 The above mentioned comprehensive reforms did not have any detectable positive or negative impact on the job satisfaction of neither hospital doctors nor GPs,21 as opposed to an international negative trend.23–27 The satisfaction level of doctors in Norway was higher than in comparable countries like Germany,28 29 Iceland30 and the USA.19
Three new organisational reforms have also been introduced in Norwegian healthcare over the last decade. ‘The Coordination Reform’ from 2012 intended to improve the collaboration between specialist (secondary) and municipal (primary) healthcare levels by placing more responsibility for individual patients on the local community. This has resulted in an increased workload on the general practitioners,31 32 which so far has not been compensated by a corresponding strengthening in resources and staffing.33 ‘The Free Choice of Hospital Reform’ in 2015 gave the users a free choice of hospital,34 and the white paper on ‘The Future Primary Care—Proximity and Comprehensiveness’ in 2015 was implemented to improve user involvement, availability, prevention, proactivity and collaboration between multidisciplinary teams.35 Recent surveys on hospital doctors’ and GP’ working conditions documented high workload and considerable growth in work demand.36 37 The impact of the latest reforms on doctors’ job satisfaction has so far been insufficiently explored.
There are several instruments to measure job satisfaction, including single items and multi-item scales.6 38 39 A widely used instrument in healthcare settings is the ten item version40 of the Warr-Cook-Wall Job Satisfaction Scale (JSS),6 assessing both total job satisfaction and satisfaction with different aspects of the job.19–21 26 28–30 40–42 It also allows for good national and international comparisons.
This paper reports the development of job satisfaction among Norwegian doctors from 2010 to 2016–2017 with special emphasis on general practitioners and a possible effect of the latest reforms.
Materials and methods
Design and participants
Since 1994, the Institute for Studies of the Medical Profession (Legeforskningsinstituttet (LEFO), www.legeforsk.org) has regularly surveyed a representative panel of active Norwegian doctors biannually with postal questionnaires. The original panel was based on an invitation to 2000 randomly selected active Norwegian doctors in 1993. The 1272 doctors who agreed to participate were representative of the total doctor work force in terms of age, sex, specialty and place of work. Since then approximately 540 doctors have left the panel due to retirement, death or voluntary withdrawal. Therefore, the panel was supplemented with approximately 400 young doctors in 2000, 250 young doctors in 2008, 300 in 2012 and 650 doctors in 2016–2017, maintaining the representativity.43 44 With this in and out pattern, our cohort constitutes what may be called an unbalanced cohort.
This article is based on data from 2010, 2012, 2014 (partly in 2015) and 2016 (partly in 2017).
Inclusion and exclusion criteria
Since interns were only identified in data from 2016-2017, this category is excluded in this paper.
Dependent variables
Total job satisfaction and satisfaction with different aspects of the job were measured with the ten item version40 of the ‘Job Satisfaction Scale’ by Warr, Cook and Wall.6
The original scale included one item assessing the overall satisfaction and fifteen items assessing two factors related to job satisfaction, the intrinsic factor (seven items on attitudes towards personal achievement and task success: freedom to choose your own method of working, recognition you get for good work, the amount of responsibility you are given, your opportunity to use your abilities, your chance of promotion, the attention payed to suggestions you make, the amount of variety in your job) and extrinsic factor (eight items on attitudes on working conditions: physical working conditions, your fellow workers, your immediate boss, your rate of pay, industrial relations between management and workers in your firm, the way your firm is managed, your hours of work, your job security). The total job satisfaction was calculated as the sum of all separate items. The scale was tested for validity and reliability in blue-collar male workers employed full-time in a manufacture industry in the UK.6
The 10-item form of the original scale was devised by Cooper-Rout-Faragher in 1989 to study job satisfaction, mental health and stress among general practitioners in England. Five items were removed from the original scale that were not relevant for the general practitioners population: ‘your immediate boss’, ‘industrial relations between management and workers in your firm’, ‘your chance of promotion’, ‘the way your firm is managed’ and ‘your job security’. The scale was not tested for validity and reliability by Cooper, Rout and Faragher.40 A validation study of this scale was done in a cohort of Australian clinical medical workforce by Hills, Joyce and Humphries in 2012, where the original seven point Likert scale was reduced to five point Likert scale from 0 (very dissatisfied) to 4 (very satisfied). Factor analytic and internal reliability tests did not support differentiating intrinsic and extrinsic factors. They supported the use of the ten item instrument as a single-factor scale and the use of a composite job satisfaction score.45
The 10-item version40 of the original Warr-Cook-Wall questionnaire with seven point Likert scale6 was used extensively in doctors population in Norway and elsewhere.19–22 26 28–30 41 42 We applied this instrument in our study to allow comparisons across countries and over time. The 10 items were:
How satisfied are you with:
The amount of responsibility you are given.
Variation of work.
Your colleagues and fellow workers.
Your physical work conditions.
Your opportunities to use your skills.
Your overall job situation.
The freedom to choose your own methods of working.
The recognition you get for good achievements.
Your rate of pay.
Your work hours.
We asked the doctors to score each of the 10-items on a 7-point Likert scale from 1 (very dissatisfied) to 7 (very satisfied). An unweighted mean sum score was calculated, as well as analyses of single items.
Independent variables
There are several possible job positions for doctors in Norway. For the purpose of this study, they are collapsed into the following seven categories:
Doctors in hospital: doctors in management positions (medical superintendent, head of department, chief senior consultant, head of unit, senior consultant, head of section), senior hospital consultants and specialty registrars.
General practitioners.
Specialists working in private practice.
Doctors in academia: professor, associate professor, research fellow and researcher.
Community medical officers: district medical officer, senior district medical officer, nursing home medical officer, visiting medical officer, doctor at infant welfare clinic, community general practitioner.
Doctors in administrative positions: county medical officer, medical advisor, chief medical officer.
Other job categories.
Other independent variables were gender and age.
Analyses
The distribution of JSS was close to normal (Kolmogorov-Smirnov test 0.56, p<0.001) with a slightly negative skewness (−0.62). Thus the use of parametric tests was unproblematic. General Linear Modelling controlled for gender and age was used to estimate the means of job satisfaction at the four points in time: 2010, 2012, 2014 and 2016–2017. Statistically significant differences were assumed when the 95% CIs were not overlapping.
Paired t-tests were used to show individual differences between two points in time.
Three different samples were analysed. The first consisted of all respondents at all times, the unbalanced cohort. Here respondents with missing data on gender or age or all JSS items were excluded. The second sample comprised doctors with defined job positions in one of four categories: GPs, specialists in private practice, hospital doctors and doctors in academia in minimum one survey. The third, longitudinal sample were the doctors who responded at all four points in time. A subsample here were the doctors who did not change job position during the observational period.
Predictive Analytics Software Statistics V.25 was used for the analyses.
Patient and public involvement
No patients were involved in setting the research questions or the outcome measures, nor were they involved in the design and implementation of the study. There are no plans to involve patients in dissemination.
Results
Respondents
Table 1 shows the sample, number of respondents, response rates and the makeup of job positions for which we have data on JSS, gender and age: 948 in 2010, 1164 in 2012, 1057 in 2014 and 1290 in 2016–2017. The majority of respondents worked in hospitals.
Sample, number of respondents, response rates and the makeup of job categories for respondents where we have data on job satisfaction, gender and age
The proportion of females increased from 37.4% (95 % CI 34.3% to 40.5%) in 2010, to 43.4% (40.6% to 46.3%) in 2012, was 42.5% (39.5% to 45.5%) in 2014 and increased further to 52.9% (50.3% to 55.5%) in 2016–2017. The mean age was 50.7 (95% CI 49.9 to 51.6) years in 2010, 49.7 (48.9 to 50.4) years in 2012, 50.5 (49.7 to 51.3) years in 2014 and 47.7 (46.9 to 48.4) years in 2016–2017.
The representativity of the data for 2010, 2012 and 2014 is described elsewhere.44 Data for 2016–2017 are comparable with the Norwegian doctor workforce in 2016–2017 regarding age, but with a slightly higher percentage of females, and doctors in academia (data not shown). The distribution of doctors in different job positions are comparable over the study period (table 1).
548 doctors responded at all four time points, 202 (37%) females. Mean age in 2010 was 48.1 years. 64.8% (355/548) were stable in their jobs over the period: 233 hospital doctors, 94 GPs, 22 private practice specialists and six doctors in academia. Due to the low number of doctors in academia (n=6), this group is excluded in some of the analyses.
Changes in job satisfaction
All doctors
The estimated mean of job satisfaction, controlled for gender, age and job position for all respondents in 2016–2017, was 5.30, (95% CI 5.22 to 5.38), which is significantly lower than in 2010 (5.52, 5.42 to 5.61), and non-significantly different from 2012 (5.45, 5.37 to 5.54) and 2014 (5.44, 5.35 to 5.53).
Doctors in different job positions
Over the whole period, the mean score of job satisfaction decreased for GPs and for hospital doctors. Private practice specialists were the most satisfied, while hospital doctors were least satisfied. No differences were found between GPs and doctors in academia. Job satisfaction generally increased from 2012 to 2014 and decreased from 2014 to 2016–2017 for GPs, private practice specialists and hospital doctors. In 2016–2017, GPs reported significantly higher satisfaction than hospital doctors, and significantly lower satisfaction than private practice specialists(figure 1).

General Linear Modelling estimated means of job satisfaction (scored from 1 to 7) controlled for age and gender among doctors in different job positions in 2010, 2012, 2014 and 2016–2017 (the unbalanced cohort).
From 2010 to 2016–2017 there was a non-significant change in JSS for other job positions such as community medical officers (5.59, 95% CI 5.26 to 5.91 vs 5.33, 5.10 to 5.56), doctors in administration (5.75, 5.38 to 6.12 vs 5.39, 5.08 to 5.71) and doctors in other positions (5.61, 5.32 to 5.89 vs 5.23, 4.99 to 5.46).
Effect of age, gender and specialty on estimated means of JSS
There were no gender differences. JSS increased with increasing age. Among hospital doctors, JSS did not vary significantly over time across medical specialties (data not shown).
Changes in JSS in the longitudinal sample
All doctors
Using paired sample t-tests, JSS scores were found to change non-significantly from 2010 to 2012 (5.30 vs 5.34; t=1.43; p=0.152), to increase significantly from 2012 to 2014 (5.34 vs 5.41; t=2.19; p=0.029) and then to decrease significantly from 2014 to 2016–2017 (5.41 vs 5.34; t=−2.03; p=0.043).
Hospital doctors, GPs and private practice specialists
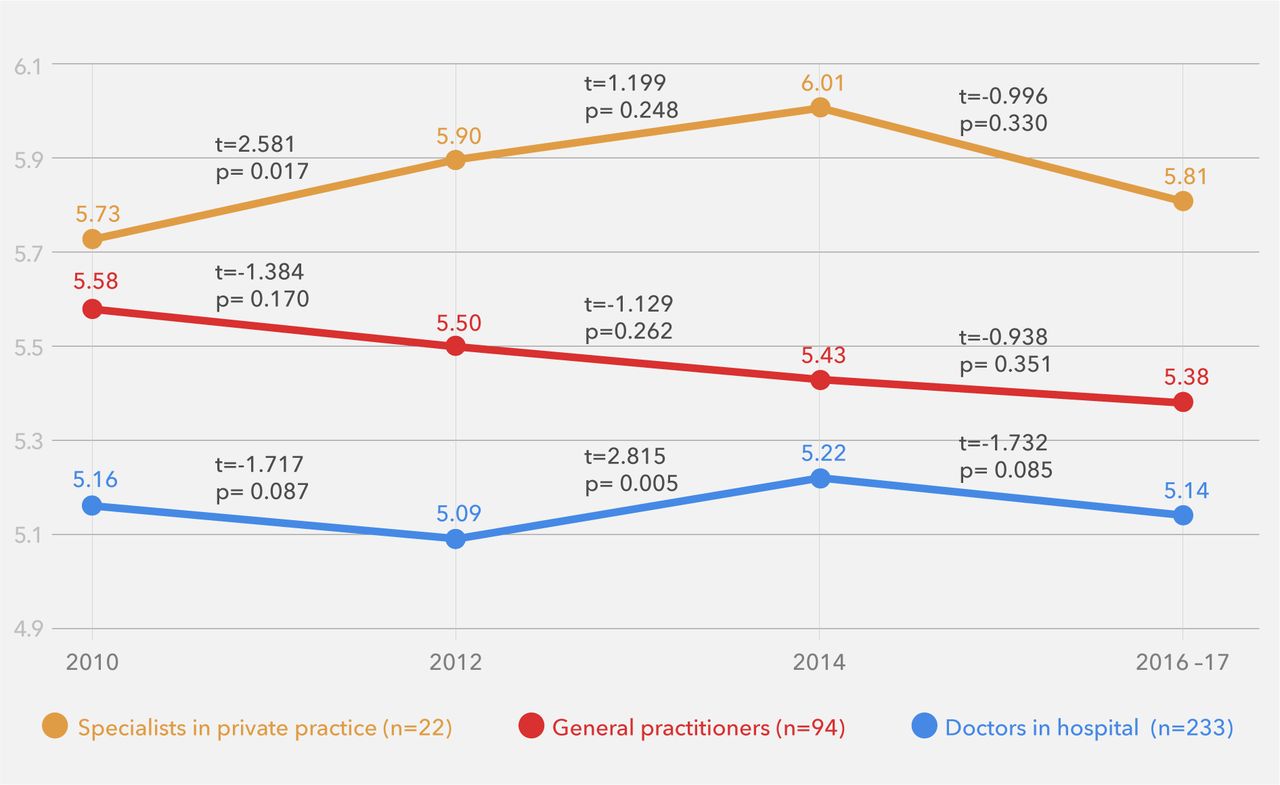
From 2010 to 2016–2017 in the longitudinal subsample, the JSS scores for GPs decreased steadily. A significant increase in JSS scores was found for specialists in private practice from 2010 to 2012, and for hospital doctors from 2012 to 2014. For all three job positions, there was a non-significant decline in JSS from 2014 to 2016–2017. At any point in time, private practice specialists were the most satisfied. GPs were more satisfied than hospital doctors, but the difference between these groups decreased (figure 2).

General Linear Modelling estimated means of job satisfaction (scored from 1 to 7) controlled for age and gender among doctors in different job positions in 2010, 2012, 2014 and 2016-2017 with paired t-tests (the longitudinal subsample).
Changes on the item level
For GPs and doctors in hospital, the item scores on ‘freedom to choose methods’, ‘recognition for good work’, ‘rate of pay’ and ‘work hours’ decreased significantly from 2010 to 2016–2017. Also, GPs reported significantly lower scores for ‘amount of responsibility’ and ‘overall job satisfaction’. No significant changes on the item level were found for private practice specialists and for doctors in academia (table 2).
General Linear Modelling on estimated means, controlled for gender and age, of the 10 job satisfaction scale items (each scored from 1 to 7) among doctors in different type of work in the unbalanced cohort in 2010 and 2016–2017
The same pattern was found in the longitudinal subsample for GPs and hospital doctors, although not statistically significant (table 3).
General Linear Modelling on estimated means, controlled for gender and age, of the ten JSS items (each scored from 1 to 7) among doctors in different type of work in the longitudinal subsample in 2010 and 2016–2017
Discussion
Main findings
From 2010 to 2016–2017, job satisfaction for all doctors decreased significantly. The decrease was statistically significant for GPs and for hospital doctors. Private practice specialists were most satisfied, followed by GPs and hospital doctors. The difference between the GPs and the private practice specialist increased over time . Of the ten JSS items, scores on ‘working hours’, ‘payment’, ‘recognition for good work’ and ‘freedom to choose methods of work’ declined significantly, both among GPs and hospital doctors, while no significant changes were found for specialists in private practice and doctors in academia (table 2, figure 1). In the longitudinal subsample, there was a non-significant decline in JSS for GPs, hospital doctors and private practice specialists from 2014 to 2016–2017 (figure 2).
Comparison with other studies
Differences in methodology limit direct comparisons with other studies. However, it is possible to point out some international trends in job satisfaction; older doctors report higher job satisfaction, and there are no gender differences.20 22 29 41 Age changes in satisfaction are related to the lowered expectations over time, higher remuneration, higher perceived autonomy and more experience.21 46 47
In Norway, job satisfaction was stable and high from 1994 to 2002,20 increased from 2000 to 2006,21 and decreased from 2010 to 2016–2017. However, it was still at a relatively high level in 2016–2017, higher than in 2000, 2002, 2004 and lower than in 2006.20 Longitudinal studies on doctors’ job satisfaction are few and show a mixed pattern. A study on doctors’ intention to work in the UK suggested a decrease in their satisfaction. The fraction of UK-trained doctors who would ‘probably not’ or ‘definitely not’ practice medicine in the UK increased from 8% in 1996–2011 to 15% in 2015.23 Decreasing professional satisfaction was also described among doctors in the USA.24 On the other hand, increased satisfaction with work has been reported from doctors in the Netherlands from 2000 to 200948 and from six graduation cohorts from 1996 to 2012 in the UK.49 High levels of job satisfaction were documented from emergency medicine residents in the USA,50 family physicians in Canada,51 primary care physicians in Germany52 and doctors in Australia.53
Norwegian studies showed statistically significant higher job satisfaction for GPs than for hospital doctors from 2000 to 2006 and in 2008, and no significant differences between GPs and private practice specialist in 2008.21 22 In our study, job satisfaction decreased significantly for GPs and hospital doctors, but GPs continued with higher scores than their hospital colleagues. GPs and private practice specialists had similar levels of satisfaction in 2010, while the scores were significantly higher for private practice specialist in 2012, 2014 and 2016–2017 (figure 1 with table).
Decline in GP job satisfaction seems to be the rule all over the world. A Danish study showed that the proportion of GPs reporting dissatisfaction with work increased from 6% in 2012 to 22% in 2016. A significant increase in dissatisfaction was found for ‘working hours’, ‘rate of pay’, ‘freedom to choose methods’ and ‘recognition for good work’.26 The National GP Worklife Survey in the UK documented that satisfaction with ‘colleagues and fellow workers’ improved, while the other nine aspects of job declined from 2010 to 2017. The largest decreases were ‘working hours’, ‘rate of pay’ and ‘amount of responsibility’.25 The Medicine in Australia: Balancing Employment and Life Australia's national longitudinal survey of doctors (MABEL) also showed a decline from 2013 to 2015 in GP job satisfaction.27
According to a recent systematic review on satisfaction of doctors working in hospitals within the European Union based on studies from 2000 to 2017, hospital doctors had a moderate job satisfaction; 4.81 on a scale from 1 to 7.54 In our sample, hospital doctors reported higher levels of satisfaction: 5.14 in 2010 and 5.00 in 2016–2017.
In the Norwegian ‘Working environment and living conditions survey’ from 2010 to 2016, there were no changes in JSS as measured by a 5-point Likert scale from very dissatisfied to very satisfied. About 90% of the employees reported that they are ‘quite’ or ‘very satisfied’ with their job. In data from 2016, top managers (97%), farmers/fisherman (95%) or physiotherapists (95%) reported a higher level and nurses (89%), policemen (88%) or customer service occupations (82%) a lower level of satisfaction than the doctors (90%). JSS among employees did not differ between gender and it did increase with age.55
Explanation of results
Healthcare organisations and financial systems are constantly subject to change in most countries. Studies document that changes in the healthcare organisation may influence doctors’ work-life and professional satisfaction.14 56
As already mentioned, three major healthcare reforms have been implemented over the last decade in Norway: ‘The Coordination Reform’ in 2012,32 the ‘The Free Choice of Hospital Reform’ in 201534 and the white paper on ‘The Future Primary Care—Proximity and Comprehensiveness’ in 2015.35 These reforms are challenging for the doctors, and may explain some of the reduction in satisfaction. Studies showed that high professional autonomy yields better quality of healthcare and more doctor satisfaction.18 57 More time spent on direct patient care and less time spent on administrative tasks, and optimal economic conditions in general are also important positive contributors to job satisfaction.28 58 59 A study based on data from 1994 to 2014 showed that the total weekly working hours remained unchanged for most doctors in Norway, while time spent on direct patient care decreased, particularly for hospital doctors.44 Another study with data from 2018 documented long working weeks with a wide variety of tasks among GPs.60 Seventy per cent of doctors experienced stress in association with perpetual reorganisations of the national healthcare system, particularly hospital doctors.56 A recent survey on hospital doctors’ working conditions documented that hospital doctors scored high on items related to engagement at work, assessment of work as meaningful and cooperation with colleagues, but lower on items related to workload and professional autonomy (including openness, participation in decision making, dialogue with the hospital management).36 In another recent survey on GPs’ working conditions,37 GPs reported that they have a meaningful job with various interesting tasks. However, they also reported considerable growth both in work demand and in the cost of running their own medical office during the last decade. The high work demand was related to increased transfer of tasks that were previously conducted by outpatient clinics or hospitals, for example, follow-up care of pregnant women or patients with chronic diseases like cancer, rheumatic diseases, endocrinological disease, substance abuse or some mental health disorders. In addition, there were increases in consultations, laboratory services for appointment specialists, tasks related to preventive treatment and documentation as well as certification requirements.37 61
These findings fit well with our data where several aspects of satisfaction declined significantly. For GPs, the largest decrease was in ‘amount of responsibility given’ followed by ‘work hours’, ‘recognition for good clinical work’, ‘rate of pay’, ‘overall job satisfaction’ and ‘freedom to choose methods of work’. For hospital doctors, the decrease was largest in ‘freedom to choose methods of work’ followed by ‘rate of pay’, ‘recognition for good clinical work’ and ‘work hours’. The high job satisfaction of specialists in private practice probably reflects both professional and time-based autonomy and good economic conditions.
In the longitudinal subsample (the doctors who responded at all four points in time and did not change job position), there were no significant changes neither on the item level nor on estimated job satisfaction from 2010 to 2016–2017 (table 3). A common tendency for GPs, hospital doctors and private practice specialist was a non-significant decrease in job satisfaction from 2014 to 2016–2017 (figure 2). A possible reason for this stability in job satisfaction may be a combination of the adaption of healthcare regulations over time and the selection of doctors. The most satisfied doctors are more likely to remain in their current job position.
Changes in professional culture may also explain some of the reduced satisfaction. In a study among hospital doctors in Norway, many senior consultants talked about being a doctor as a major part of their identity and lifestyle, while the specialty registrars were more likely to regard their work as a job.62 In another study, most doctors were satisfied as doctors, but felt it challenging to combine the job with leisure activities and family life. Some senior consultants were of the opinion that specialty registrars were less willing to prioritise professional life and more concerned with their responsibilities outside of work.63
The slightly increasing trend in job satisfaction among all Norwegian doctors described from 2000 to 200621 did not continue from 2010 to 2016–2017. However, the job satisfaction level was still above 5 on a 1 to 7 scale. In surveys from 2018, GPs and hospital doctors described their work as meaningful in spite of considerable work overload.36 37 This suggests that job satisfaction is also based on internal values. To be in demand and to treat patients were also fundamental elements of doctor satisfaction.64
Strengths and limitations
The main strength of this study is that it allows for generalisation to the whole population of doctors in Norway. Similarities in survey methods and repeated measures over time is another advantage. Furthermore, the response rates were fairly good, ranging from 67% to 75%, which are higher than for other surveys of the medical profession, but do not rule out the possibility of non-response bias.44 It is possible that the doctors with a particularly heavy work burden and therefore a probable lower job satisfaction to a lesser degree than others responded to the questionnaire, leading to an overestimation of satisfaction level. On the other hand, doctors who are dissatisfied with their working conditions might to a larger degree want to express their opinion, which could lead to lower satisfaction scores. A study based on two cross-sectional surveys among English GPs from 2004 and 2005 supported an association between response and satisfaction, respectively less satisfied GPs were more likely to response.65 However, our follow-up of the unbalanced cohort showed changes in the partly overlapping samples of doctors over time, which give us valid data of changes in satisfaction. When it comes to measuring subjective satisfaction, there is in general no alternative to survey individuals in a random sample.66 We do not know whether there is a tendency in our sample towards over- or underestimation of the satisfaction levels with various components of working conditions, or whether there are job-category or medical-discipline-specific differences in the self-reporting. Again, an unbalanced cohort design with follow-up of the partly overlapping sample of doctors, gives us robust data of changes in satisfaction. Another concern is that there is no gold standard of measuring doctors’ job satisfaction with a global, check-list based measure.39 The ten item Warr-Cook-Wall scale for job satisfaction was specifically designed for GPs in solo practice in the UK,6 40 but it has been used extensively to describe total job satisfaction and satisfaction of different level of work in doctor populations both in Norway and elsewhere.19–22 28–30 42 The validation of this ten item JSS in a cohort of Australian medical practitioners provided validity evidence for a single-factor solution and for a use of a composite job satisfaction score. However, it was suggested to include other job-specific items in the scale, especially for doctors having employee status or working in organisational settings.45 Because job satisfaction varies with personality,67 well-being,7 8 mental and physical health status,3–5 40 it is also important to include these co-variates in future analyses.
Conclusion
Job satisfaction for Norwegian doctors remained relatively high, but with a downward trend over the last eight years, where the decrease was statistically significant for GPs and hospital doctors. Private practice specialists were most satisfied, followed by GPs and hospital doctors. The difference between the GPs and the private practice specialists increased over time. While no significant changes were found in the ten JSS items for private practice specialists and doctors in academia, satisfaction with ‘working hours’, ‘payment’, ‘recognition for good work’ and ‘freedom to choose methods of work’ declined significantly both among GPs and hospital doctors. Several healthcare reforms and regulations over the last decade and changes in the professional culture may explain some of the reduced satisfaction.
Future research and policy implications
Variations in job satisfaction across job positions call for more separate analyses in the future. The importance of a good professional climate is emphasised in both Norwegian and European working conditions legislature.68 69 High job satisfaction among doctors is important. It has been found to relate positively to doctors well-being and quality of healthcare.9–14 In addition, job satisfaction is an important factor for career decisions like staying in or leaving a current job position.3 70 Low recruitment to primary care is a concurrent issue in media,71 health administration72 and research,33 73 therefore better job satisfaction is important. This could be achieved through regulation of working hours, improvement of recognition for medical work regarding payment and feedback for good work.
Acknowledgments
The authors wish to thank all doctors who have supported this study by participating in the survey.
References
Footnotes
Contributors JR, OGA and MN designed the study. JR undertook the literature review, did the statistical analysis and wrote the first draft. OGA and MN made critical revisions. All authors had full access to all of the data (including statistical reports and tables) and are jointly responsible for the integrity of the data and the accuracy of the data analysis.
Funding The authors have not declared a specific grant for this research from any funding agency in the public, commercial or not-for-profit sectors.
Competing interests None declared.
Patient consent for publication Not required.
Ethics approval According to the Regional Committee for Medical Research Ethics, the study based on “Norwegian Physician Survey - A bi-annual prospective questionnaire survey to a representative sample of Norwegian physicians” is exempt from review in Norway, cf. §§ 4 of The Act. The project can be implemented without the approval by the Regional Committee for Medical Research Ethics (IRB 0000 1870). Additionally, approval for data protection of the bi-annual prospective survey among Norwegian doctors was obtained from the Norwegian Social Science Data Service (Reference 19521).
Provenance and peer review Not commissioned; externally peer reviewed.
Data availability statement Data are available upon reasonable request.