Article Text

Abstract
Introduction Environmental exposures are intertwined with mental health outcomes. People are exposed to the environments in which they currently live, and to a multitude of environments along their daily movements and through their residential relocations. However, most research assumes that people are immobile, disregarding that such dynamic exposures also serve as stressors or buffers potentially associated with depression and suicide risk. The aim of the Dynamic Urban Environmental Exposures on Depression and Suicide (NEEDS) study is to examine how dynamic environmental exposures along people’s daily movements and over their residential histories affect depression and suicide mortality in the Netherlands.
Methods and analysis The research design comprises two studies emphasising the temporality of exposures. First, a cross-sectional study is assessing how daily exposures correlate with depression. A nationally representative survey was administered to participants recruited through stratified random sampling of the population aged 18–65 years. Survey data were enriched with smartphone-based data (eg, Global Positioning System tracking, Bluetooth sensing, social media usage, communication patterns) and environmental exposures (eg, green and blue spaces, noise, air pollution). Second, a longitudinal population register study is addressing the extent to which past environmental exposures over people’s residential history affect suicide risk later in life. Statistical and machine learning-based models are being developed to quantify environment–health relations.
Ethics and dissemination Ethical approval (FETC17-060) was granted by the Ethics Review Board of Utrecht University, The Netherlands. Project-related findings will be disseminated at conferences and in peer-reviewed journal papers. Other project outcomes will be made available through the project’s web page, http://www.needs.sites.uu.nl.
- mental health
- depression
- suicide mortality
- environment
- dynamic exposures
- smartphone sensing
- life course of place
- register
- geographic information system
This is an open access article distributed in accordance with the Creative Commons Attribution Non Commercial (CC BY-NC 4.0) license, which permits others to distribute, remix, adapt, build upon this work non-commercially, and license their derivative works on different terms, provided the original work is properly cited, appropriate credit is given, any changes made indicated, and the use is non-commercial. See: http://creativecommons.org/licenses/by-nc/4.0/.
Statistics from Altmetric.com
- mental health
- depression
- suicide mortality
- environment
- dynamic exposures
- smartphone sensing
- life course of place
- register
- geographic information system
Strengths and limitations of this study
Dynamic Urban Environmental Exposures on Depression and Suicide (NEEDS) provides a novel conceptualisation of temporality on mental health–environment relations.
Innovative methods using smartphone-based sensing and population registers are used to study short-term and long-term exposures at an individual level.
Mental health data are linked with multidimensional environmental data describing the built, natural and social environments in space-time.
As parts of NEEDS are cross sectional, causal relations cannot be inferred.
Innovative methods using smartphone-based sensing and population registers are used to study short-term and long-term exposures at an individual level.
Introduction
The effect of the environment on mental health has emerged as an important research frontier.1–4 ‘Environment’ refers to everything external surrounding a person.5 It comprises the totality of the built, natural and social settings within which people live, move and interact.1 6
Many studies have investigated the pathway between mental health and environmental exposures.7–15 Some observational studies found that, for example, being exposed to natural environments such as green space is inversely related to mental disorders,16 and even suicide,17 while others reported insignificant associations.18 In terms of the salutogenic effects of blue space, the literature is limited.19 Air pollution seems to be positively correlated with mental disorders4 and suicidality.20 The health benefits of natural environments are also thought to be mediated through noise and air pollution.8 21 22 Some, but not all, studies argue that land use diversity could promote physical activity (eg, walking)23 and that social cohesion24 and community ties may increase in neighbourhoods with well-connected streets,25 which in turn promote mental health. Relationships such as these are, however, not universally confirmed and the pathways are yet to be fully understood.
The mixed findings can be partly explained by the diverse ways in which the spatial context that people belong to is defined.1 26 Many mental health studies use neighbourhoods within which people actually live as the health influencing context11 27 28; however, administratively bounded neighbourhoods at a single point in time have been criticised from both a conceptual and a methodological viewpoint.29 30
Refined exposure assessments are achieved through buffers centred on people’s residential locations. While circumventing some limitations of administrative areas, this assessment still assumes that people are immobile. However, as activity studies have revealed, only a limited amount of time is spent at the residential home; some argue that it is as little as 20%.31 Thus, peoples’ mobility and exposures cannot be captured meaningfully. For example, traffic-related air pollution was underestimated by as much as 16% because people’s daily movement patterns were not taken into consideration.32 33
Research designs that put central the notion of people’s mobility have sparked interest.1 34–36 Smartphone devices provide a new way to record detailed behavioural and environmental data in a non-invasive and objective way in space-time.37–40 The current generation of smartphones is equipped with a plethora of readily available built-in sensors (eg, Global Positioning System (GPS), Bluetooth) to collect individualised data.40 41 This reduces the participation burden and requires less strong study commitment.37 42 43
Mental disorders have been found to lead to behavioural changes. A GPS tracking study showed that depressed people have, for example, reduced physical activity patterns44 and limited social interaction.45 Others used smartphone-based Bluetooth sensing to investigate social networks.46 However, tracking studies are under-represented, usually experimental, and use small samples (ie, ~23 people40).
Besides daily exposures, the incorporation of place into the life course is similarly important, because people change their environmental context by changing their place of residence.1 47 This interplay of past and current place-based exposures is well represented in a life course approach,48 49 which recognises the role of time in long-term exposure assessments. This means that the mental health conditions of people are shaped through different historical and contemporary exposures over their lifetimes. With few exceptions,50–52 studies disregard exposures at previous residential locations and instead focus on exposure only at a single point in time at the actual residential location. Such a static notion does not permit an evaluation of the timing and prolongation of exposures later in life.1
The residential history coupled with a time series of place-based environmental information allows the exploration of long-lasting effects on mental health.1 53 Suicide affinity may develop over the lifetime. Thus, it is possible that the environmental conditions of the place where a person lives at the time of death, and past exposures along the residential history may contribute to suicide risk. Mental disorders may also take different courses depending on how long and during which life stage people are exposed to environments. For example, a deprived neighbourhood could have stronger adverse health effects during childhood, because children are less capable of coping with such a situation (eg, stigmatisation) compared with adults.
In response to the limited consideration of the temporality of exposures, the ‘Dynamic Urban Environmental Exposures on Depression and Suicide’ (NEEDS) project embraces peoples’ daily and residential mobilities. The overarching aim is to understand the underlying mechanisms between multifaceted dynamic environmental exposures, depression and suicide in the Netherlands.
The following depression-related hypotheses will be addressed: (1) direct, short-term exposure to the natural environment in people’s daily movement patterns can reduce depressive mood; (2) duration of exposure to the residential environment is a moderator of the relationship between physical and social neighbourhood characteristics and severity of depression; and (3) greater cumulative exposure to the natural environment during people’s daily movement patterns is associated with reduced risk of depression.
Concerning suicide, the following hypotheses will be addressed: (1) associations between neighbourhood characteristics and suicide risk are stronger for long-term residents; (2) exposures measured at one point in time are misclassified compared with cumulative exposure measures over people’s residential history; and (3) suicide risk correlates with spatiotemporal trends in neighbourhood trajectories and residential mobility.
Methods and analysis
The workflow is summarised in figure 1. After mapping environmental exposures across the Netherlands, one study is analysing how these environmental exposures along people’s day-to-day mobilities influence depression, another is how these environmental exposures over people’s residential history affect suicide mortality. The Netherlands was chosen because lifetime prevalence for depression in the Netherlands is high (19%)54 and the suicide rate per 100 000 persons increased from 8.3 in 2007 to 11.0 in 2015.55

Research design.
Environmental exposure assessments
A repository on environmental data from multiple sources has been developed. To operationalise environmental characteristics objectively, quantitative indicators were derived using geographic information systems (GIS) (table 1).
Description of the environmental variables
Natural environment
Different data sources were used to represent aspects of green and blue spaces. The availability of green and blue spaces was extracted from the Dutch land use model (Landelijk Grondgebruiksbestand Nederland; LGN). The LGN distinguishes 39 land use categories at a 25 m resolution over time (table 1). For green space, the following land use classes were aggregated: 1–6, 9–12, 20–23, 28, 36–40, 44–45 and 61–62; for water bodies, classes 16 and 17 were aggregated. Descriptions about the land use classes can be found elsewhere.56 Road distances from accessibility points 25 m apart to the coast were computed using the street network. Annual normalised difference vegetation indices (NDVI)57 were based on 16-day average composite measures for June/July extracted from Moderate Resolution Imaging Spectroradiometer (MODIS) multispectral remote sensing data. Additionally, NDVI scores were derived from Landsat 5, 7 and 8 by means of the Google Earth Engine. Landscape metrics58 were used to quantify the composition and configuration of green spaces extracted from the LGN.
Built environment
The Netherlands’ Cadastre (Basisregistratie Adressen en Gebouwen, BAG) served as a source to derive built environmental variables annually between 1996 and 2017. After filtering on building year, annual indicators were computed (eg, address density). The vertical morphological shape was depicted through a digital surface model describing objects (eg, buildings) above the ground based on 3D airborne laser scanning data (Actueel Hoogtebestand Nederland) linked to the cadastre. Building height, building ruggedness index, building coverage ratio (ie, building plan area fraction), and so on describe the urban morphological parameters.59–61 The diversity of the building usage and land use was operationalised through multiple measures (eg, Shannon index).
The spatial layouts of places and street patterns served as a proxy for urban design. Road data are from the Dutch topographic map (Top10) for 2009, 2012, 2014 and 2016. Older editions are not accessible digitally. Based on the road type, networks suitable for slow transport modes (eg, networks that exclude highways) and fast transport modes (eg, networks that exclude foot and cycling paths) were generated. The former are used for descriptive network statistics (eg, cul-de-sacs, ≥4 way crossings). Spatial street network analyses quantify network accessibility characteristics for different catchment radii (ie, 100–1000 m).62 For example, the betweenness index measures which street segment is busiest when moving from a location to all other locations along the shortest path.
Noise data—namely modelled daily traffic-related noise created by vehicles, railroads and air traffic (figure 2)—were obtained from the Netherlands Environmental Assessment Agency. The data are available on a 25 m raster classified into 10 noise groups (in dB). Finally, air pollution data (eg, NO2, PM2.5) based on a land use regression model63 for 2009 were collected from the Global Geo Health Data Center.
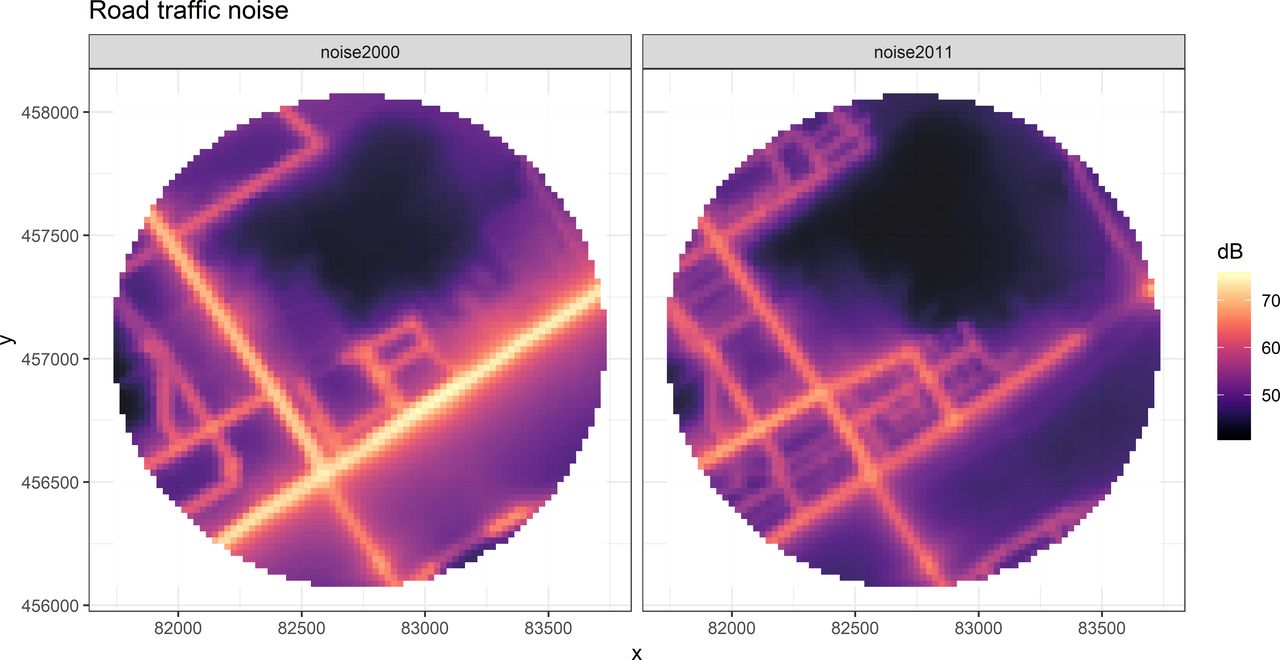
Noise exposure for a sample address for the years 2000 (left) and 2011 (right).
Social environment
Both annual social deprivation and fragmentation64 (1996–2016) are represented through concentric buffers (eg, 100–1000 m) at an address level. The underlying register-based personal and household data (Section 2.4) from the population on 1 January each year were aggregated per address. For each buffered address, the z-scores of the median annual household income, the percentage of low-income households and the unemployment rate were summed per year to represent a social deprivation index. For the social fragmentation index, the z-scores of the percentage of adults (aged ≥18 years) who were unmarried, lived in single-person households and had moved to the address in the previous year were summed.
Depression and exposures along people’s daily mobility patterns
This population-based cross-sectional study is examining the associations between people’s mental health and environmental exposures along their daily movements.
Sampling design and exclusion criteria
The target population consisted of all residents of the Netherlands. The eligibility criteria for survey participation were: (A) registered in the Dutch National Personal Records Database; (B) aged 18–65 years (ie, born after 11 September 1952 and before 12 September 2000); (C) living in private households (ie, people in institutions and care homes were excluded); and (D) not sampled by Statistics Netherlands in the past 12 months. A sample of 45 000 people was drawn from the target population. Reasons for this sample size were small error margins of the estimated depression prevalence and anticipated low participation rates in the smartphone-based data collection part.
The following stratified two-stage sampling design was implemented. The targeted sample size was distributed over the 40 Dutch regions (ie, the COROP division by Statistics Netherlands). The allocation is proportional to the population size of each region. First, through systematic sampling with probabilities proportional to the target population sizes, municipalities were selected from each region and the number of respondents to be selected in each municipality was determined. The number of selected individuals from those municipalities equals the product of the total sampling fraction in the region and the target population size of the municipality. Second, individuals from the selected municipalities were sampled through a simple random sampling process. Each person in the target population had an equal probability of being sampled. The estimated response rate for the survey was 21.3%.
Survey
In mid-September 2018, each selected respondent was personally contacted via an invitation letter (language level B1) and invited to fill in an online questionnaire through computer-assisted web interviewing. A general brochure (‘Why is Statistics Netherlands asking you?’), a log-in code and a user number were included in the letter. To increase response rates, the survey was conducted together with Statistics Netherlands, and incentives (one iPad per 2000 respondents) were used.65 The first 45 000 letters were sent on 11 September 2018. Reminders to those who had not responded were sent 2 weeks later (43 889 letters on 25 September 2018) and 4 weeks later (37 726 letters on 9 October 2018).
The Patient Health Questionnaire-9 (PHQ-9) module66 of the self-complete, multiple-choice PHQ67 served as diagnostic screener concerning the presence and severity of depression. Meta-analyses reported good diagnostic performance, good sensitivity and good specificity.68 Although the summed item score is frequently used as outcome variable, alternatives using a cut-point of 10 (or 11–12)68 or diagnostic algorithms have been proposed.69 As a measure of depression severity, we will use the summed item scores as outcome variable, while the other outcome variants will serve for model sensitivity testing.
Table 2 lists the questionnaires that formed the backbone of the survey, which was conducted in Dutch. The average questionnaire duration was 22.2 min. A total of 11 524 persons completed the survey, representing an overall response rate of 25.6%. Because the sample may deviate from the population (eg, due to selective non-response), a weighting model based on people’s age, gender, ethnicity, education level and marital status, and the urbanicity of their residential neighbourhood was developed to permit representativity.
Questionnaires used in the survey
Smartphone app
To collect data on people’s daily exposure, the participants who completed the survey and agreed to be contacted again were invited via email to participate in the smartphone sensing campaign, which used the Jouw Leefomgeving (‘Your Living Environment’) app (figure 3). The app was developed for Android (V.≥4.4). In contrast to ecological momentary assessments,70 the app—once downloaded from the App Store and granted permissions—runs in the background. Three times a week invitation emails (in total, 8869 emails) were sent, along with a study description, an app log-in code, and so on. Congruent with the European-wide General Data Protection Regulation, the sending was carried out by Statistics Netherlands. Among those who also took part in the smartphone-based tracking (see below), we raffled 400 €22 vouchers as a gesture of our appreciation.

User interface of the app. Left panel shows the log-in screen. The right panel shows the screen during data collection.
Sustainable battery consumption is critical in smartphone sensing. To avoid draining the smartphone batteries, we applied adaptive scanning frequencies. People’s mobility was tracked with GPS, whereas location scans took place every 15 s. Sampling rates were increased to 1 min intervals when the phone was stationary (ie, displacement of the phone <50 m). Comparable specifications have been used elsewhere.44 71
Bluetooth scanning served as a proxy measure for space-time social density.44 72 Such scans are used to count the number of Bluetooth-enabled devices that are present within a few metres of a phone.44 46 As Bluetooth scans consume a lot of battery power, they were done every 15 min. A measure such as the number of detected devices in the proximity of a smartphone during a time period may capture crowdedness,41 which could be related to psychological distress.
To obtain information about the subjects’ social connectedness, the time and duration of incoming and outgoing calls and messages were logged.41 A codified ID allowed the identification of unique contacts during their daily lives.46 In addition, data on the usage of the four most widely used social media services in the Netherlands (ie, Facebook, Instagram, Snapchat and Twitter) were also logged.
The app settings were determined through pretesting. The reliability of the app data was verified against travel diaries and personal notes across smartphone brands and operating system versions. No consensus exists about the sensing duration. Some recommend a 2-week period,73 whereas others argue that people’s routinised mobility patterns can be captured in just 1 week,74 which is the typical duration of GPS-based studies.29 After a cumulative recording time of 7 days, the participant received a push notification that the data collection had been completed. The collected data were sent in daily batches to a secure server at Utrecht University. In total, 821 (7.1%) of the survey participants later used the app.
Determining exposures along people’s daily mobility patterns
The recorded GPS data were enriched with environmental exposures. Concentric GIS buffers around GPS measurements were employed to specify the spatial context. Different buffer widths (eg, 100–1000 m) represent the immediate and extended exposures.
Statistical analyses
We are developing unadjusted and adjusted multilevel regression models to test the associations between environmental exposures and depression severity as outcome. Such a mixed model design is required due to nested data (eg, multiple measurements per person) and in order to consider the arising correlations.75 Interaction terms are added to the models to test for moderating effects on depression of individual variables (eg, gender) and environmental variables.
Suicide and exposures over people’s residential history
Study design
This study is examining the associations between suicide mortality and environmental exposures over people’s residential history. Longitudinal data were obtained by linking numerous registers for the period 1996–2016 and then analysed in a nested case–control design.76 Population registers offer a vast resource for epidemiological research, with the advantage of being available over time for all inhabitants, resulting in increased statistical power.77
Register linkages and case–control matching
Dutch population registers contain information on all officially registered citizens in the Netherlands since 1996. Registers are linkable based on unique personal identification codes given to each resident. Based on the Tenth Edition of the International Classification of Diseases and Related Health Problems (ICD-10), suicide cases were extracted from the cause of death register. When a person dies, a certificate is completed by the attending physician and submitted to Statistics Netherlands, which maintains the death register. We considered suicide cases aged 18–64 years from 1 January 2007 until 31 December 2016, coded X60.0 through X84.9 (ICD-10). Cases in institutional settings or with less than 10-year residence in the Netherlands at the time of suicide were excluded.
The controls were drawn from the population register. Through an incidence-density sampling procedure, a random sample of 10 controls with similar profiles in terms of age and gender who were alive on the date of the suicide were selected from the population at risk by matching on year of birth, sex and calendar time. Only those people who had lived in the Netherlands for at least 10 years were eligible to be selected as controls. Institutionalised people were excluded.
The population register contains person-level data (eg, nationality, marriage, age) including people’s residential history. Although data availability limits the retrospective reconstruction to post-1996 residential histories, we reconstructed an unprecedented biogeographical history. While past residential locations could be anywhere in the Netherlands, people who had emigrated were excluded. Based on availability and a review of the literature, the multiple demographic and socioeconomic attributes listed in table 3 were considered at either the individual or the household level.
Register-based variables
Determining exposures over people’s residential history
Environmental exposures were determined over people’s address history. Each residential relocation of a person over time was geocoded and matched to the Dutch Cadastre (BAG), which contains 9.1 million addresses. Concentric buffers (eg, 100–1000 m) were used to represent the health-affecting context.
Statistical analyses
To test the statistical associations between suicide and past environmental exposures, we fit different multivariate regression models with a different degree of adjustment. For example, we develop conditional logistic regression to take into account the case–control matching.78 The OR from the nested case–control study approximated the rate ratio in the full population, as the matching occurred on time.79 Models are extendable with splines to model non-linear effects. Interactions with personal characteristics (eg, gender) are also explored. To understand the correlations between past exposures and suicide, we compare models based on the life course with those using the current residential location.
Ethics, data management and dissemination
Ethical review
Dutch law allows the use of register data for research purposes under certain strict conditions, provided that results cannot be traced to individual persons. The use of registers does not require informed consent.
Data management
Data processing is done within the secure information technology environment of either Utrecht University or Statistics Netherlands. Register data can only be accessed via a remote access, while data protection conditions are effective. In compliance with Dutch law and European regulations, both the data security and the data protection strategies in place were approved through a privacy impact assessment at Utrecht University. Participants took the survey voluntarily and granted sensor-specific permissions.
Dissemination
The primary output of NEEDS is peer-reviewed papers in high-impact journals. The core platform for the dissemination is the regularly updated project website (www.needs.sites.uu.nl). Other activities include press releases, social media postings, and so on.
Discussion
NEEDS is strengthening the knowledge base at the nexus between dynamic environmental exposures, depression and suicide mortality. The project contributes to the existing literature through exploring how day-to-day environmental exposures along people’s daily mobility affect depression, and how exposures over people’s residential histories affect their suicide risk.
NEEDS stands apart from other studies in many ways. Both studies benefit from the richness of available environmental time series data on a microscale. Deriving the exposures at different scales (ie, buffer sizes) provides opportunities to explore the relative importance of immediate and extended health-influencing contexts. A key strength is that NEEDS goes beyond static neighbourhood-based exposure assessments11 27 by concentrating on people’s daily and life course-based exposures.1 By using the latest advances in smartphone sensing in combination with register linkages and detailed spatiotemporal environmental data, NEEDS explores how dynamic environments shape people’s depression and suicide risk.
The survey was representative of the Dutch population and had nationwide coverage. Self-reporting may be subject to some reporting error.80 The survey resulted in a large sample, which provides sufficient statistical power for advanced statistical modelling. Despite the efforts made (eg, personal invitation letters, incentives), the number of participants in the smartphone part was low but still larger than in other studies.41 44
NEEDS uses smartphone sensor capacities for data collection. This shapes our understanding of where, how and to what extent people are exposed to environments. The collected GPS data enable us to assess differences in activity spaces between depressed and healthy individuals, while eliminating both recall and daily mobility bias.36 The usage is, however, not without challenges; for example, signal losses in urban canyons, missing data through sensor failure and battery constraints are reported issues.37
NEEDS also collects data on people’s phone and social media usage to explore the hypothesis that depressed people interact with others less frequently and for shorter periods. Although our app is only available for devices running Android, such devices have a 60% market share in the Netherlands.81 A foreseen shortcoming, as in any GPS study with depressed people, may be a reduced participation rate of severely ill people.
As the design of the depression study is cross sectional, we cannot address causality and are limited in assessing residential self-selection issues.82 83 However, individual-level variables related to people’s locational choice adjust for such confounding.82
NEEDS is the first study to use people’s residential history for suicidology. Linking high-quality registers of residential history to address-based environmental data over time improves our understanding of health–environment relations. Focusing on individuals reduces the pitfalls of spatial and temporal data aggregation and context specification.26 57
The register-based suicide study is subject to the general limitation of such research designs. Although they provide accurate data on the population, the available confounders are not comprehensive. Further, people’s residential histories are only traceable as far back as 1996. We focus on the working population, but this is not perceived as problematic as, for example, suicide among children is extremely rare.
Conclusions
The foundations laid in the NEEDS project advance scientific knowledge about whether and, if so, how much environments along people’s daily mobility and over their residential histories correlate with depression and suicide risk. It is vital to add this temporal dimension, because questions about space-time exposures cannot be answered without putting people’s mobility central. Taken together, NEEDS provides much needed answers to pressing questions put forward by researchers and policymakers alike, for example, how environmental settings can support healthier living.
Acknowledgments
We are grateful to all participants who kindly provided their personal information. Without the contribution of these people, the research would not be possible. I thank the all involved colleagues at Statistics Netherlands and Utrecht University for their contribution when setting up this project. The efforts of Vincent Brunst and Tom de Jong are highly appreciated. Finally, I thank Hannah Roberts and Paulien Hagedoorn for realising the project. For Jonathan.
References
- 1.↵
- 2.↵
- 3.↵
- 4.↵
- 5.↵
- 6.↵
- 7.↵
- 8.↵
- 9.↵
- 10.↵
- 11.↵
- 12.↵
- 13.↵
- 14.↵
- 15.↵
- 16.↵
- 17.↵
- 18.↵
- 19.↵
- 20.↵
- 21.↵
- 22.↵
- 23.↵
- 24.↵
- 25.↵
- 26.↵
- 27.↵
- 28.↵
- 29.↵
- 30.↵
- 31.↵
- 32.↵
- 33.↵
- 34.↵
- 35.↵
- 36.↵
- 37.↵
- 38.↵
- 39.↵
- 40.↵
- 41.↵
- 42.↵
- 43.↵
- 44.↵
- 45.↵
- 46.↵
- 47.↵
- 48.↵
- 49.↵
- 50.↵
- 51.↵
- 52.↵
- 53.↵
- 54.↵
- 55.↵
- 56.↵
- 57.↵
- 58.↵
- 59.↵
- 60.↵
- 61.↵
- 62.↵
- 63.↵
- 64.↵
- 65.↵
- 66.↵
- 67.↵
- 68.↵
- 69.↵
- 70.↵
- 71.↵
- 72.↵
- 73.↵
- 74.↵
- 75.↵
- 76.↵
- 77.↵
- 78.↵
- 79.↵
- 80.↵
- 81.↵
- 82.↵
- 83.↵
- 84.
- 85.
- 86.
- 87.
- 88.
- 89.
- 90.
- 91.
- 92.
- 93.
- 94.
- 95.
- 96.
- 97.
Footnotes
Contributors MH drafted this manuscript on the basis of his grant proposal.
Funding This project has received funding from the European Research Council (ERC) under the European Union’s Horizon 2020 research and innovation programme (Grant Agreement No 714993). The project runs from 2017 to 2022.
Disclaimer The funders had no role concerning the study design or the data collection, analysis, interpretation or dissemination.
Competing interests None declared.
Patient consent for publication Not required.
Ethics approval Ethical approval (FETC17-060) was obtained from the Ethics Review Board of the Faculty of Social and Behavioral Sciences of Utrecht University
Provenance and peer review Not commissioned; externally peer reviewed.