Article Text

Abstract
Objectives To explore whether bone mineral density (BMD) is associated with arterial stiffness in middle-aged and elderly people with an advanced arterial stiffness index as indicated by the cardio-ankle vascular index (CAVI).
Design A cross-sectional study.
Setting This study was conducted from September 2015 to May 2017 at the geriatrics department of a provincial medical centre in China.
Participants A total of 580 patients aged 50 and over were enrolled in the study. The mean age of the group was 64.82±11.4 years, and 63.1% were male.
Primary outcome measures Associations of age with CAVI values and BMD. Associations between BMD and CAVI values.
Results With increasing age, CAVI values gradually increased (p<0.001) and the femoral neck (FN) and total hip (TH) BMD gradually decreased (p<0.001, all). In the bivariate correlation analyses between the covariates and CAVI values, age and CAVI values showed the greatest positive correlation (r=0.631, p<0.001), and CAVI values were negatively correlated with FN BMD (r=−0.229, p<0.001) and TH BMD (r=−0.218, p<0.001). In the linear regression analyses, TH BMD (B=−1.812 (95% CI −2.475 to −1.149), p<0.001) and FN BMD (B=−1.968 (95% CI −2.651 to −1.284), p<0.001) were negatively correlated with CAVI values. After adjusting for age, gender, body mass index, smoking, history of cardiovascular or cerebrovascular disease, history of diabetes mellitus, systolic blood pressure, high-density lipoprotein cholesterol, blood uric acid, fibrinogen and estimated glomerular filtration rate, only TH BMD was still negatively correlated with CAVI values (B=−0.843 (95%CI −1.454 to −0.232), p=0.007). However, there was no consistent and significant correlation between lumbar spine BMD and CAVI values.
Conclusion In this cross-sectional study, a significant correlation between TH BMD and CAVI values was observed in middle-aged and elderly Chinese inpatients. However, our cohort was a small sample of inpatients, and prospective studies from more centres are expected.
- arterial stiffness
- osteoporosis
- cardio-ankle vascular index
- bone mineral density
This is an open access article distributed in accordance with the Creative Commons Attribution Non Commercial (CC BY-NC 4.0) license, which permits others to distribute, remix, adapt, build upon this work non-commercially, and license their derivative works on different terms, provided the original work is properly cited, appropriate credit is given, any changes made indicated, and the use is non-commercial. See: http://creativecommons.org/licenses/by-nc/4.0/.
Statistics from Altmetric.com
Strengths and limitations of this study
Our study was conducted on a large general population sample of 580 subjects aged 50 years and above.
The sample included representation of a broad age range (50–94 years), both genders and various basic diseases, thus providing findings of broad generalisability.
Our study is one of the first to assess the association between cardio-ankle vascular index (CAVI) values and bone mineral density (BMD) in Chinese individuals.
Our study did not adjust for possible confounding factors, such as osteoporosis drugs.
The cross-sectional study design limits the ability to assess the causal relationship between CAVI values and BMD.
Introduction
Cardiovascular disease and osteoporosis are two major factors that seriously affect the quality of life and mortality of middle-aged and elderly people. These diseases accompany the ageing process, affecting the length and quality of life of middle-aged and elderly individuals. There is growing evidence that the coincidental occurrence of both diseases may be related to common pathological mechanisms other than age.1
Arterial stiffness is one of the basic pathologies of cardiovascular disease.2 The degree of arterial stiffness is often used as an important predictor for the diagnosis and prognosis of cardiovascular diseases.3 4 Among many methods for evaluating vascular lesions, carotid arterial ultrasound, overspeed CT and MRI can be used to evaluate the abnormal structure of arterial walls.3 However, when the arterial wall structure is abnormal, the degree of arterial stiffness is severe. Therefore, early evaluation of arterial stiffness before the structure becomes abnormal is very important for predicting the risk of cardiovascular events.
There are many clinical indicators to identify early arterial stiffness. Among them, pulse wave velocity (PWV) is often used to assess the early stage of arterial stiffness.5 However, blood pressure at the time of measurement can affect the PWV values. In addition, the cardio-ankle vascular index (CAVI) is a relatively new non-invasive indicator of arterial stiffness, which is performed by integrating the ECG, phonocardiogram and arterial pulse waveform techniques. CAVI can reflect the overall arterial elasticity from the origin of the aorta to the ankle artery. CAVI=(2ρ/ΔP)×ln (Ps/Pd) ×PWV2 (ρ=blood density, ΔP=pulse pressure, Ps=systolic blood pressure, Pd=diastolic blood pressure). The measurement of the CAVI is not affected by blood pressure, and CAVI could represent the stiffness of the arterial tree from the origin of the aorta to the ankle.6 Thus, CAVI is widely used in the evaluation of cardiovascular diseases and related risk factors for arterial stiffness. In previous studies, elevated CAVI values demonstrated a good predictive ability for cardiovascular diseases.6
Recently, several studies have suggested that there may be an association between arterial stiffness and bone mineral density (BMD). However, these studies were mostly conducted in postmenopausal women, patients with chronic kidney disease, patients undergoing haemodialysis or individuals with hypertension.7–9 Few studies have been conducted in the general population, and few studies have included men. Moreover, the findings of these studies have been inconsistent.10 There is only one study about the association between BMD and arterial stiffness that measured CAVI. Masugata’s study showed that elevated CAVI values are associated with reduced BMD in patients with hypertension.8
The aim of this study was to investigate whether there is an association between arterial stiffness, measured by the CAVI, and BMD in inpatients aged 50 years and older in China. In addition, we studied the effects of age, gender, serum lipid levels and body mass index (BMI) on the association.
Patients and methods
Study population
This was a retrospective and observational cross-sectional study that was conducted from 1 September 2015 to 31 May 2017 with 580 inpatients from the Department of Geriatrics at our hospital. Online Supplementary file S1 describes the participants’ enrolment and reasons for exclusion.
Supplemental material
Inclusion criteria (all of the following were met): Asian; age ≥50 years; postmenopausal (if women); and ability to cooperate to provide a medical history, obtain an effective measurement of the CAVI and undergo a complete examination.
Exclusion criteria (excluding those who satisfied one or more of the following conditions): patients with incomplete data, limb disability, acute infection, acute myocardial infarction, acute cerebral infarction, renal failure dialysis, a malignant tumour in an active phase, hormone replacement therapy and oral or injected glucocorticoid use. When the ankle brachial index (ABI) is less than 0.9, the lower CAVI value cannot reflect the actual degree of arterial stiffness,11 so we exclude individuals with an ABI value less than 0.9 on either side.
Measurement of BMD
Dual-energy X-ray absorptiometry (DEXA) scans (Prodigy, Lunar, Madison, Wisconsin, USA) were performed and analysed according to the manufacturer’s standard scanning and positioning protocols. The BMD of the lumbar spine (LS BMD), the bilateral femoral neck (FN BMD) and the total hip (TH BMD) were measured.
Measurement of CAVI and ABI
The CAVI and ABI were measured by the VaSera VS-1500 (Fukuda Denshi Co Ltd, Tokyo, Japan) blood pressure pulse measuring device. All the measurements were taken by the same experienced operator on the same machine using standardised procedures for participant positioning. Electrocardiograph electrodes were placed on the patient’ wrists. A microphone was placed on the sternum for capturing heart sounds, and appropriate cuffs were wrapped to each of the patient’s arms and ankles. After the measurements were completed, software was used to analyse the obtained data and, thus, the CAVI and ABI values. In our study, we used the mean values of CAVI on the left and right sides.
Clinical characteristics
The data required for this study were obtained from the medical records of the patients from their hospitalisation. General clinical data, such as age, gender, smoking history, history of diabetes mellitus (DM) and history of cardiovascular or cerebrovascular disease (CVD, including coronary heart disease, cerebral infarction/transient ischaemic attack), were obtained by reading the medical records. Height and weight were measured in conjunction with the CAVI measurements. The participants did not smoke or drink coffee for at least half an hour before undergoing the blood pressure measurement. The patients had empty bladders and sat for at least 5 min before the measurement. Then, the blood pressure of the upper arm was measured with a mercury sphygmomanometer by the doctor. Blood pressure included systolic blood pressure (SBP) and diastolic blood pressure (DBP). The data used were the averages of two measurements taken in at least 5 min intervals.
Biochemical parameters
White cell count (WCC), triglyceride (TG), total cholesterol (TC), high-density lipoprotein cholesterol (HDL-C), low-density lipoprotein cholesterol (LDL-C), serum creatinine, cystatin C, uric acid (UA), fibrinogen and erythrocyte sedimentation rate (ESR) were obtained via a fasting venous blood test on the second day of admission. The neutrophil-to-lymphocyte ratio (NLR) is the ratio of the neutrophil count to the lymphocyte count. The estimated glomerular filtration rate (eGFR) was calculated using the chronic kidney disease epidemiology collaboration (CKD-EPI) creatinine-cystatin C formula.12 Online Supplementary file S2 shows the details of this formula.
Supplemental material
Patient and public involvement
Patients were not involved in the design or conduct of the study. Study reports will be disseminated to investigators and patients through this open-access publication.
Ethics approval
This study was conducted in accordance with the contents of the Declaration of Helsinki. Since this study was a retrospective anonymous study, informed consent from the patients was not required.
Statistical analysis
First, the distributions of the clinical characteristics were expressed as the mean and SD for continuous variables and the frequency and percentage for categorical variables according to the following age groups: 50–59 years old, 60–69 years old and 70 years and older. Then, continuous variables were tested by two independent samples t-tests, and the categorical variables were tested by the χ2 test.
Second, bivariate correlation analyses were conducted between the CAVI values and each of the possible variables (LS BMD, FN BMD, TH BMD, age, gender, smoking status, cerebrovascular disease (CVD), DM, BMI, SBP, DBP, ABI, WCC, NLR, fibrinogen, TG, TC, HDL-C, LDL-C, UA, ESR and EGFR). The correlation between CAVI and gender, smoking, the history of CVD and DM were analysed by Kendall’s tau-b correlation analysis with others by Pearson correlation analysis. Then, we drew scatter diagrams to visually show the correlation between the CAVI values and BMD of the different body areas.
Finally, a linear regression analysis was performed to estimate the strength of the correlation between the variables and the CAVI values, and the results are described as the unstandardised coefficients B (95% CI) and the p value. Model 1 is the crude model without any adjustments; model 2 was adjusted for age, gender, BMI, smoking status, history of CVD and history of DM; model 3 adjusted for SBP, HDL-C, blood UA, fibrinogen and eGFR in addition to the adjustments from model 2. Analyses were performed with the SPSS statistical software package, V.19.0. P<0.05 (bilateral) was defined as statistically significant.
Results
Clinical characteristics
Table 1 shows the characteristics of the 580 patients included in this study, 366 (63.1%) of whom were male. The mean (SD) age of the participants was 64.82 years (SD=11.377 years). All patients were divided into three groups according to age: 50–57 years old, 58–68 years old and 69 years and older. There were no significant differences in gender or BMI between the different age groups. With increasing age, the prevalence of cardiovascular and cerebrovascular diseases and type 2 DM increased. SBP, CAVI values, NLR, fibrinogen and ESR also increased with age. However, the decreasing BMD values were found in FN and TH, as age increased. Table 2 compares characteristics between different genders, demonstrating no difference in age or CAVI between them.
Clinical characteristics of the different age groups
Clinical characteristics of different genders
Bivariate correlation analyses between the covariates and CAVI values
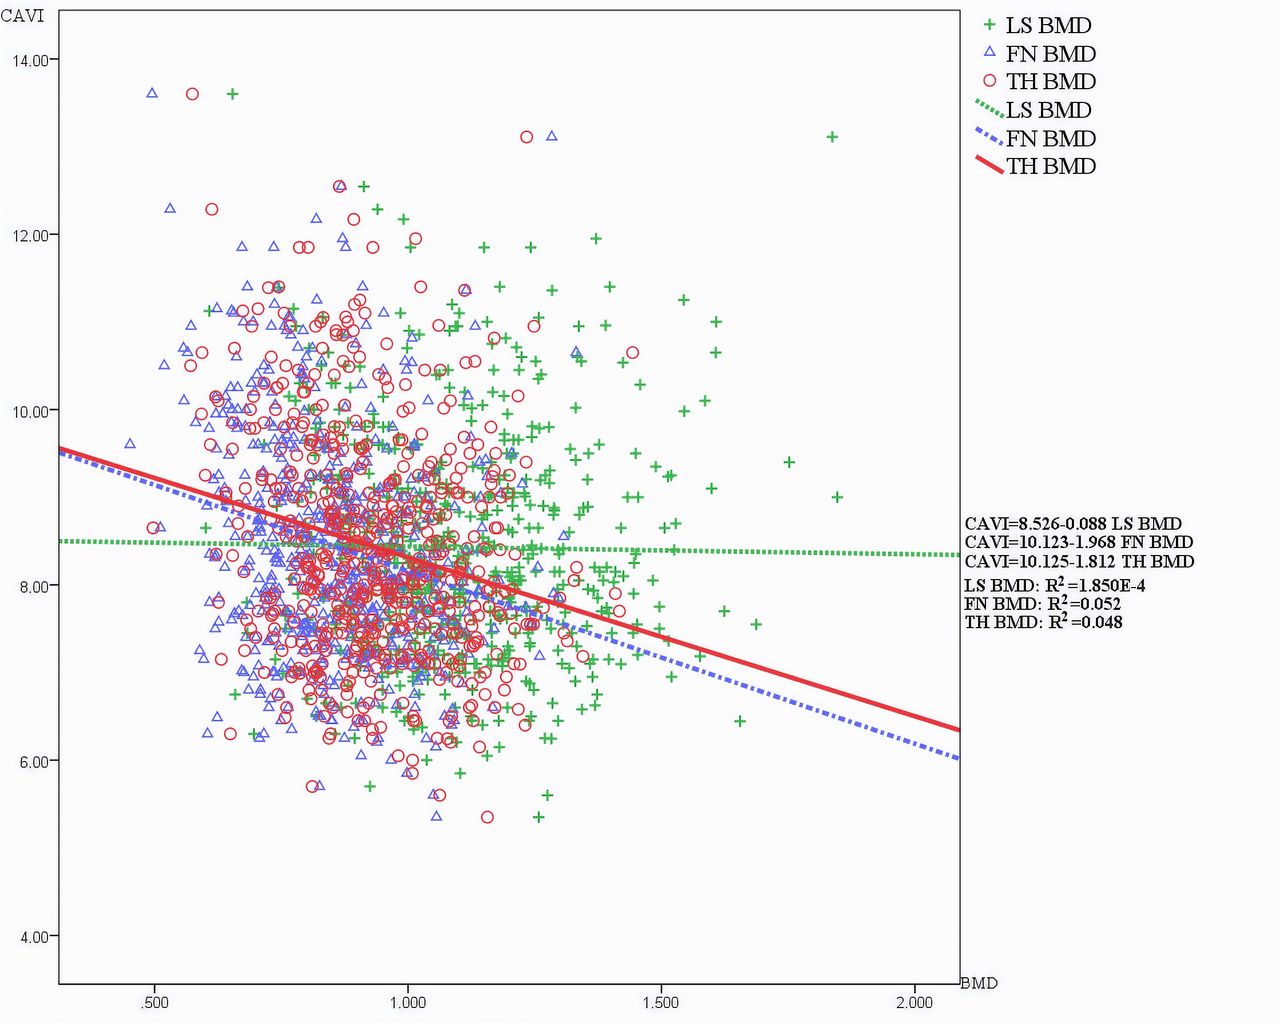
table 3 shows the results of the bivariate correlation analysis. There was a significant positive correlation between CAVI values and age (r=0.631, p<0.001), whereas there was a significant negative correlation between CAVI values and FN BMD (r=−0.229, p<0.001) and TH BMD (r=−0.218, p<0.001). Inflammatory indicators such as NLR (r=0.171, p<0.001), ESR (r=0.185, p<0.001) and fibrinogen (r=0.123, p=0.003) were also positively correlated with CAVI values. Patients with low eGFR had higher CAVI values (r=−0.394, p<0.001). The scatter diagram in figure 1 visually shows the correlations between CAVI values and BMD of the different body areas.
Correlation between CAVI and BMD. Figure 1 is a scatter diagram of CAVI and BMD with their fitting curve and regression equation. Green is the expression of LS BMD, blue FN BMD and red TH BMD. BMD, bone mineral density; CAVI, cardio-ankle vascular index; FN BMD, BMD in the femoral neck; LS BMD, BMD in the lumbar spine; TH BMD, total hip BMD.
Bivariate correlation analysis between covariate and CAVI
Regression analysis between CAVI values and BMD
As shown in table 4, model 1 shows the correlation between CAVI values and BMD without adjusting for any confounders. We found that FN BMD and TH BMD were significantly correlated with CAVI values (p<0.001). Then, in model 2, we adjusted for age, gender, BMI, smoking status, history of CVD and history of DM. In model 3, we adjusted for SBP, HDL-C, blood UA, fibrinogen and eGFR in addition to the variables that were adjusted for in model 2. We found that, after adjusting for related variables, the increase in CAVI values was still correlated with a decrease in BMD. This correlation was statistically significant between CAVI and TH BMD (B=−0.843 (−1.454 to −0.232), p=0.007).
Regression analysis with CAVI as the dependent variable
Discussion
This cross-sectional study of middle-aged and elderly Chinese individuals showed that age, BMI, FN BMD, TH BMD, history of CVD or DM, blood pressure, serum lipid levels, inflammation indexes (NLR, ESR and fibrinogen) and eGFR were associated with CAVI values. Adjusting for age, gender, BMI, smoking status, history of CVD, history of DM, SBP, HDL-C, blood UA, fibrinogen and eGFR did not attenuate the association between TH BMD and CAVI values. However, after adjusting for these variables, the association between FN BMD and CAVI values was attenuated.
In this study, we explored the relationship between arterial stiffness and BMD, which was different from previous studies. First, CAVI was selected to evaluate arterial stiffness, which reduced the influence of blood pressure when measured. Second, this was the first time the relationship between CAVI and BMD in middle-aged and elderly Chinese has been explored. In addition, this study was based on the real word of geriatric inpatients.
Several studies have shown a negative correlation between BMD and PWV in postmenopausal women.7 13–15 However, there have been some controversial results. In a study of 322 men without cardiovascular disease, Van den Bos found no significant correlation between BMD and PWV after adjusting for factors such as weight.10 In a study of an elderly hyperhomocysteinemic population, there was no association between arterial stiffness parameters and bone parameters at baseline or after 2 years of follow-up.16 In a study of heathy people aged 30 years and older, BMD was not associated with arterial stiffness in men or women.17 However, LS BMD was associated with arterial stiffness indicators, such as PWV, in some studies, but there was no association between CAVI values and LS BMD in our study. These controversial findings may be due to limited sample sizes or the inability to adjust for the many proposed confounding factors.
BMD was significantly associated with CAVI values in our study, which was possibly due to the interaction between bone and vascular metabolic mechanisms. First, changes in gender hormone levels associated with menopause and ageing affect arterial stiffness and bone resorption and reconstruction. Bones and arteries are all target tissues for oestrogen. Oestrogen receptors are widely distributed in osteoclasts, osteoblasts, vascular endothelial cells, vascular smooth-muscle cells and myocardial cells.18 Therefore, oestrogen may act directly on the bone and artery walls. Oestrogen in serum can inhibit bone resorption and reduce bone destruction, while the decline in oestrogen can promote bone resorption. The inhibition of bone resorption by oestrogen may be achieved through the receptor activator of nuclear factor-kB ligand (RANKL)-mediated production of osteoblasts.19 However, the decline in ovarian function associated with menopause may result in an increase in proinflammatory cytokines such as interleukin (IL)-1, IL-6 and tumour necrosis factor-alpha (TNF-α).20 These proinflammatory cytokines can cause osteoporosis and arterial stiffness. In addition, decreased oestrogen may lead to decreased levels of protective cytokines, such as osteoprotegerin, which may play a protective role in bone and vascular health.21
In addition to the reasons presented above, inflammation is a common pathway for the pathogenesis of arterial stiffness and osteoporosis.22 23 Inflammatory cytokines such as TNF-α and IL-1β increase the level of RANKL. The action of RANKL results in bone loss and vascular calcification, causing calcium to transfer from bone to the blood vessel walls.24 Our study also showed a positive association between CAVI values and inflammatory markers such as NLR, ESR and fibrinogen. Osteoporosis increases the dissolution of calcium, and various cytokines are produced during bone reconstruction.25 These effects may affect the development of arterial stiffness.26
Our study found that the association between TH and FN BMD and CAVI values was more significant than that between LS BMD and CAVI values. One possible reason is the uneven distribution of osteophyte, osteosclerosis, osteophytosis and vascular calcification in different parts of the bone.27 Another possible reason is that the effect of spinal degenerative changes and aortic calcification attenuates the accuracy of LS BMD measured by DEXA.28 These findings may explain the inconsistent results of the association between BMD and CAVI values in our study.
The results of our study showed that arterial stiffness was likely comorbid with osteoporosis in middle-aged and elderly patients. This suggested that during treatment, our clinicians should pay attention to the BMD of patients with arterial stiffness. Similarly, the degree of arterial stiffness should be taken into consideration when treating patients with osteoporosis. However, our study has not yet revealed the causal relationship between arterial stiffness and osteoporosis.
Limitations
As a single-centre retrospective cross-sectional study, our conclusions have some limitations. First, prospective studies are needed in the future to show the causal relationship between AS and osteoporosis. Second, larger sample size studies with more centres are needed, as our study did not include enough participants in some cases. For example, only two female smokers were included in the present study, which cannot accurately reflect the influence of smoking on CAVI values and BMD. Third, our study did not include fasting glucose but rather replaced it with the history of diabetes. Similarly, fat mass and lean mass were not measured, only BMI. Finally, our study did not include data concerning comorbidities, such as brittle fracture, and medications, for which adjustment is necessary. We expect more research to be done on basis of this study in the future.
Conclusion
This cross-sectional study revealed the association between BMD and CAVI values. It was suggested that TH BMD was significantly associated with CAVI values after adjusting for age, gender, BMI, smoking status, history of CVD, history of DM, SBP, HDL-C, blood UA, fibrinogen and eGFR. In the elderly population, patients with osteoporosis should be concerned about the risk of cardiovascular disease. Similarly, patients with arterial stiffness-related diseases should also be aware of the need for screening for and treating osteoporosis.
Acknowledgments
We would like to thank the participants. The English language was corrected and certified by American journal experts.
References
Footnotes
Contributors MZ, WP and JK: study concept and design. LB, JK and JG: data acquisition. MZ and JG: data analysis. LB, MZ and WP: data interpretation. All authors contributed to writing, revising and approved the manuscript.
Funding The authors have not declared a specific grant for this research from any funding agency in the public, commercial or not-for-profit sectors.
Competing interests None declared.
Patient consent for publication Not required.
Ethics approval The study was approved by the Institutional Review Board of Tongji Medical College, Huazhong University of Science and Technology (No. 2018S456).
Provenance and peer review Not commissioned; externally peer reviewed.
Data availability statement No data are available.