Article Text

Abstract
Objectives To evaluate the effect of social network influences on seasonal influenza vaccination uptake by healthcare workers.
Design Cross-sectional, observational study.
Setting A large secondary care NHS Trust which includes four hospital sites in Greater Manchester.
Participants Foundation doctors (FDs) working at the Pennine Acute Hospitals NHS Trust during the study period. Data collection took place during compulsory weekly teaching sessions, and there were no exclusions. Of the 200 eligible FDs, 138 (70%) provided complete data.
Primary outcome measures Self-reported seasonal influenza vaccination status.
Results Among participants, 100 (72%) reported that they had received a seasonal influenza vaccination. Statistical modelling demonstrated that having a higher proportion of vaccinated neighbours increased an individual’s likelihood of being vaccinated. The coefficient for γ, the social network parameter, was 0.965 (95% CI: 0.248 to 1.682; odds: 2.625 (95% CI: 1.281 to 5.376)), that is, a diffusion effect. Adjusting for year group, geographical area and sex did not account for this effect.
Conclusions This population exhibited higher than expected vaccination coverage levels–providing protection both in the workplace and for vulnerable patients. The modelling approach allowed covariate effects to be incorporated into social network analysis which gave us a better understanding of the network structure. These techniques have a range of applications in understanding the role of social networks on health behaviours.
- social network analysis
- influenza vaccination
- auto-logistic regression
- occupational health
This is an open access article distributed in accordance with the Creative Commons Attribution Non Commercial (CC BY-NC 4.0) license, which permits others to distribute, remix, adapt, build upon this work non-commercially, and license their derivative works on different terms, provided the original work is properly cited, appropriate credit is given, any changes made indicated, and the use is non-commercial. See: http://creativecommons.org/licenses/by-nc/4.0/.
Statistics from Altmetric.com
Strengths and limitations of this study
This study uses a novel auto-logistic regression approach to understanding the effects of an individual’s social network on their vaccination status.
The auto-logistic regression approach to social network analysis provides a unique quantitative framework for comprehensively understanding social behaviours.
The application of the study findings may be limited because there are many factors that affect influenza vaccination decisions that could not be captured using the data collection methods.
Data were self-reported which may have introduced bias.
Introduction
Influenza affects millions of people each year—it causes considerable morbidity and is a primary or underlying cause of death for thousands of people worldwide.1 The General Medical Council’s (GMC) guidance on Good Medical Practice (2013), advises that healthcare workers (HCWs) in the UK receive immunisation against common serious communicable diseases, such as influenza, in order to protect both patients and colleagues.2 Higher coverage of influenza vaccination within a hospital is believed to reduce patient mortality, staff absences and potential influenza epidemic size, thus protecting some of those at the greatest risk from influenza.3 Despite this, vaccination rates remain highly variable for HCWs and are below the government target of 75%. In 2016/2017, around 63% of HCWs in England and Wales received a seasonal influenza vaccination.4 5
There is increasing interest in the effects exerted by social networks on public health.6 A social network is made up of nodes (individuals) connected via ties (relationships).7 Disease dynamics within a network may be influenced by characteristics such as its density, how the individuals in the network interact and which individuals are vaccinated against, or susceptible to, the disease. For example, changes in the vaccination status of a few key individuals within a network may have a disproportional impact on disease spread.8 It has been shown that an individual’s behaviour may be influenced by their peers—for example, research has found that smokers are more likely to befriend other smokers.9 The grouping of similar individuals within a population, known as homophily, could have a considerable impact on behaviour as well as disease dynamics. For example, if clusters of non-vaccinated individuals exist within a network, a disease could rapidly spread through these groups, reducing the protective effects exerted by herd immunity.
HCWs’ vaccination behaviour may be influenced by the behaviour of their neighbours within their social network. Baron et al suggest that HCWs seem to be influenced by their co-workers’ vaccination practices.10 In this study, network analysis is used to study the characteristics of a social network of foundation doctors (FDs)—early career doctors in the first 2 years of postgraduate training in the UK—and related these to the distribution of seasonal influenza vaccination within the same population. This was extended by investigating how the probability of an individual receiving an influenza vaccine was influenced by the behaviour of his/her neighbours in the network.
Methods
Identifiable data were collected and subsequently anonymised before data entry and analysis, in line with accepted practice in social network analysis (SNA) studies of this type.
Participants
Data were collected during January/February 2015. All FDs working at the Pennine Acute Hospitals NHS Trust (PAT during that period were invited to participate. The foundation training programme at the PAT runs over 2 years and across four different hospital sites in Greater Manchester, forming two geographically distinct axes, east and west. As part of their training, FDs are required to attend compulsory weekly teaching sessions. Data collection took place during several of these sessions to optimise response rates.
All participants will have been offered a free seasonal influenza vaccine before the point of data collection. The PAT actively encourages influenza vaccination for its staff, as does the GMC. Staff are given numerous opportunities to have the vaccine, there are often vaccination points established at mutually convenient locations (hospital entrances, cafeterias, etc) as well as travelling vaccination nurses who offer the vaccine ward-to-ward. We have assumed that all participants have had ample opportunity to vaccinate however, we have not collected data specifically regarding participant’s exposure to seasonal influenza vaccination opportunities.
Patient and public involvement
This study involved early career doctors and no patients were involved. Initial findings were presented at the study setting as part of ongoing work; however, it is likely (due to staff turnover) that many participants will not have had access to the findings of this work prior to its publication.
Data collection
Each participant completed a paper-based questionnaire. Participants self-reported their seasonal influenza vaccination status for winter 2014/2015, alongside basic demographic information.
Participants were then asked how often they had contact with every other person on the foundation training programme using a six-point scale: 0, I have never met this person; 1, I recognise this person’s name but wouldn’t see them regularly; 2, I occasionally see this person for very short periods of time; 3, I see this person briefly at irregular intervals; 4, I see this person on most shifts/4 or more days a week; 5, I see this person on almost every shift for long time periods/live with them.
The relational data were then transferred into a numerical adjacency matrix, from which a network was constructed. Prior to analysis, the data were dichotomised at level 4, ‘I see this person on most shifts/4 or more days a week’ and above, in line with previous research.8 Where one person declared a relationship with another at this level, this was assumed to be reciprocal. There may be cases in which neither person declared any relationship, although one was present, this was treated as missing data and excluded. This produced an un-weighted (relationships were binary) and undirected (reciprocal ties were assumed) network.
Social network analysis
The FDs’ influenza vaccination status was evaluated as a node attribute on the social network. Individual-level network characteristics, such as a doctor’s degree score (the number of ties an individual possesses), were examined along with global measures such as overall network density, and density in different groups within the network (the number of ties throughout the network in relation to the number of individuals within the network).
The assortativity coefficient was calculated to assess whether or not vaccination status showed homophily within the FD population. The assortativity coefficient is a standard network measure originally defined by Newman.11 The coefficient can range from −1 to 1, where −1 suggests negative assortativity (opposites attract) and 1 implies positive assortativity (like attracts like). With the assortativity coefficient we provide a tolerance interval for a random network by calculating the range of assortativity values expected from multiple generated random networks. We generated a reference distribution using permutation. Multiple networks (n=1000) were generated with the same topological structure, but with vaccination status (yes/no) permutated randomly among the participants The assortativity value for each was then calculated—this provided the range of assortativity values we would expect under random permutation. Similar techniques are outlined by Barclay et al.12
Auto-logistic regression
The auto-logistic model was used to further investigate the effect of an individual’s social connections on their influenza vaccination decision.13 This model allows an individual’s vaccination behaviour to be modelled as a function of their demographic information and the behaviour of their neighbours in the social network. The specification of the auto-logistic model is given in equation 1.
 (1)
(1)

Where j~i indicates contact between individuals i and j, α indicates the intercept and  is a vector of covariates associated with individual i.
The parameters β describe how the covariates affect the likelihood of an individual being vaccinated, while the parameter γ describes how this likelihood is modified by the behaviour of the individual’s social contacts in the network.
In the specification above the network effect (γ) is based on the total number of vaccinated neighbours an individual possess, however, this is highly correlated with the number of neighbours an individual possess. Therefore, the model was re-parameterised so that the network effect (γ) was based on the proportion of an individual’s neighbours who were vaccinated, and the total number of neighbours an individual possessed was included as covariate information (see equation 2).

 (2)
(2)
Where  is the number of neighbours in the individual’s immediate network. Covariate information was included as additional
  .
.
To fit the model, we used Monte Carlo likelihood inference,14 using numerical optimisation with initial values of β derived by fitting a standard logistic regression and initial value of γ=0 (see the online supplementary material for additional details). The logistic regression model is a sub-model of the auto-logistic model when γ=0, which was used to give initial parameter estimates for α and β, but not for formal inference. The logistic regression model can be used to make inferences about a response (y) from covariate information (x). However, standard logistic regression techniques are unable to make inferences based on information from responses (y). This is problematic in cases such as spatial or network data, in which we might hypothesise that responses are correlated, for example, based on some arbitrary measure of distance. The auto-logistic model specified by Besag13 and outlined here is an extension of the logistic regression model, and is able to account for information from responses (y) in the right-hand side of the equation.
Supplemental material
Confidence intervals for the parameters were generated from SEs derived from the hessian matrix. Hypothesis testing was performed using a Wald test. Parameter estimates  were assumed to follow a multivariate normal distribution
  , where V is the variance-covariance matrix, derived from the hessian matrix. The vector C was defined as a binary vector, used for parameter testing, which gives
  and
and  . A Wald test was performed using a χ2 distribution.
The auto-logistic model does not assume that an individual yi is independent of their neighbour’s neighbours. In this model, the individual is conditionally independent of their neighbours (by the inclusion of γ). This is also true for the neighbours of the individual (and so on). Therefore, formally, the model accounts for information from indirect contacts through this mechanism—by accounting for neighbours the model implicitly accounts for information passed from indirect contacts through the network.
Results
One hundred and thirty-eight of the 200 FDs invited to take part provided complete data (sex, year of training, axis and vaccination status). Among respondents, 100 (72%) were vaccinated (table 1).
Seasonal influenza vaccination uptake by the foundation doctors stratified by their demographic factors
Figure 1 shows the FDs’ social network, along with their influenza vaccination status (n=138). The assortativity coefficient for the entire FD social network was −0.034 with a tolerance interval of (−0.12, 0.10).

The foundation doctor social network sociogram for those who returned complete data, dichotomised at ≥4 (‘I see this person on most shifts/ 4 or more days a week’), and coloured according to individual vaccination status.
The social network structure of the FDs varied between geographical areas and year-groups (figure 2). For example, among second-year doctors, the network density is higher in the east than in the west axis, with 223 ties among the n=31 doctors in the east axis compared with 73 ties among the same number in the west axis.

A sociogram depicting the foundation doctor network (n=138), coloured by sub-groups: year and axis.
We first fitted the re-parameterised auto-logistic model without covariates (equation 2). Figure 3 describes the maximum likelihood surface for auto-logistic model 1, and Monte Carlo log-likelihood functions are shown in figure 4. The coefficient for γ, the social network parameter, was 0.965, with 95% CI (0.248 to 1.682), that is, a diffusion effect—individuals were more likely to act in agreement with the behaviour of their neighbours (table 2). However, this effect was somewhat altered by the negative effect from total number of neighbours which was near to statistical significance. The model-based approach is more efficient than the assortativity coefficient, leading in this instance to a statistically significant departure from γ=0. For model 1, an additional Wald test was conducted for the null hypothesis which returned a χ2 value of 7.091 and p value of 0.029.
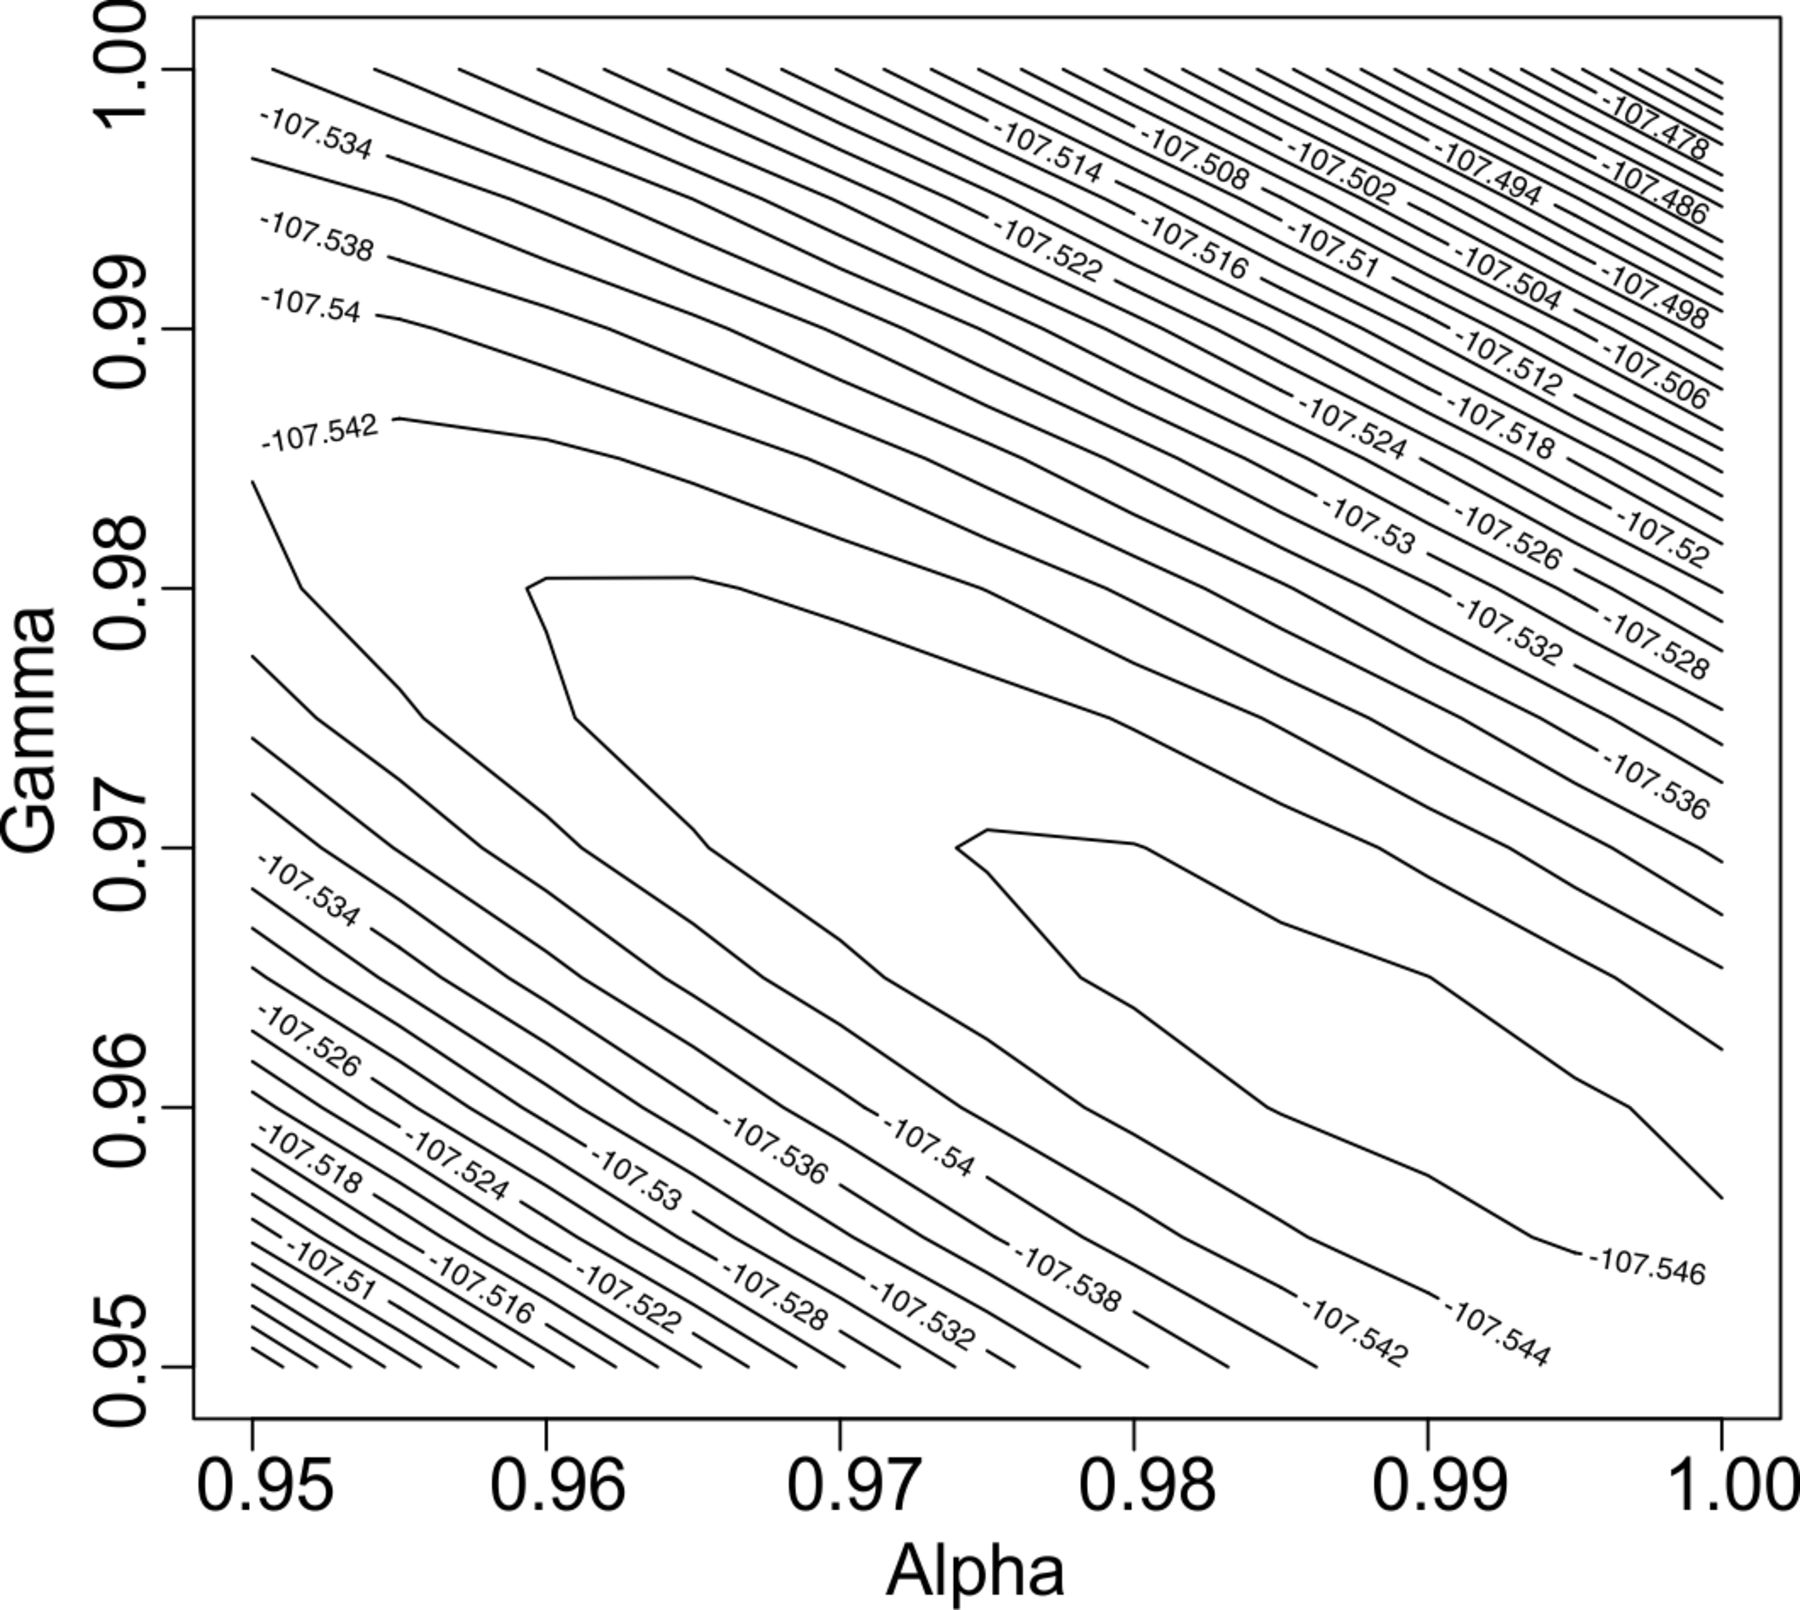
Contour plot showing the likelihood surface for auto-logistic model 1.

Monte Carlo log-likelihood functions for model 1,  and 10 000 simulations per log-likelihood evaluation (α shown in A, β shown in B, γ shown in C).
Parameter estimates for the auto-logistic regression models fit using the foundation doctor data
We then added covariate effects for year, axis and sex. The maximal model allowed us to perform Wald tests for the inclusion of each covariate (model 2, table 2). The covariates did not account for the social network effect on likelihood of vaccination.
Discussion
After excluding missing data, the FDs’ self-reported vaccination coverage of 72% (100 vaccinated out of 138, with possible range 50%–81% dependent on the vaccination status of non-respondents), was higher than the national average of 55%.15 The statistical analysis suggests that the individual’s social network has potential to exert both positive and negative effects on likelihood to vaccinate. The higher the proportion of vaccinated neighbours in an individual’s network the more likely they were to be themselves vaccinated.
The auto-logistic model has allowed us to assess which areas of the population are the less likely to vaccinate, taking into account their social network structure. For example, we hypothesised that year group or axis may affect an individual’s likelihood of receiving the vaccination. However, the confidence intervals for all demographic factors in the auto-logistic model included zero. This suggests that the effects of network structure on vaccination cannot be accounted for by the demographic information. Using this statistical modelling approach has provided a better understanding of the social network structure on vaccination uptake than could be obtained using only the assortativity coefficient, both through its greater statistical efficiency and its ability to investigate whether, and if so to what extent, measured covariates can explain the network structure.
Our analysis of the FD population suggests that as the proportion of neighbours who vaccinate increases, the individual’s likelihood of vaccination increases—similar to the usual diffusion of behaviour observed in social networks.16 However, this may be offset if having more neighbours reduces the individual’s probability of being vaccinated—this effect was close to statistical significant and requires further investigation (table 2). This suggests that social networks may exert both repulsion and diffusion effects on vaccination behaviours. This combination makes social networks vital to understanding vaccination dynamics within a population.
We observed other differences in the network structure among the four sub-groups defined by year and geographical axis. Second-year FDs on the west axis of the Trust had a much sparser social network than the other year/axis groups. In sparse social networks, the potential for information transfer (behaviour adoption, infectious disease spread, etc) is fundamentally diminished by social distancing.16 However, Shirley and Rushton suggest that even when network density is equivalent, network topology may still have an effect on diffusion of information.17 The analysis of the FD data suggests that demographic covariates were unable to account for the social network effects on vaccination. However, only a limited number of covariates were available. More research would be needed to identify other factors that may affect the transfer of vaccination attitudes among friends. Interventions aimed at improving vaccination uptake need to be sensitive to the differences between sub-groups within the relevant population and may need to be targeted at specific demographic sub-groups. Network effects on behaviour are complex, but the auto-logistic model provides an effective way of assessing behaviour on a real social network in the presence of other variables that affect individuals’ responses.
Vaccination is a complex behaviour in which there is a cost to taking the vaccination (pain of injection, perceived side effects, etc) to be weighed against the benefits of vaccinating (prevention of disease), within a social setting in which individuals both conform/dissent with social norms. It may be the case that the misperceptions surrounding the influenza vaccination are more commonly discussed than the benefits within this population.18 Vaccinated individuals may be more likely to provide a favourable assessment of the vaccination to their peers. This may have an effect on their neighbour’s assessment of the costs/benefits associated with receiving the influenza vaccination. Spread of vaccination information through a network is complex—previous work has shown that sharing factual corrections about controversial issues relating to vaccinations may have the counterintuitive result of decreasing intent to vaccinate.19 It is also possible that individual’s with a larger network are more exposed to varying influences regarding vaccination, where negative assessments are given greater weight. The behaviour of others directly affects the individual—if more people are vaccinated the risk of infection is lower for all.20 The data presented here was collected from a workplace environment and explores an occupational social network, which may be formed somewhat artificially; in this case, members of the same social group may have dissimilar demographic characteristics. Better understanding of the role social relationships play in establishing the vaccination behaviour of HCWs in the workplace is necessary to inform vaccination campaigns, whose ultimate goal is to improve occupational health and patient well-being.
Similarities or dis-similarities in behaviour between social contacts could arise due to an endogenous effect or an exogenous effect (via correlation or causation)—known as the reflection problem.21 The data presented here are cross-sectional; there is no way to explore how the observed behaviour arose—the direction of the causal relationship between social networks and vaccination status cannot be determined. The casual relationship may be explored using longitudinal data. Simulation studies have suggested that the influence of ‘stubborn’ individuals (those who do not change their vaccination behaviour) on others in a network greatly depends on their proportion within a population.22 Future work might include longitudinal studies to explore the mechanisms that lead to observed vaccination behaviour in a social network.
We have outlined a novel methodological approach to understanding behaviour in a network. We also fit the auto-logistic regression model as given in Besag’s original specification (without the re-parameterisation of γ, equation 1), this produced a negative γ term, suggesting that vaccination likelihood was negatively associated with number of vaccinated neighbours, however this is highly correlated with overall neighbourhood size. The model presented above is better suited to exploring diffusion of behaviour as these two elements (overall neighbourhood size and proportion of vaccinated neighbours) are separated. It is clear that there is much potential for the future use of this class of model, but that it may need adjustments (such as those shown here) to suitably address questions of interest when considering social networks. Furthermore, although the approach has been successful in fitting a parsimonious model to this relatively small dataset, attempts to fit more complex models quickly lead to large SEs and, consequently, low power to detect more complex network structure.
We dichotomised the social network at level 4, ‘I see this person on most shifts/4 or more days a week’ and above. We assumed that this represented a strong relationship due to the high amount of contact—it also provides an unambiguous definition of close contact. However, this simplification of intensity and direction of social ties is a limitation of this work and one commonplace in social network analyses. A larger dataset would enable more complex models to be fitted and more precise inferences.
An inherent limitation of our data is that they were self-reported, and therefore potentially subject to reporter bias. Given the size of the dataset there is no way to empirically check for responder bias. We have made the assumption that the data collected was a fair representation of the population. We believe this assumption is plausible. Data collection took place during teaching sessions where a large proportion of the population were expected to attend, irrespective of their vaccination status (the teaching session was not related to influenza vaccination)—and there was no benefit/coercion for individuals to respond positively or otherwise. Future research into this modelling approach should include investigation into the estimation of missing data to allow subjects with partially observed information to be included in the analysis, and to investigate whether non-participation is informative, that is, non-participants have atypical vaccination behaviour.23
Making a decision about influenza vaccination is a complex process—many people are neither completely for nor completely against influenza vaccination, and this may not be in alignment with their self-reported vaccination status.24 There may be varying levels of attitudes to vaccination that could be described using an ordinal or continuous scale, rather than as a simple binary variable. Extracting this more nuanced data is a challenge, and requires qualitative methods such as in-depth interviews with participants.24
Using the auto-logistic modelling approach, we have expanded on the results of the social network analysis. This novel approach to analysing social network data allows us to investigate in more detail the underlying process that has led to an observed network and its vaccination distribution. Quantitative methods that explore social behaviour are likely to become instrumental in defining targeted approaches to improving public health—this study outlines a suitable approach to investigating how an individual’s behaviour might be influenced by the behaviour of their neighbours in a network.
Social networks are powerful phenomena that may be harnessed to encourage diffusion of positive health behaviours.21 We have shown that this is particularly relevant in an occupational setting where somewhat artificial social networks are formed with clearly defined boundaries, and knowledge about occupational health is exchanged between workers.
Acknowledgments
The Authors would like to thank the foundation doctors at the Pennine Acute Hospitals NHS Trust for generously giving up their time to participate in this study and staff who enabled data collection. The Authors would like to thank the reviewers and editors at the BMJ Open, their insightful comments led to substantial improvements to the paper.
References
Footnotes
Contributors RE wrote the manuscript with input from all other authors all of which have approved the final version. RE collected the data. PJD advised on the statistical methodology which was implemented by RE. TJK guided the initial data collection and SN analysis. All authors contributed to the conception of the project. This study is part of a larger programme of work devised by RI.
Funding This work was supported by the Colt Foundation.
Competing interests None declared.
Patient consent for publication Not required.
Ethics approval Prospective ethical approval was obtained (15RECNA17) from Lancaster University Research Ethics Committee and the Pennine Acute Hospitals NHS Trust.
Provenance and peer review Not commissioned; externally peer reviewed.
Data availability statement Data are available in a public, open access repository.