Article Text

Abstract
Objective To explore sociogeographical inequalities in the availability and distribution of ear, nose and throat specialists (ENTs) in 15 Latin American (LA) countries.
Design Ecological.
Setting Spanish and Portuguese-speaking countries of LA.
The number of registered ENTs in 2017 was obtained from the National ENT Society in each country.
Outcome measures The ENT rate/million population was calculated at the national and subnational (eg, state) level. Three measures were calculated to assess subnational distributive inequality of ENTs: (1) absolute and (2) relative index of dissimilarity; and (3) concentration index (using the Human Development Index as the equity stratifier). Finally, the ratio of ENTs/million population in the capital area compared with the rest of the country was calculated.
Results There was more than a 30-fold difference in the number of ENTs/million population across the included countries—from 61.0 in Argentina (95% CI 58.7 to 63.4) to 2.8 in Guatemala (95% CI 2.1 to 3.8). In all countries, ENTs were more prevalent in advantaged areas and in capital areas. To attain distributive equality, Paraguay would need to redistribute the greatest proportion of its ENT workforce (67.3%; 95% CI 57.8% to 75.6%) and Brazil the least (18.5%; 95% CI 17.6% to 19.5%).
Conclusions There is high inequality in the number and distribution of ENTs between and within the 15 studied countries in LA. This evidence can be used to inform policies that improve access to ear and hearing services in the region, such as scale-up of training of ENTs and incentives to distribute specialists equally. These actions to reduce inequities, alongside addressing the social determinants of ear and hearing health, are essential to realise Universal Health Coverage.
- health policy
- organisation of health services
- otolaryngology
- health equity
This is an open access article distributed in accordance with the Creative Commons Attribution Non Commercial (CC BY-NC 4.0) license, which permits others to distribute, remix, adapt, build upon this work non-commercially, and license their derivative works on different terms, provided the original work is properly cited, appropriate credit is given, any changes made indicated, and the use is non-commercial. See: http://creativecommons.org/licenses/by-nc/4.0/.
Statistics from Altmetric.com
Strengths and limitations of this study
This is the first regional-level analysis on the availability and distribution of ear, nose and throat (ENT) specialists in Latin America, and includes 15 of the 17 Spanish or Portuguese-speaking countries.
The three inequality measures used to assess subnational inequality—the Relative Concentration Index, the absolute index of dissimilarity and the relative index of dissimilarity—take into account the entire population and are population weighted, thus giving equal weight to each individual’s access to ENTs.
The data were obtained from national ENT societies, which may not be representative of all available ENTs, as some may not be society affiliated.
Data were not available on the distribution of ENTs in private versus public health services, so our results may overestimate the availability of ENTs for people without the resources to access the private sector.
Introduction
In 2018, there were an estimated 466 million people with disabling hearing loss, and over 80% of these resided in low-income and middle-income countries (LMICs).1 WHO has estimated that by 2050, 1 in 10 or 900 million people will experience disabling hearing loss unless substantial public health measures are implemented.1 The predicted increase in prevalence can be attributed to the expected rise in global population and global ageing.1
Consequently, there is a need for ear and hearing services, including surgical (eg, ear, nose and throat specialists (ENTs)) and rehabilitative services (eg, audiologists and speech therapists), to meet the increasing demand. Indeed, in order to achieve Universal Health Coverage (UHC) for the millions of people with hearing loss globally, equitable access to effective, high quality and affordable ear and hearing services are vital. However, access to these services is extremely low in LMICs,2 due to a dearth of human resources.3 4
Latin America (LA) has a combined population of 600 million people, approximately 42 million (7%) of whom are estimated to have disabling hearing loss.1 5 Countries within LA are highly diverse in terms of their historical, economic, political and sociocultural contexts.6 As an example, the GDP per capita in Chile is US$15 346, more than three times as much as Guatemala (US$4470).6 7 These vast economic differences have shaped health systems reforms in the region and efforts to achieve UHC.6 8 As a consequence, countries in the region show variation in terms of human resource shortages for healthcare.9 Previous research has found substantial shortages in the number of ENTs in 50% of LA countries.10 Other professionals involved in ear and hearing care, such as audiologists and speech therapists, are in even shorter supply.11 There is also some evidence that within countries, ENTs are unequally distributed, with a higher concentration in urban compared with rural areas.12 However, these inequities have not been examined in depth.
This study aimed to explore sociogeographical inequalities in the availability and distribution of ENTs both within and between 15 LA countries. The study hypothesised that regional variation in the availability of ENT specialists per million population exists. Within countries, ENT specialists were hypothesised to be unequally distributed across subnational regions, with the majority concentrated in areas of higher human development.
Methods
This is an ecological study that assesses the distributive inequality of ENT specialists in 15 countries in LA using standard measures of disproportionality across subnational social gradients (defined by Human Development Indices (HDIs)).
Data sources
Population
This paper focuses on the Spanish and Portuguese-speaking countries of LA, of which there are 17. All LA countries were invited to participate, and 15 responded. The 15 included countries consist of 294 first-order subnational units (eg, department, province or state). Population data for these units were obtained from the national institutes of census and statistics of each country. The combined population of the included countries represent 96.7% of people in the LA Spanish and Portuguese-speaking countries, and 88.2% of the total LA and the Caribbean regional population in 2017.13
Personnel
Although ENT specialists alone do not represent the full complement of ear and hearing services necessary to treat and manage hearing loss, they were chosen as a key indicator to measure inequalities in access to ear and hearing services. An ‘ENT specialist’ is defined for the purposes of this paper as a medical doctor who has been trained in the management of ENT conditions, through a recognised degree.4 Hereafter, we refer to ENT specialists as ENTs.
In each country, data on the number of ENTs registered at each of the subnational units in 2017 were obtained from the National Society of ENTs. Societies were contacted by the Interamerican Association of Pediatric Otorhinolaryngology or study authors, either by phone or email. Society membership requires a medical degree, completion of residency at an accredited medical school and a national practice licence.
Human Development Index
The HDI was used as the equity stratifier of the subnational units. The HDI is widely used by the United Nations Development Programme (UNDP) as a composite measure of achievement in three key dimensions of human development—health, education and standard of living.14 The HDI score is a value between 0 and 1 that represents the geometric mean of the index of the three dimensions.14 The most recent HDIs for the subnational units of each country were obtained from UNDP reports from each country. To create the social gradient, within each country, subnational units were ordered from lowest HDI (most socially disadvantaged) to highest HDI (most socially advantaged).
Analysis
Availability of ENT personnel
The number of ENTs/million population was calculated for each subnational unit of each country. The mean and 95% CI of ENTs/million population at the national level were calculated.
Inequality measures
Inequality in the distribution of ENTs was assessed using three common indicators of health inequality15–17:
Relative Concentration Index
The Relative Concentration Index (RCI) is a relative measure of gradient inequality that indicates the extent to which a health indicator is concentrated among the disadvantaged or the advantaged.17 In this analysis, the RCI measures the extent to which the ENT distribution across subnational units is systematically associated with the social advantage of each subnational unit (measured by HDI). RCI takes a value between −1 and 1, with 0 indicating no inequality (ie, equal distribution). A negative value of RCI indicates that ENTs are concentrated among more disadvantaged subnational units, and a positive value indicates that ENTs are concentrated among more advantaged subnational units.
The RCI was calculated for each country using non-linear optimisation to fit a Lorenz concentration curve and calculating the area under the curve.18 The curve equation fit the observed cumulative proportion of the population (as ranked by the HDI of each subnational unit) against the cumulative proportion of ENTs.
Absolute index of dissimilarity
The absolute index of dissimilarity (aID) quantifies the number of ENTs within a given country who would need to be redistributed for the national rate of ENTs/million population to be achieved in each subnational unit (ie, equitable distribution). The aID is half the sum of the absolute value of the differences between the national average ENTs and the number of ENTs observed in each unit.
Relative index of dissimilarity
The relative index of dissimilarity (rID) is the relative equivalent of the aID, representing the percentage of ENTs who would have to be redistributed to achieve equitable subnational distribution. The rID is computed by dividing the aID by the total number of ENTs available.15 18 The closer rID is to 100%, the greater the inequality.
Regional benchmarking
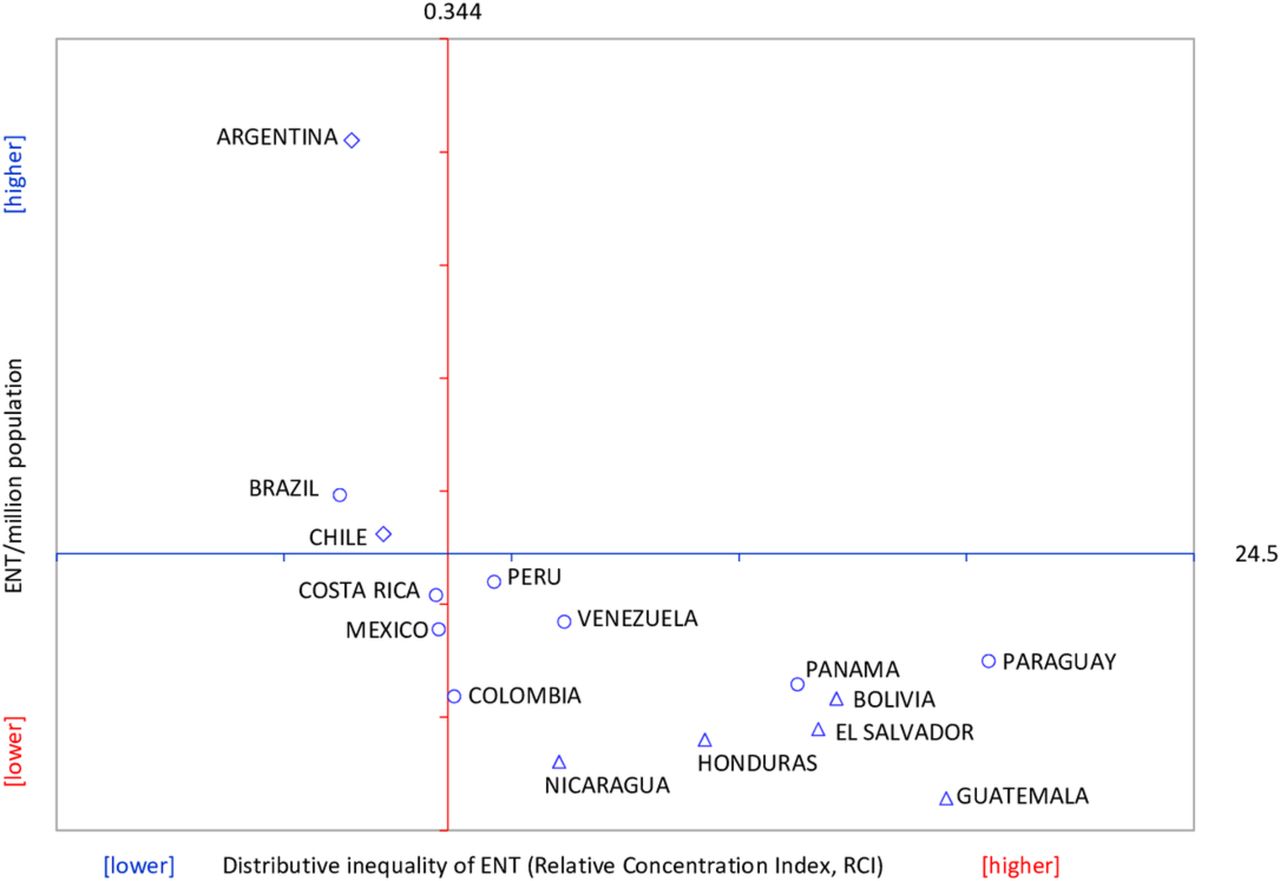
WHO recommends benchmarking within regions to understand one country’s level of inequality in relation to others.17 To benchmark ENT distribution in LA, we calculated the regional weighted mean of ENTs/million population and the regional distributional inequality (measured by the RCI). We used these regional averages to construct a framework19 with four quadrants and mapped each country based on whether its ENT rate and RCI were higher or lower than the regional average. The HDI level of each country20 was also indicated.
Urban concentration
To assess the extent of urban concentration of ENTs, the ENTs/million population in the capital area for each country (ie, the subnational unit that contains the constitutional capital or the seat of government city), as compared with the rate in the rest of the country combined (ie, all subnational units apart from the capital area). The ratio of ENTs/million population in the capital compared with the rest of the country was calculated.
All statistical analyses were performed in MS Excel Solver and ToolPak add-ins (Microsoft, Redmond, Washington, USA), using a semiautomated analytical template tool developed by the Pan American Health Organization (PAHO) for exploratory data analysis of social inequalities in health. Uncertainty was ascertained by computing 95% CIs for all summary measures of health inequality as well as the mean number of ENTs/million population.
Results
Between country inequality
In these 15 LA countries, there was a large variation in the size of the ENT profession, the rate of ENTs/million population and the distributive inequality (table 1). For example, Brazil had 6159 registered ENTs while Nicaragua had only 38. When the population size was taken into account, there was more than a 30-fold difference in the number of ENTs/million population—from 61.0 in Argentina (95% CI 58.7 to 63.4) to 2.8 in Guatemala (95% CI 2.1 to 3.8) (table 1). There was also a large variation in distributive inequality. In all countries, ENTs were more prevalent in advantaged areas but the extent of this inequality varied greatly—inequality was lowest in Brazil (RCI 0.249; 95% CI 0.133 to 0.365) and highest in Paraguay (RCI 0.819; 95% CI 0.769 to 0.870) (online supplementary figure 1).
Supplemental material
Distributive inequality of ENTs per million population in 15 Latin American countries, 2017
Regional benchmarking
The regional variation in the ENT rate and distributive inequality is depicted in figure 1. The high ENT rate in Argentina—more than twice as high as the rate in the next highest country—inflated the regional weighted mean of 24.5/million (95% CI 23.3 to 25.7) (figure 1). Brazil and Chile were the only other countries to have an ENT rate higher than the regional average. These three countries also had lower distributive inequality than the regional average (RCI 0.344; 95% CI 0.227 to 0.460), placing them in the best performing, top left quadrant of figure 1. In contrast, the countries in the bottom right quadrant had a lower ENT rate and higher inequality compared with the regional average, with Guatemala arguably furthest behind other countries in the region.
Availability and distributive inequality of ENTs for 15 Latin American countries benchmarked against regional mean values, 2017. Source of population data: National Institute of Statistics; source of ENT data: National Society of ENTs; source of HDI of each country: UNDP 2018.20 ENT, ear, nose and throat; UNDP, United Nations Development Programme.
The ENT rate tended to reflect the national HDI level. Countries with very high HDI had the highest ENT rate, followed by countries with high HDI, and then countries with medium HDI tending to have the lowest ENT rate. Distributive inequality was similar with two exceptions—Paraguay and Panama are high HDI countries but had distributive inequality more equivalent to countries of medium HDI (figure 1).
Within-country inequality
The redistributive potential to achieve equality mirrored the RCI results, with Brazil needing to redistribute the lowest proportion of their ENTs to achieve distributive equality (rID 18.5%; 95% CI 17.6% to 19.5%) and Paraguay the highest (rID 67.3%; 95% CI 57.8% to 75.6%) (table 1). Due to the size of the respective workforce, this equates to redistributing 1142 ENTs in Brazil and 70 in Paraguay (aID; table 1).
Urban concentration
In all countries, even when the population size was taken into account, ENTs were more concentrated in capital areas (table 2). Argentina fared best, but the ENT rate in the capital area remained over twice as high as the rest of the country (Capital (C) : Rest of country (R) ratio 2.3; 95% CI 2.1 to 2.5).
Number of ENTs per million population in the capital area compared with the rest of the country in 15 Latin American countries, 2017
The largest inequality between capital and other areas was seen in Paraguay (C:R ratio 36.7; 95% CI 23.6 to 57.2), Venezuela (C:R ratio 15.2; 95% CI 12.9 to 17.9) and Panama (C:R ratio 15.1; 95% CI 4.7 to 48.5). The high C:R inequality observed in Paraguay and Venezuela was driven by high ENT rates in the capital. In turn, these rates were driven by the low proportion of the national population residing in the capital area (7.6% and 6.6% respectively), combined with the majority of ENTs being located there (75.0% and 51.9%, respectively). In contrast, the high C:R inequality in Panama was driven by the very low ENT rates in the rest of the country, with only three of the country’s 53 ENTs (5.7%) stationed outside the capital (table 2).
Discussion
This study examined the sociogeographical distribution of ENTs between and within 15 LA countries. We found that the availability of ENTs across countries of the region was highly variable. Within countries, the distribution was shown to be unequal, with more socially advantaged areas, and capital areas, having a higher concentration of ENT specialists. Despite inequality in countries such as Argentina, Brazil and Chile being up to three times lower than Paraguay and Guatemala, the RCI in all 15 countries was at a level WHO considers a high level of relative inequality.17 This high inequality was reinforced by the rID, which indicates between one in five ENTs in Brazil and two in three ENTs in Paraguay would need to be redistributed to attain sociogeographical equality.
The findings of this study concur with previous literature from both the LA region and elsewhere. Two studies found that Guatemala had the poorest ratio of ENTs/100 000 population (4 per million), which was only 11% of the ratio in the USA.10 12 These studies also found the highest ratio was in Argentina (56 per million). These trends align with our findings, however, we found a lower ratio in Guatemala and higher ratio in Argentina which may be explained by population increases, or increases in the numbers of ENTs, respectively.10 12 In 2001, Madriz surveyed 15 countries in LA and the Caribbean to determine the resources available for hearing impairment, including prevalence data, training programmes and equipment. They found Brazil (5000 ENTs), Argentina (3000 ENTs) and Mexico (2400 ENTs) had the greatest absolute numbers of human resources. Although the survey was published over 15 years ago, it appears that there has been little progress in human resource development since this study was conducted.11 In fact, the number of ENTs in our study was lower in comparison for Argentina, Guatemala and Mexico. This may be due to differences in data sources, with the 2001 survey using expert opinion across a range of institutions rather than National societal membership.11 In 2012, WHO conducted a global survey of availability of human resources to provide ear and hearing care. They demonstrated great variation in availability of ENTs, audiologists and speech therapists globally, and a clear trend of increased availability with country-income group.4
Despite the trend in increased availability with national income, inequalities in access to services still exist within countries. Within country disparities in availability of ENTs have been less well documented. Westerberg and Lango report that the geographical distribution of ENTs in North America is inequitable, contributing to poor access for vulnerable populations.21 In Canada, for example, the majority of providers are located in urban centres, and there are no providers at all in many areas where Aboriginal populations live.21 The trends we found in this study have also been observed in eye health in the region. Hong et al found that ophthalmologists are more concentrated in socially advantaged areas within countries.22 However, comparisons to this study highlight that the low coverage of ENTs appears to be more pronounced than in eye health. For example, in Venezuela, there are 42 ophthalmologists/million, whereas our analysis found a ratio of 18.5 ENTs/million. Thus, for every ENT in Venezuela, there are two ophthalmologists. This is despite comparable burden of impairments (16% hearing; 18% vision).23 The reasons for this difference could allow lessons to be drawn on improving ear and hearing services availability in the country. Compared with ophthalmologists, ENTs in LA also tend to be less equally distributed. There are several possible explanations for this, including the lack of population-based data on the need for services and lack of funding, leading to ear and hearing care not being prioritised by the regional governments.24 The reasons for the concentration of ENTs in more socially advantaged areas likely include better availability of equipment, facilities and specialist training centres.
This study has several strengths. Although previous literature has examined numbers of ENTs per population and made comparisons across countries, there has been limited analysis of inequalities within countries. This study adds to the knowledge base by performing a robust, more in-depth analysis of the substantial subnational inequalities that exist. The three inequality measures used in this analysis take into account the entire population and are population weighted, thus giving equal weight to each individual’s access to ENTs.16 25 These strengths—along with reflecting the socioeconomic dimension to health inequality—are why WHO recommends the concentration index as a measure of relative inequality.26 The data coverage of this study was high, representing 96.7% of the LA Spanish and Portuguese-speaking countries.
There are also limitations, which should be taken into account when interpreting the results. The data were obtained from national ENT societies, which may not be representative of all available ENTs within the countries studied as some ENTs may not be society affiliated. Although ENT specialists are an essential component of functioning ear and hearing care programmes, there are also many other professionals involved in provision of specialist care for hearing loss and ear disease, for instance, audiologists and speech therapists. Further, data on the availability of equipment to enable service provision are not provided. In addition, we have assumed that ENTs in LMICs deliver the full range of ear and hearing services. However, it is possible that some ENT specialists are subspecialised and provide services for only one of ear, nose or throat. The data also do not capture more nuanced service delivery models common in LMICs, such as surgical outreach to primary and secondary care facilities or telemedicine. This is an area of future research need. Finally, data were not available on the distribution of ENTs in private versus public health service, which has an impact on the financial accessibility of the service. Thus, we are unable to draw conclusions on the availability full complement of ear and hearing services.
While not a limitation of our study, we acknowledge that distribution of personnel is only one aspect of access to hearing care. The productivity of these personnel and the quality and costs of hearing services are also important components that require attention to realise universal hearing care.27
This study provides evidence for policy-makers to further develop programmes that increase the number of ENTs/million population as well as reduce the inequities in their distribution. The PAHO, the regional WHO office for the Americas, has developed a strategy to guide national policies on addressing human resource deficiencies.28 Some of the key strategies outlined include strengthening governance and leadership, focussing on the number and distribution of personnel according to health needs; partnership with other relevant sectors, such as education, in order to respond to training needs across geographical regions; and implementing staff retention strategies, such as incentives and improved infrastructure.28 We acknowledge that there is no definitive ‘right’ number of ENTs/million population, and instead, countries must consider all of these elements. Access to health is required to achieve good health outcomes, however, in addressing health inequities, actions must also be taken to address the social determinants of health. As an example, hearing loss and ear disease are linked to poverty, and thus to address the greater magnitude among the poor, a multifaceted approach is required – beyond a focus on human resource development alone.29 30
Further research is needed to understand the availability and inequities in distribution of other health professionals relevant to ear and hearing care, including audiologists and speech therapists, as well as mid-cadre and primary health professionals such as clinical officers that exist in many LMICs. Training primary health workers in ear and hearing care has been a key strategy supported by WHO in order to address the lack of human resources and improve access to services at the community level, in efforts to achieve universal ear and hearing care.27 31 There is also a need to examine availability of equipment, and other essential elements of service provision. Although this study presents a clear picture of inequalities in distribution of specialists, the need for services is not well understood. There have been very few population-based surveys to determine the prevalence and causes of hearing loss in LA. In LA, there have been three published studies, two of which were in Brazil and one in Ecuador.24 Prevalence data are required to plan services according to the population need, including the required number and distribution of specialists. Although global Vision 2020 targets of ophthalmologists per population are contested, they have been used as an advocacy tool to lobby governments for increased resources for eye care. Thus, similar evidence-based targets should be developed for the field of ear and hearing. Vision 2020 has helped garner action to reduce avoidable causes of blindness, at a global and local scale. A similar global initiative for ear and hearing care has been launched in 2018, the World Hearing Forum, which aims to stimulate action and make gains similar to those attained in eye health.32
Conclusion
This study provides evidence that the availability and distribution of ENTs in LA countries are highly inequitable. A disproportionate number of ENTs are concentrated in more socially advantaged areas, such as capital cities. This evidence on health inequalities, with respect to access to ear and hearing services, can be used to support development of programmes and policies to increase the number and distribution of ear and hearing professionals. Actions to reduce these inequities are essential for efforts towards achieving UHC.
Acknowledgments
The authors would like to thank the Interamerican Association of Paediatric Otorhinolaryngology-IAPO for their assistance in obtaining data for this study. JR is a Commonwealth Rutherford Fellow, funded by the UK government through the Commonwealth Scholarship Commission in the UK.
References
Footnotes
Contributors JCS conceived of the study, facilitated access to data, interpreted findings and helped draft the manuscript. TB and JR interpreted data and drafted the manuscript. OJM and CMM conceived of the study, were responsible for data analysis and edited the manuscript. CD, AM, ELO, EISD, DJSH, SC and AP facilitated access to data and critically reviewed the manuscript. All authors read and approved the final manuscript.
Funding This study was funded by Pan American Health Organization.
Competing interests None declared.
Ethics approval Ethical approval was not sought for this study, which used publicly available population data with organisational practitioner data.
Provenance and peer review Not commissioned; externally peer reviewed.
Data sharing statement Data are available on reasonable request.
Patient consent for publication Not required.