Article Text

Abstract
Objective Osteosarcopenic obesity (OSO) may be associated with an increased prevalence of hypertension. The aim of this study was to examine the difference in the prevalence of OSO and hypertension among four minority populations in China and explore the relationship between OSO and hypertension by sex.
Design This study adopted a cross-sectional design.
Participants In total, 1939 participants aged ≥50 years, including 459 Jing, 514 Maonan, 535 Hmong and 431 Yao participants from Guangxi Province, China, were included using stratified cluster random sampling.
Main outcome measures The body composition, bone mineral density and blood pressure were measured by an MC-180 body composition analyser, Achilles Express ultrasound bone densitometer and OMRON HEM-1000 electronic sphygmomanometer, respectively.
Results The results showed that 65.77% of Hmong men, 58.79% of Hmong women, 54.82% of Maonan men, 50.00% of Maonan women, 41.92% of Jing men, 45.21% of Jing women, 53.66% of Yao men and 42.32% of Yao women suffered from hypertension. Compared with those among the normal group, the adjusted OR and 95% CI of age among the women with OSO was 3.15 (1.13 to 8.78). After adjusting for age, ethnicity, smoking status, alcohol consumption, physical activity and menopausal status, the women with OSO also had a higher OR (OR=3.18, 95% CI 1.14 to 8.88) for hypertension than those in the normal group. However, the ORs (95% CI) for hypertension in men with one or more components were not significant after adjusting for age and ethnicity.
Conclusion These results suggest that OSO is a risk factor for hypertension, especially in women. Furthermore, the prevalence of OSO and hypertension in the present study displayed sex-specific and ethnic-specific differences among the four minority populations.
- anthropology
- hypertension
- epidemiology
- osteosarcopenic obesity
- ethnic difference
- body composition
This is an open access article distributed in accordance with the Creative Commons Attribution Non Commercial (CC BY-NC 4.0) license, which permits others to distribute, remix, adapt, build upon this work non-commercially, and license their derivative works on different terms, provided the original work is properly cited, appropriate credit is given, any changes made indicated, and the use is non-commercial. See: http://creativecommons.org/licenses/by-nc/4.0/.
Statistics from Altmetric.com
Strengths and limitations of this study
To the best of our knowledge, this study is the first to explore the association between osteosarcopenic obesity (OSO) and hypertension by sex among minority groups in China.
This study is based on the four minority populations in China, and these groups are regarded as isolated populations because of intraethnic marriages.
The cross-sectional design of this study prevented us from drawing any causal inferences about the potential effect of OSO on hypertension.
Introduction
Ageing can be accompanied by unfavourable changes in body composition, such as low bone mass (osteoporosis), decreased muscle mass and strength (sarcopenia) and increased adiposity (obesity), especially in older women.1 Numerous studies have suggested that osteoporosis, sarcopenia and obesity are interconnected through a common pathophysiology.2 3
Therefore, the concept of osteosarcopenic obesity (OSO) syndrome was established in the scientific literature to better understand the association between the changes in body composition and certain chronic diseases. OSO is a newly identified condition characterised by the concurrent occurrence of sarcopenia, osteoporosis and obesity.4 Each of these three conditions is associated with common complications, such as fragility fractures.5 In combination, sarcopenia, osteoporosis and obesity are considered to be related to worse events than each condition alone.1 2
Hypertension, which is a multifactorial disease involving environmental and genetic factors and risk-conferring behaviours, remains the most common chronic disease worldwide.6 7 Doumas et al noted that cardiovascular morbidity and mortality present some differences between male and female hypertensive patients.8 According to Regitz-Zagrosek’s report, hypertension is more common in women than men in the elderly population.9 However, one study conducted in Nepal showed that prehypertension and hypertension occurred more frequently in males than famales.10
According to one study conducted by Liu et al, Y-STR haplotypes in minority populations in Guangxi are highly polymorphic and have high discriminatory power.11 These minority populations have been regarded as isolated populations.12 However, due to limited financial and human resources, we conducted a survey involving only Hmong, Maonan, Jing and Yao populations. The Jing, Maonan, Hmong and Yao populations are isolated minority groups in the Guangxi Zhuang Autonomous Region, China. The Jing population is the only oceanic ethnic group in China, and a very small minority population of 28 199 was reported in 2010.13 Compared with the Jing population, the Maonan, Hmong and Yao groups reportedly had slightly larger populations of 101 192 (0.0076%), 9 426 007 (0.7072%) and 2 796 003 (0.2098%), respectively, in 2010.14 In addition, their special customs and culture, including their clothing, intraethnic marriages, dietary habits and lifestyle factors, differ among the groups and especially from Han Chinese.15–17 However, knowledge regarding the differences in the prevalence of hypertension and association between OSO and hypertension among these minority groups is limited.
The aim of this study was to examine the difference in the prevalence of OSO and hypertension in the four minority groups in Guangxi and explore the relationship between OSO and hypertension by sex.
Methods
Study design and participants
This study adopted a cross-sectional design and was funded by the National Natural Science Foundation of China. Ethical approval was provided by the Medical Ethics Committee of Guangxi Medical University. In this study, the following inclusion criteria were used: (1) participants aged ≥50 years; (2) men and non-pregnant women and (3) healthy adults without a history of fractures or major diseases. Correspondingly, the following exclusion criteria were used: (1) a history of traumatic fractures or serious metabolic, cardiovascular or endocrine diseases; (2) pregnant or lactating women and (3) the use of medications that may affect bone metabolism, including statins, glucocorticoids, thiazolidinediones and antiepileptic medications.
In total, 1939 participants, including 459 Jing (167 male and 292 female), 514 Maonan (228 male and 286 female), 535 Hmong (222 male and 313 female) and 431 Yao (164 male and 267 female) participants from Guangxi Province, China, were recruited using stratified (by villages composed mainly of a single ethnic group) cluster random sampling. We collected the demographic information and health status through questionnaires, and the bone mineral density (BMD), blood pressure (BP), height, weight and body composition were simultaneously measured by trained personnel using a standardised protocol in each village. All participants provided written informed consent prior to participation in this study.
Measures
Height was measured by an altimeter with the participants standing barefoot. The circumferences of the waist and hips were measured with an inelastic measuring tape with the participants in their underwear. The waist-to-hip ratio (WHR) was defined as the waist circumference divided by the hip circumference. All length indexes were measured to the nearest 0.1 cm.
The body composition was measured with a bioelectric impedance analysis. The MC-180 body composition analyser, which was manufactured by the Japanese TANITA, has high sensitivity and specificity and was adjusted daily before the measurements to minimise measurement errors. The participants were instructed to fast, refrain from strenuous exercise for 4 hours or more and refrain from drinking for 1 hour before testing. Any metal items were removed from the participants to ensure the accuracy of the measures prior to the measurement. The participants were positioned on the analyser’s surface barefoot according to the manufacturer’s specifications. The body composition indexes included the body mass index (BMI), percentage of body fat (PBF), fat-free mass (FFM), fat mass (FM) and appendicular lean mass (ALM). The BMI was calculated as the weight divided by the square of the height (kg/m2). PBF was calculated as the proportion of FM to the total body weight. ALM was calculated as the sum of the arm and leg lean mass. All mass indexes were measured to the nearest 0.1 kg.
Quantitative ultrasound bone density measurements of the right calcaneus were performed in all participants using an Achilles Express ultrasound bone densitometer (GE, USA); the parameters included the speed of sound (SOS), broadband ultrasound attenuation (BUA) and stiffness index (SI). The SI was calculated automatically by the system software according to the following formula: SI=(0.67×BUA+0.28 ×SOS)–420.18 The T-score was calculated based on the normal reference value of BMD in a young and healthy population and matched by gender and ethnic group. According to the WHO criteria,19 the BMD was classified into the following three categories: osteoporosis based on a T-score value of −2.5 or lower; osteopenia based on a T-score value between −1.0 and −2.5 and normal bone mass based on a T-score value above −1.0.
The systolic blood pressure (SBP) and diastolic blood pressure (DBP) were obtained in the morning by trained workers using an OMRON HEM-1000 electronic sphygmomanometer (OMRON Health Care, Japan) after the participants rested in a seated position for 5 min. The participants were asked to abstain from any vigorous activity and drinking alcohol, coffee or tea. We used the mean of two BP readings measured at a 1 min interval. Hypertension was defined as a measured BP value of 140/90 mm Hg or above or a history of taking antihypertensive medicines during the preceding 2 weeks.
Definitions of sarcopenia, obesity and OSO
Sarcopenia, which is characterised by the loss of muscle mass, is an important factor in the development of functional impairment and disability and was generally defined as a reduction in muscle mass of two SD below the healthy young adult mean.20 21 Sarcopenia was defined in the present study as 2 SD below the mean of ALM/ht2, which was defined as ALM divided by the square of height (kg/m2).22 The cut-off values for sarcopenia applied to the males and females in the four ethnic groups were as follows: below 6.82 kg/m2 for Jing males and 5.54 kg/m2 for Jing females; below 7.81 kg/m2 for Maonan males and 6.11 kg/m2 for Maonan females; below 7.46 kg/m2 for Hmong males and 6.31 kg/m2 for Hmong females and below 6.15 kg/m2 for Yao males and 5.78 kg/m2 for Yao females.
Obesity was defined based on one adiposity measure using the standard cut-off point recommended by the American Council on Exercise (ACE) as follows: PBF ≥25% for men and ≥32% for women.23
The diagnostic criteria for OSO were based on a combination of bone and muscle loss and increased adiposity.3 24 25 We divided all participants into the following four groups based on the number of adverse body compositions: normal (without osteopenia, sarcopenia or obesity), one component (having one condition), two components (having two conditions) and three components (OSO).
Statistical analysis
The data were analysed using SPSS software (V.22.0, Chicago, Illinois, USA). We addressed the missing values via the method of imputation by mean. The normal distribution and homoscedasticity of the examined variables were assessed by Kolmogorov-Smirnov and Levene’s tests, respectively. The descriptive statistics are expressed as the mean±SD for the quantitative variables or number and percentage (%) for the qualitative variables. Independent t-test and analysis of variance were used to detect the differences in body composition, T-score and BP values, and a χ² test or Fisher exact test with an RxC contingency table was employed to determine the differences in the prevalence of OSO and hypertension based on the categorical variables. Logistic regression analyses were performed to evaluate the ORs and 95% CI of hypertension with OSO in the men and women. P<0.05 were considered statistically significant.
Patient and public involvement
The patients were not involved in the design of or data collection in this study.
Results
The average age was 66.80±9.79 years among 781 men and 65.39±9.68 years among 1158 women. Of all 1939 participants in the four minority groups, the prevalence of hypertension was 61.68% in the Hmong participants, 52.14% in the Maonan participants, 46.64% in the Yao participants and 44.01% in the Jing participants, and there were significant ethnic differences (p<0.001). In addition, among the four minority groups, the risk factors in order of top prevalence among the three components were osteoporosis (46.11%) in the Maonan participants, obesity (32.68%) in the Jing participants, sarcopenia (40.00%) in the Hmong participants and obesity (15.78%) in the Yao participants.
The sample characteristics are shown in table 1. The mean age of the men was higher than that of the women. The incidences of smoking, alcohol consumption, physical activity and hypertension among the men were higher than those among the women. Most women were postmenopausal (91.02%).
Characteristics of the study subjects*
Among the four minority groups, the differences in body composition and prevalence of hypertension between the men and women are depicted in table 2. Table 1 shows that in addition to the WHR in the Jing participants and T-score in the Yao participants, the height, weight, WHR, FFM and T-score of the men were greater than those of the women in the four minority groups (p<0.01), while the PBF and FM in the men were higher than those in the men in the four minority groups (p<0.01). Furthermore, the prevalence of hypertension in the men was greater than that in the women in three minority groups (65.77% vs 58.79% in the Hmong group, 54.82% vs 50.00% in the Maonan group and 53.66% vs 42.32% in the Yao group). In addition, the prevalence of sarcopenia in the men was lower than that in the women in the Hmong, Jing and Yao groups but greater than that in the Maonan group. In addition, the women had a higher prevalence of osteoporosis and obesity in the four minority groups.
Comparison of body composition, T-score and blood pressure between males and females in four minority populations
As shown in table 3, the BMI, WHR, PBF and FM of the participants with OSO were higher than those of the normal population, while the height and FFM were lower than those in the normal population. Among the four groups,25 the body composition of the participants with OSO was either the highest or lowest in terms of BMI, WHR, PBF, FM and height or FFM, respectively. In addition, the SBP and DBP of the participants with OSO were the highest among the four groups. Compared with the normal population, the prevalence of hypertension in the women with OSO was significantly greater, and the prevalence of hypertension in the men was higher, although this difference was not statistically significant.
Comparison of body compositions and blood pressure between males and females among the four groups
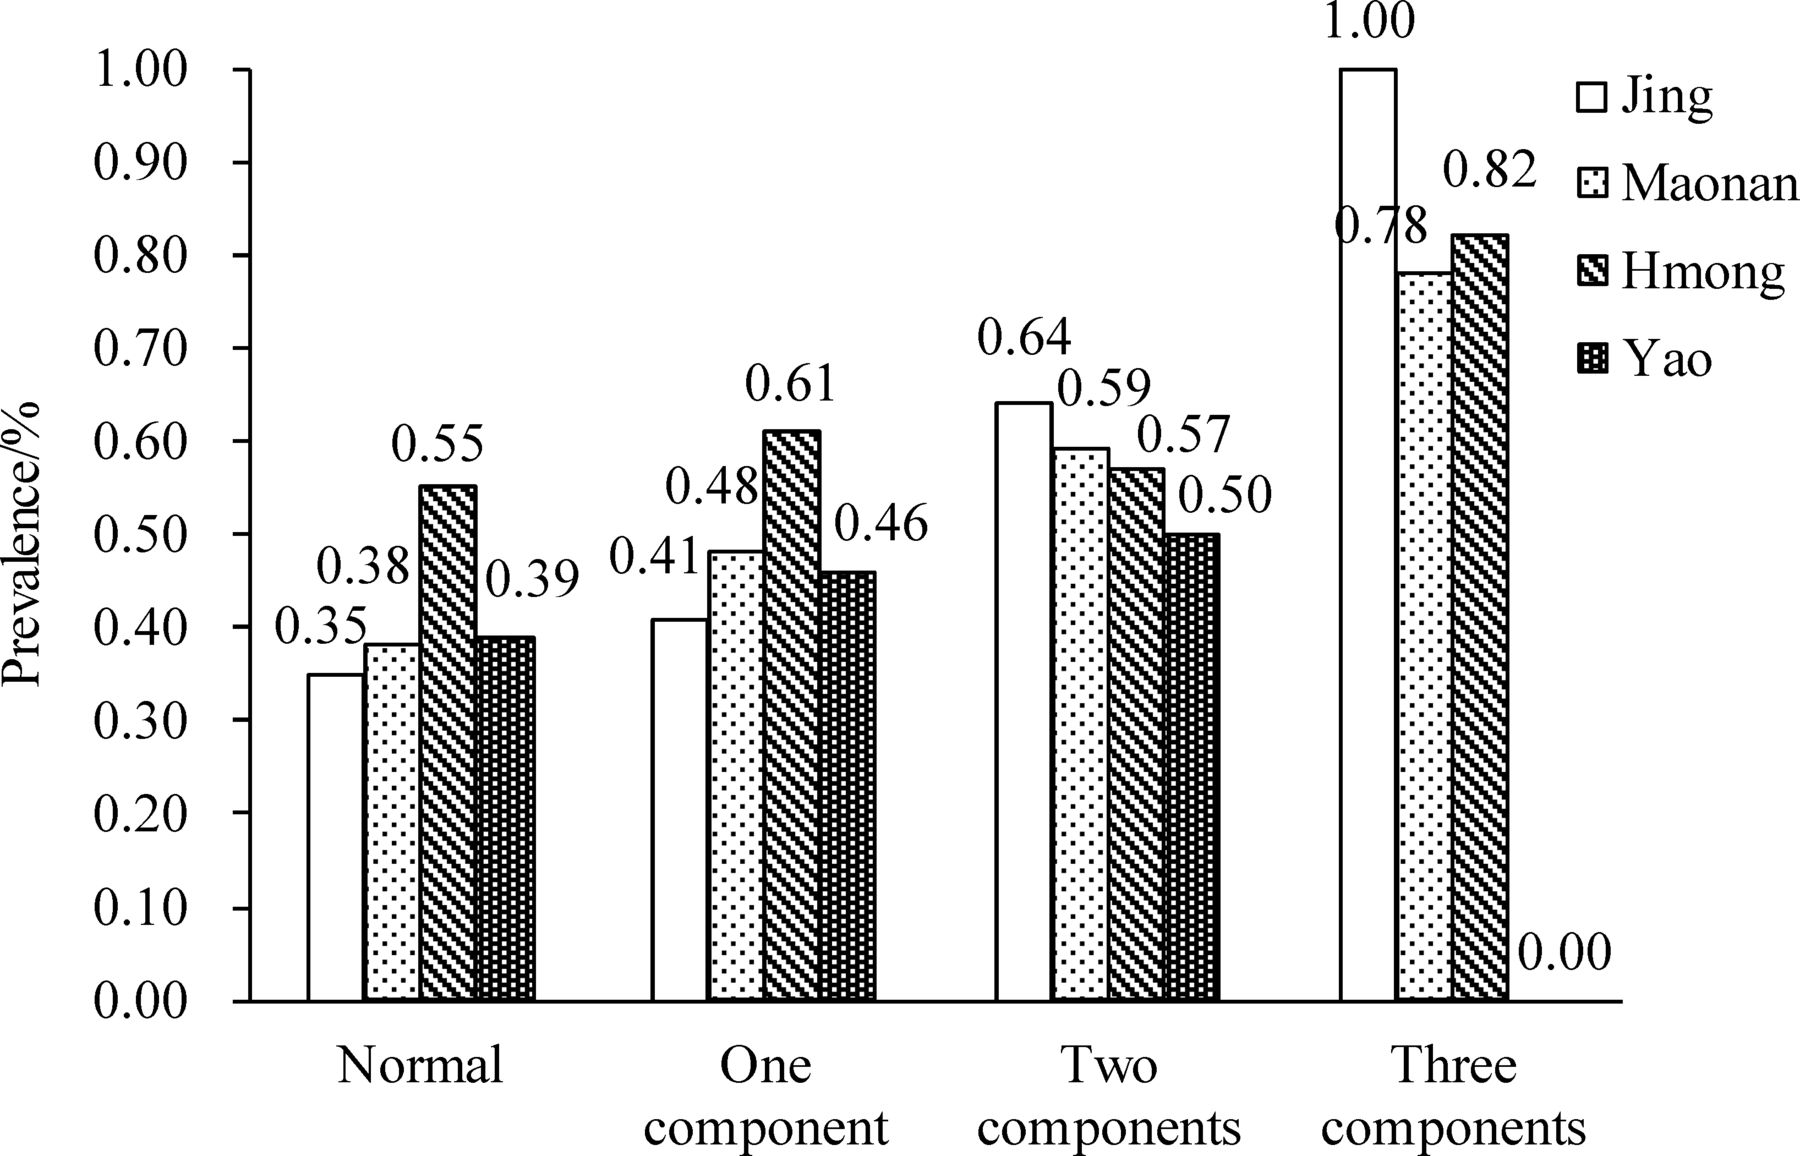
Figure 1 indicates that among the male population, the prevalence of hypertension in the Hmong participants was greater than that in the Jing, Maonan and Yao participants in the normal, one component and OSO groups, while the participants with OSO in the Jing and Yao groups had no hypertension. As shown in figure 2, in the female population, the prevalence of hypertension increased as the number of adverse body compositions increased in the Jing, Maonan and Hmong groups, but the prevalence of hypertension in the Yao with OSO group was 0.00%.
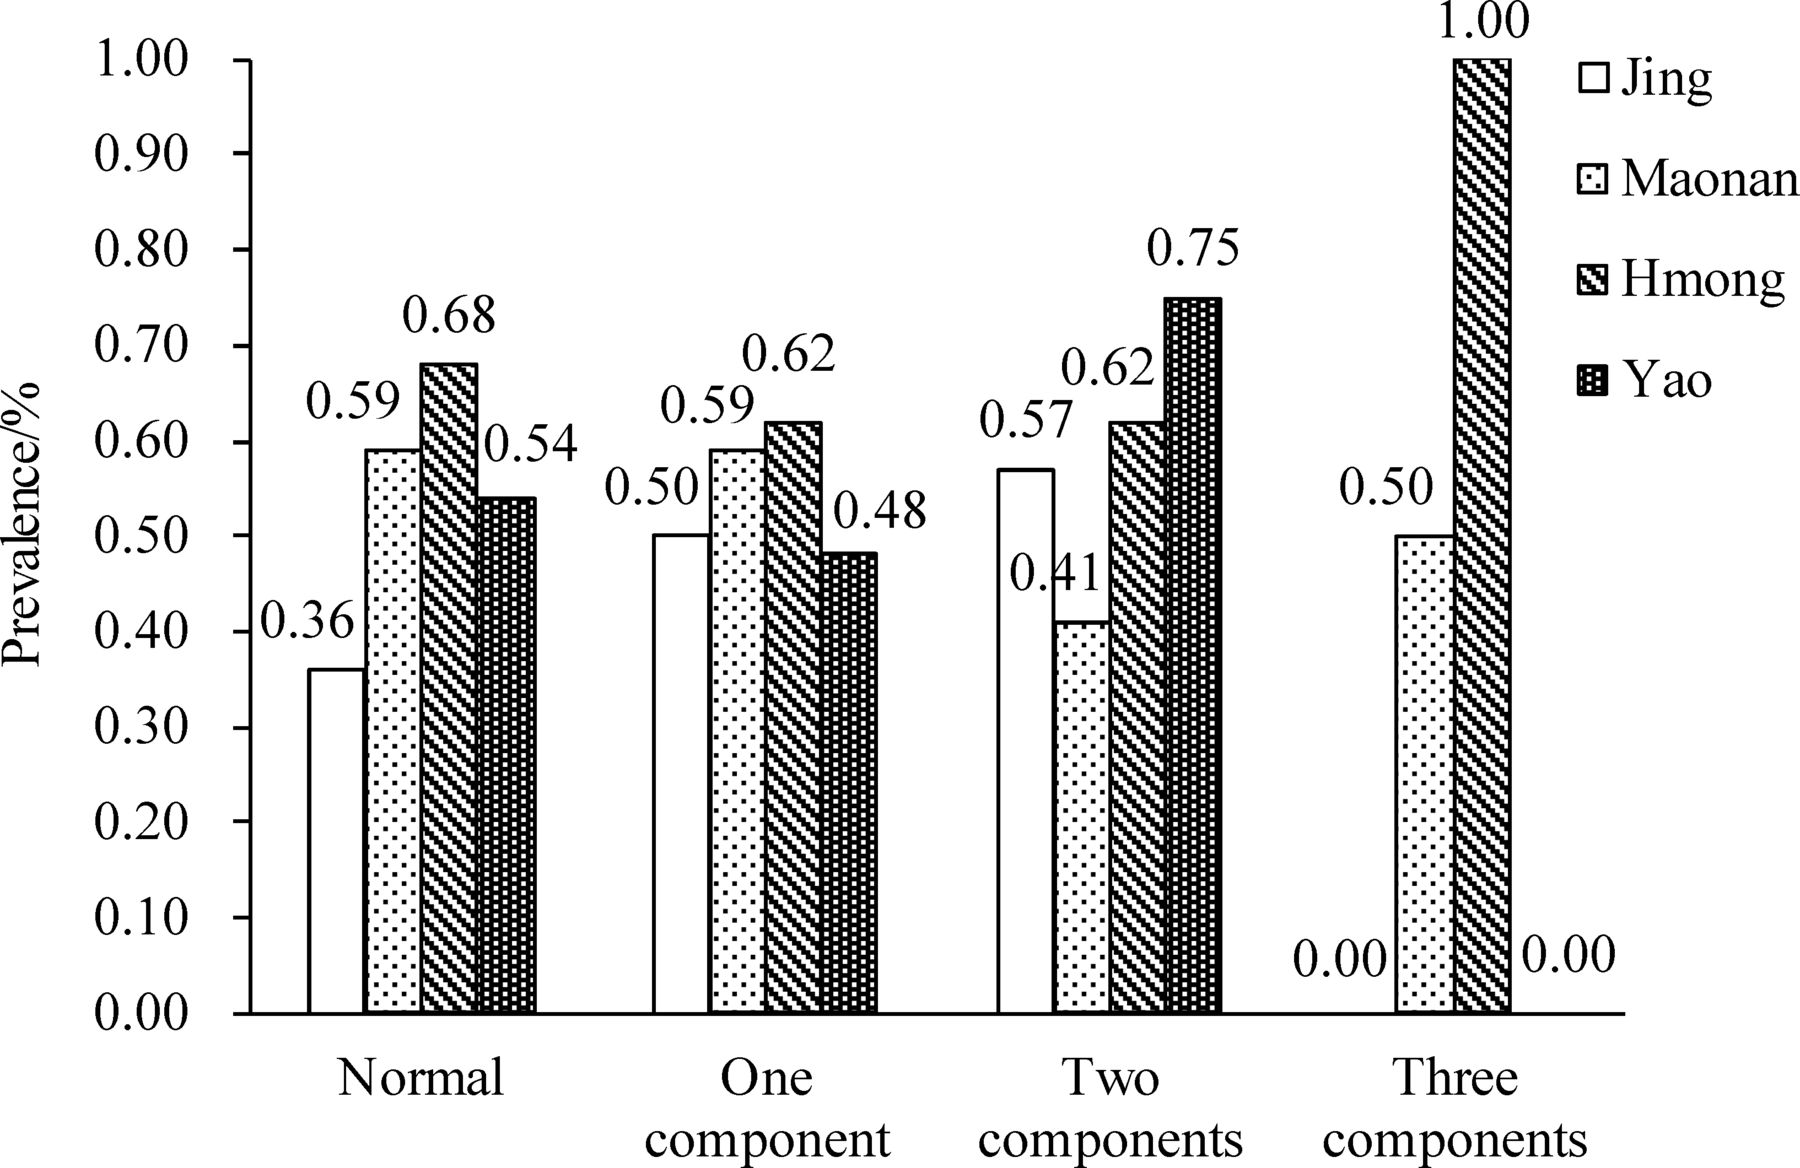
The prevalence of hypertension among males in the four minority groups.
The prevalence of hypertension among females in the four minority groups.
The ORs and 95% CIs of OSO predicting hypertension and logistic regression models are shown in detail in table 4. Compared with the risk in the normal population, the risk of hypertension was increased as the number of adverse body compositions increased (OR (95% CI): 1.34 (1.03 to 1.75) for one component, 2.00 (1.44 to 2.78) for two components and 5.83 (2.15 to 15.78) for OSO). Compared with the normal population, the adjusted OR (95% CI) for age in the women with OSO was 3.15 (1.13 to 8.78). After adjusting for age, ethnicity, smoking status, alcohol consumption, physical activity and menopausal status, the women with OSO also had a higher OR (95% CI) for hypertension (3.18 (1.14 to 8.88)). However, after crudely adjusting the ORs (95% CIs) for age, ethnicity, smoking status, alcohol consumption, physical activity and menopausal status, the ORs (95% CIs) for hypertension in the men aged ≥50 years with one or more components were not significant.
ORs and 95% CI of sarcopenia, obesity and osteoporosis for hypertension
Discussion
In the current study, the prevalence of hypertension in the Hmong group was the highest among the males and females in the four minority groups. In addition, the prevalence of hypertension in the men was greater than that in the women in all minority groups, except for the Jing group. Our findings reveal that the prevalence of hypertension in the four minority populations in Guangxi was higher than that in minority populations across the country.15 16 26 27 While one study conducted in Sweden involving 7936 participants aged ≥55 years indicated that people in the general population were 81% more likely to have a diagnosis of hypertension,28 the prevalence of hypertension in this study was lower. However, the prevalence of hypertension in this study was greater than that in the majority of the Chinese population, which may be associated with the increased prevalence of hypertension over time. For example, the prevalence of hypertension listed in the 2017 American College of Cardiology/American Heart Association guidelines was twice as high as that listed in the 2010 Chinese guidelines.29 Furthermore, one study conducted by Lu et al noted that lower awareness, treatment and control rates were positively associated with the prevalence of hypertension.30 Certain studies have reported that high-salt, high-fat, low-potassium and low-calcium diets are risk factors leading to hypertension.31–34 Another reasonable explanation is that these minority groups live in poverty-stricken mountainous areas characterised by the lack of healthcare knowledge and a poor healthcare environment.
However, recently, there have been a few reports about OSO, and only 25 papers were found on PubMed using ‘osteosarcopenic obesity’ as a keyword by the end of June 2018. Therefore, there are a few documents available for the estimation of the prevalence of OSO. In a Korean study involving participants aged 50 years and older, 13.50% of the men and 25.00% of the women had OSO.35 In another study involving 6889 middle-aged and elderly Koreans, 3.10% of the men and 5.37% of the women presented with OSO.36 Additionally, research conducted in over 300 Caucasian postmenopausal women revealed that more than 12% of the women were diagnosed with OSO.37 In addition, approximately 18% of the participants in Jafari Nasabian’s study of 59 healthy Caucasian women aged ≥65 years presented with OSO.38
In our study, there were sex-specific and ethnic-specific differences in the prevalence of OSO. In the female population, 3.51% of the Hmong participants, 3.15% of the Maonan participants, 1.71% of the Jing participants and 0.37% of the Yao participants had OSO. In the male population, 2.25% of the Hmong participants and 0.88% of the Maonan participants had OSO, while OSO was not found in the men in the Jing and Yao groups. A reasonable interpretation of the variability might be the influence of genetic variations, environmental factors, dietary habits and lifestyle. The Jing, Maonan, Miao and Yao populations represent four independent minority groups and could be considered isolated populations due to the prevalence of interfamilial marriage over several centuries. Deng et al noted that there were significant differences in these minority populations’ genetic backgrounds.12 Additionally, these four minority groups have a high dietary acid load; a narrative review revealed that the dietary acid load is negatively correlated with BMD, and Chan et al found that there was a slower decline in muscle mass in older adults with a lower dietary acid load.39 40 In addition, smoking and excessive alcohol consumption have a negative impact on bone health, but appropriate physical activity can help improve bone mass, muscle mass and body balance.41 42
Our findings show that hypertension is significantly associated with adverse body composition. In a paper titled ‘Obesity and hypertension in Australian young people: results from the Australian Health Survey 2011–2012’, Kim et al43 indicated that overweight and obesity are risk factors for hypertension in women (OR, 95% CI: 2.42 (1.25 to 4.68), 4.41 (2.08 to 9.36), respectively). The results of the present study show that compared with the normal population, the risk of hypertension in women with OSO was higher by 4.83-fold (OR=5.83, 95% CI 2.15 to 15.78). In addition, a study conducted by Popovic et al showed that approximately 61% of postmenopausal women with osteoporosis had hypertension, but Yang et al demonstrated that hypertension was a risk factor for osteoporosis.44 45 However, a significant difference in BMD was not found between the hypertensive and non-hypertensive groups in a study performed by Javed et al.46 In this population-based study, the results revealed that the participants with OSO or more adverse body compositions had higher risks of hypertension (OR, 95% CI: 5.07 (0.61 to 42.52) for OSO, 1.12 (0.82 to 1.52) for one component, respectively) compared with the normal population; however, a significant difference was not found in the men.
Recently, sarcopenia and sarcopenic obesity have been reported to be risk factors for hypertension, and a study conducted by Park et al revealed that the risk of hypertension was 2.48-fold higher in the sarcopenia group and 6.42-fold higher in the sarcopenic-obese group than that in the normal group.47 48 Among the female population in this study, compared with the normal population, the risk of hypertension in the participants with OSO was greater by 2.15-fold after controlling for age, and after further adjusting for ethnicity, smoking status, alcohol consumption, physical activity and menopausal status, the risk of hypertension in the women with OSO was higher by 2.18-fold and likely to be worse than that in the participants with osteoporosis, sarcopenia or obesity alone. In addition, numerous studies have reported that hypertension was an independent risk factor for cardiovascular diseases.49 50 The findings in this study revealed that women with OSO had a greater than threefold higher risk of developing cardiovascular diseases compared with the normal population, indicating that reducing the rate of OSO could decrease the prevalence of cardiovascular diseases and hypertension.
We recognise several limitations in the current study. First, the genetic and environmental statuses of these four minority groups that might affect the prevalence of OSO were not assessed. Second, because minority groups are scattered in remote mountainous areas, it is difficult to recruit a large number of participants, leading to a small sample of men. Third, given that only ALM and height were measured to diagnose sarcopenia, we believe that the true prevalence of sarcopenia in these four minority groups was underestimated compared with that obtained based on a combination of physical performance, muscle mass and strength.51 Finally, osteopenia/osteoporosis was diagnosed by ultrasound, which is not the same as dual-energy X-ray absorptiometry, which could lead to a lower or different prevalence, which may explain the lower prevalence of OSO in this study than that reported in previous studies.
Conclusion
In this work, the BMI, WHR, PBF, FM and FFM of participants with OSO were significantly greater or lower than those in the normal population. In addition, sex-specific and ethnic-specific differences in the prevalence of hypertension were found as follows: 65.77% of Hmong men, 58.79% of Hmong women, 54.82% of Maonan men, 50.00% of Maonan women, 41.92% of Jing men, 45.21% of Jing women, 53.66% of Yao men and 42.32% of Yao women had hypertension. Furthermore, the risk of hypertension was significantly increased in women with a higher number of adverse body composition components, but there was no correlation in the men with hypertension. Our findings suggest that hypertension may potentially be predicted by combined indexes of body composition and could be reduced by controlling the number of combined abnormalities in body composition, especially OSO, in midlife and late life. It is necessary to further expand the sample size of males to investigate the risk of hypertension in people with OSO among minority populations.
Acknowledgments
The authors acknowledge the people who participated in this study and are grateful for the cooperation of the participants and the support of the local government. The authors also wish to sincerely thank the researchers for their contributions to this study.
References
Footnotes
XC and CK contributed equally.
Contributors XC and CK wrote the first draft of the manuscript, helped interpret the results and critically revised the manuscript. HY and JiaG supervised the data collection and helped code the data. LL, LZ, JicG and PL helped code the data and interpret the results. LX and QD helped develop the questionnaires and interpret the results and critically revised the manuscript. All authors read and approved the final manuscript.
Funding This work was supported by grants from the National Natural Science Foundation of China (Nos. 31160222 and 31360259) and Innovation and Entrepreneurship Training Program for College Students (Nos. 201710598019, 2018286 and 201910598167).
Competing interests None declared.
Provenance and peer review Not commissioned; externally peer reviewed.
Data sharing statement No additional data available.
Patient consent for publication Not required.