Article Text

Abstract
Objective To examine the change in both the prevalence and severity of metabolic syndrome (MetS) in the Sami and non-Sami in Northern Norway due to a lack of knowledge regarding the development of MetS in this population.
Design Repeated cross-sectional study.
Setting The study is based on data from the SAMINOR 1 Survey (2003–2004, n=6550) and the SAMINOR 2 Clinical Survey (2012–2014, n=6004), conducted in 10 municipalities in Northern Norway.
Participants Men and women aged 40–79 years were invited. We excluded participants not handing in the questionnaire and with missing information concerning ethnicity questions or MetS risk factors resulting in a final sample of 6308 (36.0% Sami) subjects in SAMINOR 1 and 5866 (40.9% Sami) subjects in SAMINOR 2.
Outcome measures MetS prevalence was determined using the harmonised Adult Treatment Panel III (ATP-III) criteria, and severity was assessed with the MetS severity Z-score. Generalised estimating equations with an interaction term (survey × ethnicity) were used to compare prevalence and severity between the two surveys while accounting for partly repeated measurements.
Results The overall, age-standardised ATP-III-MetS prevalence was 31.2% (95% CI: 29.8 to 32.6) in SAMINOR 1 and 35.6% (95% CI: 34.0 to 37.3) in SAMINOR 2. Both the ATP-III-MetS prevalence and the mean MetS severity Z-score increased between the surveys in all subgroups, except the ATP-III-MetS prevalence in non-Sami women, which remained stable. Over time, Sami men showed a slightly larger increase in MetS severity than non-Sami men (p<0.001): the score increased by 0.20 (95% CI: 0.14 to 0.25) and 0.06 (95% CI: 0.01 to 0.10) in Sami and non-Sami men, respectively. Abdominal obesity increased markedly between the surveys in all subgroups.
Conclusion The prevalence and severity of MetS increased over time in rural Northern Norway. Abdominal obesity appeared to drive the increase in ATP-III-MetS prevalence. Sami men had a slightly larger increase in severity than non-Sami.
- preventive medicine
- public health
This is an open access article distributed in accordance with the Creative Commons Attribution Non Commercial (CC BY-NC 4.0) license, which permits others to distribute, remix, adapt, build upon this work non-commercially, and license their derivative works on different terms, provided the original work is properly cited, appropriate credit is given, any changes made indicated, and the use is non-commercial. See: http://creativecommons.org/licenses/by-nc/4.0/.
Statistics from Altmetric.com
Strengths and limitations of this study
This study included data from two cross-sectional surveys with acceptable attendance rates and relatively high proportions with Sami ethnicity.
The change in metabolic syndrome (MetS) over time was examined using generalised estimating equations, thus accounting for repeated measures and obtaining population averaged regression coefficients.
Ethnic differences were detected in MetS risk with a continuous severity score that were not detectable with the dichotomous definition of MetS.
A wide range of sensitivity analyses with respect to the diagnostic criteria and ethnic classification were conducted to ensure the internal validity of the study.
The results cannot be generalised to the entire Sami and non-Sami population, and we were not able to include potential confounders such as physical activity and diet.
Introduction
The co-occurrence of hypertension, abdominal obesity, impaired fasting glucose, low high-density lipoprotein (HDL) cholesterol and increased triglyceride is known as metabolic syndrome (MetS).1 MetS is viewed as a state of excess adiposity and insulin resistance1 that increases the risk of cardiovascular disease2 and type 2 diabetes mellitus (T2DM).3 The worldwide prevalence of obesity has doubled since 19804; however, excess visceral adiposity is associated with cardiometabolic abnormalities in both obese and non-obese individuals.5 Ethnic differences in body composition related to cardiometabolic abnormalities further complicate this relationship.6 The dichotomous definition of MetS has been criticised for being a crude marker of risk that more likely operates on a continuous scale, and for the lack of consensus regarding the ethnic-specific cut-offs for abdominal obesity.7 Recently, Gurka et al constructed a sex- and ethnicity-specific continuous MetS severity Z-score8 that predicts coronary heart disease9 and T2DM,10 independently of the individual MetS risk factors.
Northern Norway is inhabited by Norwegians, Sami and Kven. The Sami is an ethnic minority living in Sápmi, a settlement area covering northern parts of Norway, Sweden, Finland and Russia, and is regarded as indigenous people in Norway. The Sami culture has traditionally centred around reindeer herding, farming, fishing and hunting, but nowadays few are left in these occupations. Internationally, indigenous and minority groups have elevated prevalences of chronic lifestyle diseases compared with majority populations,11 but little to no differences in the prevalences of cardiovascular disease and MetS (using the International Diabetes Federation definition) have been found in Sami and non-Sami in Norway.12–14 However, recent data have shown unfavourable prevalences of obesity (women) and T2DM (women and men) among Sami when compared with non-Sami.15 16
We used the most up-to-date consensus definition of MetS, which is the harmonised Adult Treatment Panel-III (ATP-III) criteria,17 in addition to the MetS severity Z-score,8 to examine the prevalence and severity of MetS in Sami and non-Sami at two points in time and to examine whether variations in MetS prevalence and severity differed by ethnicity.
Methods
We used data from two cross-sectional surveys of the Population-based Study on Health and Living Conditions in Regions with Sami and Norwegian Populations—The SAMINOR Study, which is run by the Centre for Sami Health Research (CSHR) at UiT The Arctic University of Norway. The first survey (SAMINOR 1) was carried out in collaboration with the National Institute of Public Health during 2003–2004 in 24 municipalities in Northern and Central Norway.18 The SAMINOR 2 Clinical Survey (SAMINOR 2) was carried out during 2012–2014 in 10 of the municipalities included in SAMINOR 1.19 The present analyses are restricted to these 10 municipalities.
In both surveys, all inhabitants from these 10 municipalities who (1) were registered in the National Registry and (2) aged 40–79 years were invited to participate. Of all the inhabitants invited in SAMINOR 1 (n=11 518) and SAMINOR 2 (n=12 455), 6550 (56.9%) and 6004 (48.0%) individuals, respectively, attended the clinical examination and signed an informed consent (3872 participated in both surveys). The SAMINOR Project Board and The Regional Committee for Medical and Health Research Ethics approved this study.
Patient and public involvement
During the planning of the SAMINOR Study, CSHR consulted with the Sami Parliament. In addition, researchers/health workers who are either Sami or work in Sami core areas were consulted in order to meet the needs of the Sami community. In the case of abnormal findings during the examination, participants were encouraged to visit their primary physician. We intend to report the results of this study to decision makers, regional health establishments and authorities. An important aim of CSHR has always been to give the knowledge back to the participants of the study, often through popular science forums, meetings and lectures.
Self-administered questionnaire
In both surveys, information on the duration of education (years), use of blood pressure (BP) medication (currently/previously, but not now/never), DM (yes/no), alcohol consumption, physical activity and diet was taken from a self-administered questionnaire. The questions on DM were not identical (SAMINOR 1: Do you have or have you had diabetes? SAMINOR 2: Have you ever been diagnosed with diabetes (elevated blood sugar levels)?). We did not include information on self-reported alcohol consumption, physical activity or diet in the analyses, as these questions were not similar enough for comparison.
Information on ethnic background cannot be recorded in Norwegian registries or medical records, but it can be solicited for research purposes. Three main aspects of ethnicity—language, ethnic background and self-perceived ethnicity—were explored in the questionnaire through a total of 11 questions: What language do/did you/your mother/your father/[all 4 of] your grandparents speak at home?; What is your/your father’s/your mother’s ethnic background?; What do you regard yourself as? Response options were: Norwegian, Sami, Kven or other, and participants could choose more than one answer. In order to be categorised as Sami, participants had to respond that (1) their own ethnic background or self-perceived ethnicity was Sami, and (2) the home language for at least one of their grandparents, parents or themselves was Sami. All participants who did not meet these criteria were categorised as non-Sami.
Clinical examination
Trained personnel performed all clinical measurements and blood sampling using similar procedures in both surveys. BP was taken with a Dinamap-R automatic device (Criticon, Tampa, Florida, USA) in SAMINOR 1 and a CARESCAPE V100 monitor (GE Healthcare, Milwaukee, Wisconsin, USA) in SAMINOR 2, following at least 2 min of seated rest, with participants’ arms resting on a table. Three BP measurements were recorded at 1 min intervals; the average of the second and third measurements was used in the analyses. Waist circumference (WC) was recorded to the nearest centimetre at the umbilicus, with the participant standing and breathing normally. Non-fasting blood samples were drawn by venipuncture, with participants in a seated position. In SAMINOR 1, serum was sent by mail and analysed consecutively at the Ullevål University Hospital, Oslo. In SAMINOR 2, serum was frozen on site at −20°C and sent to the biobank in Tromsø, where it was stored at −70°C and later analysed at the University Hospital of North Norway, Tromsø. Lipids and glucose were measured by an enzymatic method (Hitachi 917 autoanalyzer, Roche Diagnostic, Switzerland) in SAMINOR 1, and with a homogeneous enzymatic colorimetric method (Roche/Hitachi Cobas 8000B system, Roche Diagnostics GmbH, Mannheim, Germany) in SAMINOR 2.
Criteria for MetS
MetS was defined using the harmonised ATP-III criteria, which state that a combination of any three of the following five risk factors qualifies for a diagnosis of MetS17:
Hypertension: systolic BP ≥130 mm Hg, diastolic BP ≥85 mm Hg or current use of BP medication.
Abdominal obesity: WC ≥80 cm in women and ≥94 cm in men, as recommended for a European population.5
Elevated non-fasting serum glucose ≥7.8 mmol/L. We chose this cut-off as it is a proxy for pre-diabetes defined by an oral glucose tolerance test.20 Participants with self-reported DM were also considered to have elevated glucose.
Reduced non-fasting serum HDL cholesterol: <1.3 mmol/L in women and <1.0 mmol/L in men.
Elevated non-fasting serum triglycerides ≥1.7 mmol/L.
Common approaches when estimating the severity of MetS include to simply count the number of risk factors (0–5) with levels above the cut-offs or to sum up Z-scores of the five risk factors. However, these methods do not take into account the need for different weighting of risk factors in discrete ethnic groups and the two sexes. Nor have these methods been validated regarding future disease occurrence. Therefore, we chose to estimate the severity of MetS based on an ethnicity and sex-specific, continuous Z-score (https://metscalc.org/) developed by Gurka et al in 2014. This score was constructed through confirmatory factor analyses to determine the weighted contribution of the five MetS risk factors to a latent MetS factor, with data from the NHANES survey on US adults aged 20–65 years.8 The score correlates with high levels of high-sensitivity C reactive protein, uric acid and insulin resistance,8 and predicts coronary heart disease9 and T2DM10 independent of its individual components. It operates like a Z-score, with mean 0 and SD 1, meaning that a score above/below 0 indicates a higher/lower severity of MetS than the average US adult aged 20–65 years. The score has been useful when applied in populations outside the USA as well.21–23 No cut-offs are available for the score, but this is less important in our study as our intention was to compare figures in the two ethnic groups. We used the sex-specific formula for non-Hispanic-whites for both Sami and non-Sami,8 assuming similar weighting of risk factors.
Final study sample
Of the 6550 and 6004 individuals who participated in SAMINOR 1 and SAMINOR 2, we excluded those who did not fill in the questionnaire (SAMINOR 1 n=175/SAMINOR 2 n=21); those with missing information on all ethnicity questions (n=27/n=75); and those with missing information on one or several MetS risk factors (systolic and diastolic BP, WC, glucose, HDL cholesterol and triglycerides, n=40/n=42). Thus, the final analyses included 6308 and 5866 participants, respectively. Some of these participants had missing information on education (SAMINOR 1 n=419/SAMINOR 2 n=240), use of BP medication (n=105/n=221) and DM (n=351/n=138).
Statistical analyses
All analyses were stratified by sex. Sample characteristics are presented for Sami and non-Sami participants in the two surveys; continuous variables are given as mean (SD) or median (IQR) where appropriate; categorical variables are given as numbers (percentage). In order to allow for comparison with international data, the overall prevalence for each survey was age-standardised by the direct method, using a European standard population from 2013. We compared values in the two surveys for ATP-III-MetS prevalence, MetS severity Z-score and all five MetS risk factors (seven outcomes in total) with generalised estimating equation regression models with an exchangeable working correlation matrix.24 This method gives population averaged regression coefficients while accounting for dependencies between repeated measures, as 3110 individuals participated twice (25.5% overlapping observations). The MetS severity Z-score was log-transformed in models with a skewed distribution of the model residuals. In order to make all values positive, we added 2.5, and then transformed these using the natural logarithm. Mean Z-scores were transformed back for presentation in tables. First, in order to compare values in the two surveys among Sami and non-Sami participants separately, the models were stratified by ethnicity and run with age and survey as covariates. We calculated the age-adjusted prevalence or mean of all seven outcomes using the ‘marginal’ command in STATA, holding age constant at the sex-specific mean age in both surveys together (57.49 years for women, 58.15 years for men). Second, we tested whether variations in ATP-III-MetS prevalence and MetS severity Z-score differed by ethnicity, by using interaction terms (ethnicity x survey) in models that were not stratified by ethnicity. The interaction term was excluded from a model if p≥0.05. All statistical tests had a two-sided significance level of 0.05.
Sensitivity analyses
In order to avoid spurious conclusions, we performed a wide range of sensitivity analyses, as recommended in ethnic health research.25 We repeated the analyses with
Alternative cut-offs for ATP-III-MetS risk factors: (1) WC ≥88 cm in women and ≥102 cm in men; (2) excluding WC, so those having ≥3 of 4 remaining risk factors qualified as ATP-III-MetS; (3) glucose ≥11.1 mmol/L; (4) triglycerides ≥2.1 mmol/L.26
A ‘healthier’ sample, excluding participants that currently used BP or DM medication (tablets or insulin), or if they reported ever having had a myocardial infarction, angina pectoris or DM.
Two alternative measures of ethnicity: (1) answered ‘Sami’ on all 11 questions, answered ‘Sami’ on 1–10 questions, did not answer ‘Sami’ on any question; (2) solely based on self-perceived ethnicity.
Stratification by geographical regions (Inland Finnmark County, coastal Finnmark County and Troms/Nordland County).
Adjustment for education.
We used STATA V.15.1 for all statistical analyses. Graphics were created using the ‘ggplot2’ package for the open-source statistical software R V.3.4.2 (The R Foundation for Statistical Computing, URL https://www.R-project.org/).
Results
The proportion of Sami in SAMINOR 1 and SAMINOR 2 was 36.0% and 40.9%, respectively. On average, the SAMINOR 2 participants were older than the SAMINOR 1 participants, had a longer education, higher prevalence of self-reported DM and larger WC (table 1).
Sample characteristics stratified by sex, ethnicity and survey, given in mean (SD) or n (%)
The overall, age-standardised prevalence of MetS was 31.2% (95% confidence interval [CI]: 29.8 to 32.6) in SAMINOR 1 and 35.6% (95% CI: 34.0 to 37.3) in SAMINOR 2 (data not shown).
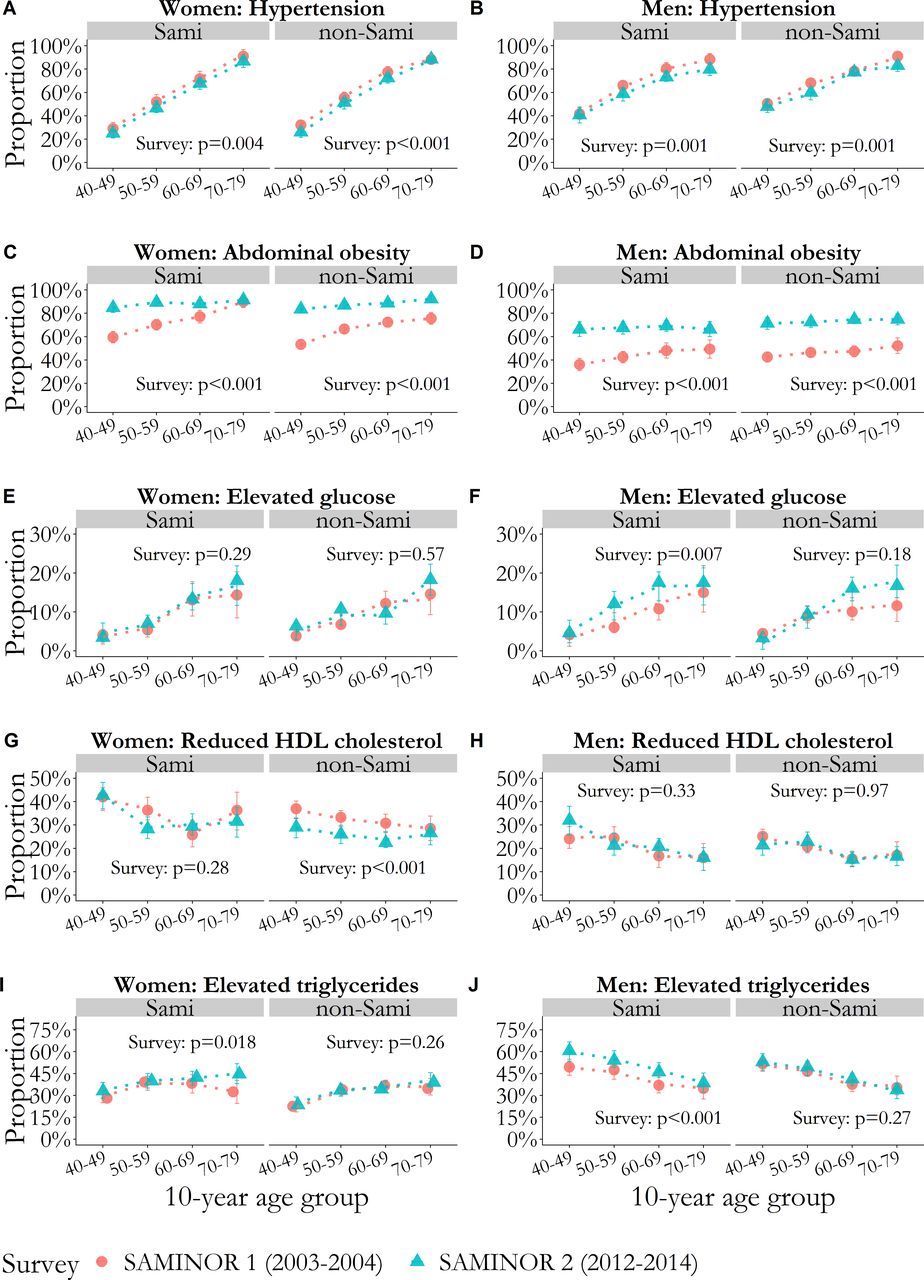
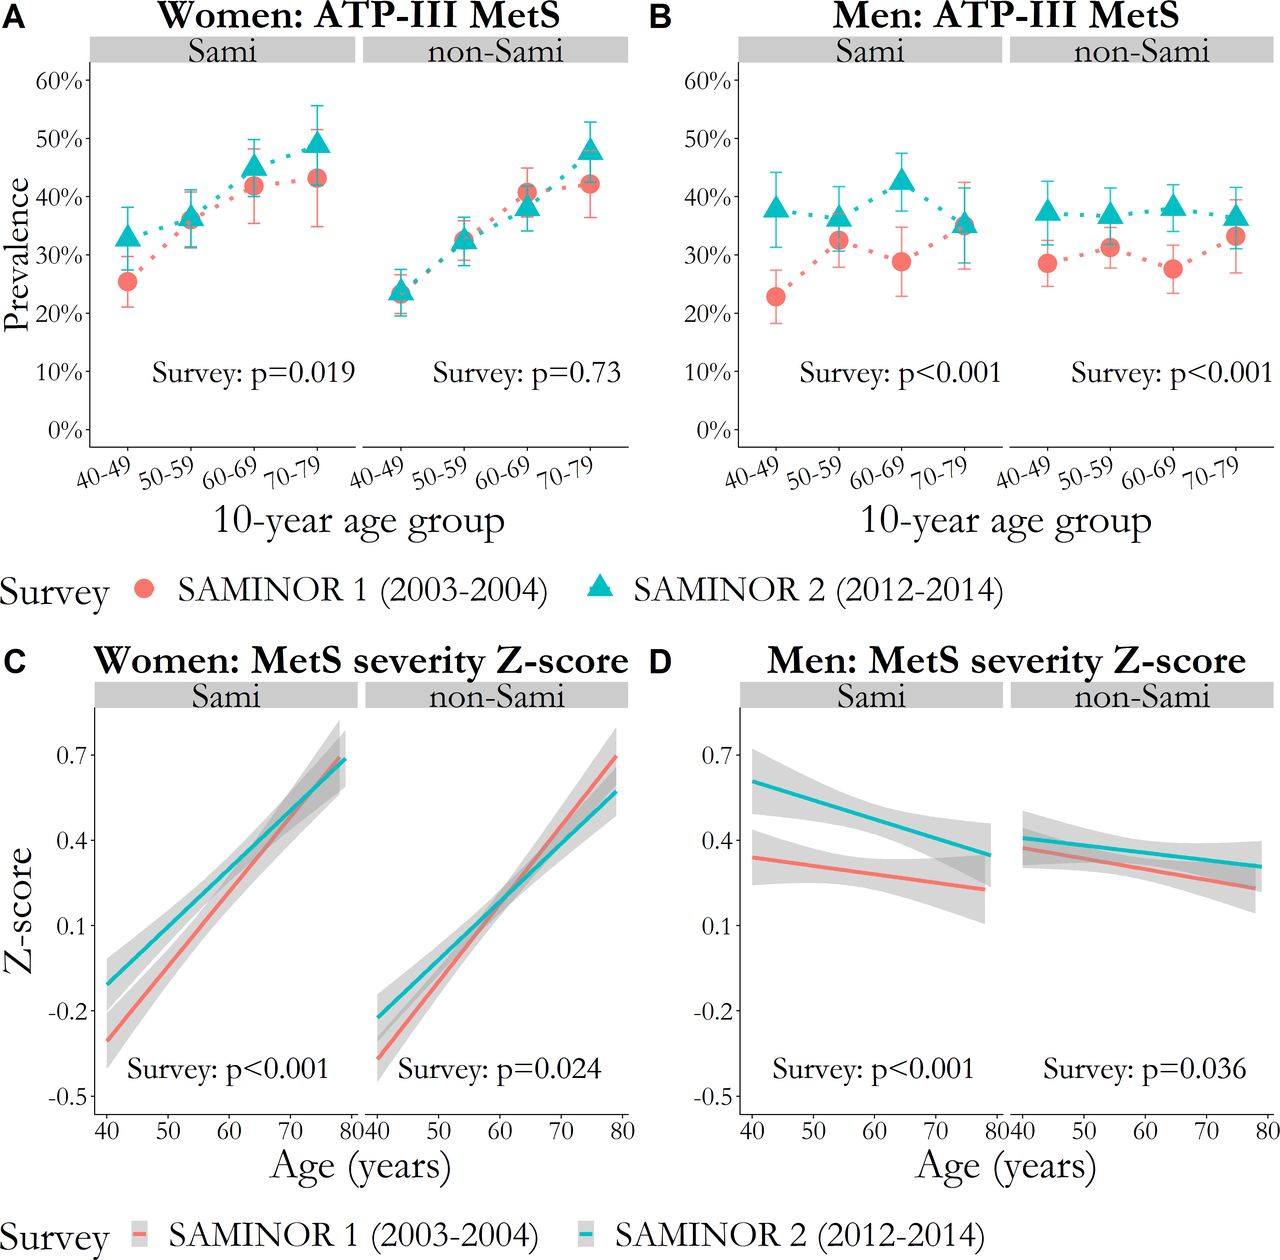
The age-adjusted proportion of hypertension decreased modestly from SAMINOR 1 to SAMINOR 2, whereas the proportion of abdominal obesity increased markedly in all four strata of sex and ethnicity (between +15.3 percentage points (pp) and +26.4 pp). The proportion of elevated triglycerides increased markedly among both Sami women (+4.2 pp) and men (+9.1 pp). Both ATP-III-MetS prevalence and MetS severity Z-score increased in all strata of sex and ethnicity, except for ATP-III-MetS in non-Sami women, which remained unchanged. In absolute numbers, ATP-III-MetS prevalence increased the most among Sami and non-Sami men (+8.2 pp and +7.5 pp, respectively, p<0.001 for both), whereas MetS severity Z-score increased the most among Sami women and Sami men (+0.13 and +0.21, respectively, p<0.001 for both) (table 2).
Age-adjusted proportion or mean (95% CI) of five MetS risk factors, ATP-III MetS and MetS severity Z-score in Sami and non-Sami in the SAMINOR 1 Survey (2003–2004, n=6308) and the SAMINOR 2 Clinical Survey (2012–2014, n=5866)
In the models assessing whether variations in ATP-III-MetS prevalence and MetS severity Z-score between the surveys differed by ethnicity, interactions between ethnicity and survey were found for MetS severity, with Sami men having a larger increase than non-Sami men (p<0.001) (table 3). From the first to the second survey, the score increased by 0.20 (95% CI: 0.14 to 0.25) in Sami men and 0.06 (95% CI: 0.01 to 0.10) in non-Sami men (data not shown). In women, the interaction term between ethnicity and survey was also significant (p=0.024), but the difference in effect size was negligible (table 3).
Sex-stratified GEE models examining potential interactions between survey and ethnicity for ATP-III MetS and MetS severity Z-score
Abdominal obesity increased across all age groups in all strata of sex and ethnicity between the surveys (figure 1). The MetS severity Z-score increased more in Sami men than in non-Sami men (figure 2).

Proportion with values above the cut-off for each cardiometabolic risk factor comprising metabolic syndrome (A–J), per 10-year age group, with vertical error bars (95% CI). P values for the survey are age-adjusted and were obtained with GEE logistic regression. Models were stratified by sex and ethnic group. (A and B) Hypertension defined as systolic blood pressure ≥130 mm Hg, diastolic blood pressure ≥85 mm Hg or current use of blood pressure medication. (C and D) Abdominal obesity defined as waist circumference ≥80 cm in women and ≥94 cm in men. (E and F) Elevated glucose defined as glucose ≥7.8 mmol/L or self-reported diabetes mellitus. (G and H) Reduced HDL cholesterol defined as HDL cholesterol <1.3 mmol/L in women and <1.0 mmol/L in men. (I and J) Elevated triglycerides defined as triglycerides ≥1.7 mmol/L. GEE, generalised estimating equation; HDL, high-density lipoprotein.

P values for survey are age-adjusted and were obtained with GEE logistic or linear regression. Models were stratified by sex and ethnic group. (A and B) Prevalence of MetS defined by the harmonised ATP-III criteria, per 10-year age group with vertical error bars (95% CI). (C and D) Mean of MetS severity Z-score as a function of age with 95% CI bands shaded in grey. ATP-III, Adult Treatment Panel III; GEE, generalised estimating equation; MetS, metabolic syndrome.
Overall, sensitivity analyses, including alternative ethnic classifications, region and education, did not change the conclusions (data not shown). Results in Sami women were sensitive to alterations in cut-offs for ATP-III-MetS risk factors. Excluding abdominal obesity from the ATP-III-MetS criteria left only Sami men with a minor increase in prevalence (+3.5 pp, p=0.014) (see the online supplementary table 1). The interaction between ethnicity and survey for MetS severity was confirmed in the ‘healthier’ sample (in women and men) and using alternative ethnicity classifications (only in men) (data not shown).
Supplemental material
Discussion
From 2003–2004 to 2012–2014, we observed an increase in both the prevalence (based on ATP-III criteria) and the severity of MetS in rural Northern Norway. The increases in prevalence were largest in men and were confirmed by sensitivity analyses. Non-Sami women had stable measures of MetS prevalence, but a small increase in MetS severity. Sami of both sexes had a slightly larger increase in MetS severity than non-Sami; this finding was most pronounced and most robust in men. Abdominal obesity increased markedly in all strata of sex and ethnicity.
Strengths and limitations
The relatively large sample size (n=6308 and n=5866) is a strength of our study, and we had an acceptable attendance rate (54.8% and 47.1%). In general, non-attendance was high among men aged 40–49 years. We could not evaluate ethnicity-specific non-attendance rates, as national registers do not record ethnicity. Due to design issues and varying response rates across municipalities, the SAMINOR 1 sample includes a lower proportion of people from Sami majority areas in Finnmark County and a higher proportion from Northern Troms County as compared with the SAMINOR 2 sample. These different geographic and ethnic compositions challenge our ability to compare the samples, nor can we generalise the results of this study to the entire Sami and non-Sami population. Analyses of participants excluded due to missing data (n=242 in SAMINOR 1, n=138 in SAMINOR 2) revealed that they were older, had lower education and had a slightly worse cardiometabolic profile; we could not determine if this varied by ethnic belonging. An important weakness in our study is that blood samples were non-fasting, as the time schedule was distributed during the entire day. Lipid levels vary little according to fasting state, except mean triglycerides levels, which have been found to vary around 20% between different fasting states.24 A more important issue is that using non-fasting glucose as a diagnostic tool is not valid regarding neither pre-diabetes nor diabetes. HbA1c was available in SAMINOR 2 only, such that in order for us to make comparisons between the surveys, we had to choose non-fasting glucose. Other weaknesses included self-reported DM status and drug use and the lack of socioeconomic factors other than education. However, the internal validity of this study is high. We performed a wide range of sensitivity analyses with alterations in cut-offs for MetS risk factors, restricted samples and ethnic classification. We assumed that the prevalence and severity of MetS could be defined in the same way in Sami and non-Sami, thus, our results would be invalid if these assumptions were revealed to be incorrect. Despite the limitations, we believe that we have added novel information on cardiometabolic health by utilising a MetS severity Z-score.
Comparison with other studies
The overall ATP-III-MetS prevalences we report in this study from rural Northern Norway were much higher than that reported in the sixth survey of the Tromsø Study (2007–2008, 22.6%), which sampled from an urban area in Northern Norway.27 Thus, regional differences in MetS may be larger than ethnic differences in MetS in rural areas. Consequently, public health efforts to reduce the burden of MetS risk factors should focus more on the region than on ethnicity. The ATP-III-MetS prevalences we found were also higher than those reported in other Arctic populations, such as the Greenland Inuit,28 the Yup’ik Eskimo29 and indigenous Nenets women in Russia.30 However, valid comparisons of MetS prevalences are challenging due to differences in study years, age distributions, MetS criteria and fasting versus non-fasting blood samples. Decreases in hypertension and increases in abdominal obesity have been reported both nationally and internationally.31–33 Abdominal obesity, which appeared to be the driving force behind the increased ATP-III-MetS prevalences in our study, was present in nearly 90% of women and in more than two-thirds of men in 2012–2014. The cut-offs for waist circumference that we used are quite strict, such that we found a large proportion with abdominal obesity with only one or no additional MetS risk factors. Nevertheless, general obesity (body mass index ≥30 kg/m2), without MetS, is known as metabolically healthy obesity and has been reported to confer significant risk of cardiovascular disease and T2DM in long-term follow-up studies.34 35 As research has indicated that metabolically healthy obesity is an unstable condition,36 efforts should be made to prevent weight gain and promote weight loss in all obese individuals, regardless of MetS presence.
Possible implications of ethnic differences
The ethnic differences in the change of MetS severity from 2003–2004 to 2012–2014, were more robust in men than in women. The MetS severity increased by 0.20 (95% CI: 0.14 to 0.25) in Sami men and 0.06 (95% CI: 0.01 to 0.10) in non-Sami men, which is a modest difference. However, in a longitudinal study it was shown that irrespective of baseline MetS severity Z-scores, individuals with a change of ≥0.5 in this score had an increased risk of T2DM compared with those with a change of ≤0.10 Moreover, in a cohort study that followed nearly 300 000 individuals for 25 years, subtle elevations in metabolic risk factors (obesity, glucose and triglycerides) were observed decades before T2DM onset.37 Thus, even minor differences may be indicative of future differences in DM. As the differences between Sami and non-Sami men are small in our study, we are reluctant to speculate in detail what the implications of the results are. But, a few previous findings are interesting in the light of our results. In 1974–1975, Sami in Finnmark County had a reduced risk of T2DM compared with non-Sami.14 However, in 2012–2014, a study from Northern Norway, including parts of Finnmark, Troms and Nordland counties, reported that Sami had a higher prevalence of self-reported T2DM than non-Sami; this was evident in both sexes.16 Conversely, no ethnic differences in the 10-year risk of non-fatal cardiovascular disease or self-reported myocardial infarction was found in rural Northern Norway.12 38 In fact, both ATP-III-MetS and MetS severity Z-score have stronger associations with T2DM than with coronary heart disease.2 3 9 10 The MetS severity Z-score has the highest factor loadings for HDL cholesterol and triglycerides,8 which probably explains why this score increased more among Sami, as there was ethnic heterogeneity in the distribution of these two MetS risk factors. In sum, available research may indicate a more detrimental metabolic development associated with T2DM in Sami than in non-Sami men.
Possible explanations for ethnic differences
Prior to a discussion on possible explanations for the ethnic differences, we emphasise that they are quite small. In an international perspective, it is not common to observe such small differences between an indigenous population and the majority reference population. We speculate that our positive findings may be explained by the fact that the Sami and non-Sami mostly live side-by-side in the same geographical areas. Thus, important social determinants of health, such as education, job opportunities and health services, should be equally available independent of ethnicity. We also reiterate that regional differences may be of a much larger magnitude than the ethnic differences27 and this calls for continued public health surveillance in rural Northern Norway. Further, in an effort to explain ethnic health differences, one should keep in mind that ethnicity comprises an interplay between lifestyle, geography, culture and possibly genetics. It is likely that lifestyle factors such as diet and physical activity—which are strongly associated with MetS development39—mediate, at least to some degree, the (weak) association between ethnicity and MetS. There are some studies on differences in physical activity and dietary habits in Sami and non-Sami,40–42 but they are both insufficient (ie, no information on the total level of physical activity) and cross-sectional. Unfortunately, we were not able to include such variables in our analyses. A complex facet of ethnicity is represented by potential differences in body composition6; thus, if such a difference exists between Sami and non-Sami, it could have led us to misclassify some participants as obese. For instance, the Greenland Inuit have a more favourable cardiometabolic profile and lower amounts of visceral adipose tissue at the same level of obesity as Danes.43 44 On average, Sami have a shorter stature than non-Sami, and when adjusting for waist-to-height-ratio, the differences in T2DM between Sami and non-Sami in SAMINOR 2 were eliminated.16 Finally, we emphasise that there is heterogeneity in all aspects comprising ethnicity within the Sami population, just as there is heterogeneity between the Sami and the non-Sami. Our results suggest that further research on the ethnic differences in the adiposity-related MetS risk profile in rural Northern Norway is warranted.
Conclusion
We found a high burden of MetS in rural Northern Norway. From 2003–2004 to 2012–2014, both the prevalence (ATP-III-MetS) and the severity (Z-score) of MetS increased in the 10 selected municipalities. The largest increases in prevalence were observed in Sami and non-Sami men. In Sami men, the increase in MetS severity was slightly larger than in non-Sami. Abdominal obesity appeared to be the driving force behind the increase in ATP-III-MetS and should be a public health target regardless of ethnicity or MetS presence.
Acknowledgments
This study would not have been possible without the participants of the SAMINOR Study, and the authors are grateful for their participation.
References
Footnotes
Contributors The idea behind the study was conceived by ARB. VLM performed all the data analyses, produced the tables and the figures, and drafted the manuscript. SRAS and MM guided and assisted in the data analyses and the interpretation of the results. KK, JS and ARB were involved in the design of the study, the preparation for the data analyses and the interpretation of the results. All authors were involved in revision of the manuscript and approved the final version.
Funding This work was supported by The Norwegian Ministry of Health and Care Services, the Northern Norway Regional Health Authority, the Regional Research Fund of Northern Norway, the Sami Parliament, the Sami Norwegian National Advisory Unit on Mental Health and Substance Use, and the Finnmark, Troms, and Nordland county councils. The publication charges for this article have been funded by a grant from the publication fund of UiT The Arctic University of Norway.
Competing interests None declared.
Ethics approval The SAMINOR Project Board and The Regional Committee for Medical and Health Research Ethics approved this study.
Provenance and peer review Not commissioned; externally peer reviewed.
Data sharing statement The data that support the findings of this study are available from the SAMINOR Study (www.saminor.no), but restrictions apply to the availability of these data, which were used under license for the current study, and so are not publicly available. Data are however available upon reasonable request to the SAMINOR Project Board and with permission of the Regional Committee for Medical and Health Research Ethics.
Patient consent for publication We used data fromparticipants that have consented to participate in the SAMINOR Study. Patient consent for publication specifically is not required.