Article Text

Abstract
Objective To develop a short self-report instrument for the assessment of expectations (Expectation for Treatment Scale(ETS)) using acupuncture as a case example.
Design A cross-sectional assessment with retest after 1 week.
Setting A web-based survey with patients suffering from pain.
Methods In a three-step approach, we reduced the initially collected number of items from 17 to 9 and to 5, including expectations about coping ability, vitality, physical health and reduction of patient complaints. Items were selected according to internal consistency (Cronbach’s alpha); convergent and divergent validities with related constructs (optimism, pessimism, resilience, perceived sensitivity to medicines, depression and others); 1-week retest reliability (intraclass correlation coefficient (ICC)); and exploratory and confirmatory factor analysis (CFA).
Results A total of 102 patients suffering from pain were included, and 54 of these patients completed the retest assessment. The final version of the ETS consisted of five items and had an excellent Cronbach’s alpha (0.90), with 72.33% variance on one single factor. Depression, pessimism and perceived sensitivity to medicines showed positive correlations with our expectation measure (r=0.23, r=0.20 and r=0.34, respectively); the correlation between the ETS and optimism was low (r=−0.07) and no correlation between the ETS and resilience was found (r=−0.07). Convergent validity was confirmed with a high correlation (r>0.90) between ETS and a treatment-specific measure of expectations. The retest ICC was 0.86, which showed high stability over 1 week. A CFA (n=439) with data from patients with low back pain confirmed the single-factor structure of the instrument.
Conclusion The ETS showed strong psychometric properties and covered a distinct construct. As the next step, the ETS might be implemented in different clinical conditions and settings to investigate psychometrics and its predictive power for treatment outcomes.
- expectations
- placebo
- assessment
- pain
- optimism
- acupuncture
This is an open access article distributed in accordance with the Creative Commons Attribution Non Commercial (CC BY-NC 4.0) license, which permits others to distribute, remix, adapt, build upon this work non-commercially, and license their derivative works on different terms, provided the original work is properly cited, appropriate credit is given, any changes made indicated, and the use is non-commercial. See: http://creativecommons.org/licenses/by-nc/4.0/.
Statistics from Altmetric.com
Strengths and limitations of this study
This is the first project to systematically develop a general measure to assess patients’ expectations across medical conditions and treatments with the involvement of patients, earlier scales and empirical data.
The Expectation for Treatment Scale (ETS) is a short and reliable measure that captures outcome-related expectations of patients.
The association between the ETS and related constructs was explored.
The development of the ETS was done via an online survey with patients suffering from pain, and the initial findings were confirmed using confirmatory factor analysis in a patient sample with low back pain.
The transfer of the ETS in different clinical conditions and settings should be pretested to explore whether patients can evaluate the respective treatment at this level.
Introduction
Patients’ expectations alter responses to interventions in placebo research and in clinical studies. In experimental research, the instruction to receive an active intervention accompanies large effects on pain reduction (effect size=0.75).1 Expectations can be considered a major driver of changes in symptoms and other health-related outcomes.2 Clinical studies have revealed that patients’ positive expectations are related to reduced pain after a medical treatment,3–5 and this phenomenon has also been observed for other medical conditions.6 For acupuncture, this association was investigated in several studies with heterogeneous findings: patients with chronic pain had higher odds (OR 2.11, 95% CI 1.32 to 3.34) of benefitting from acupuncture treatment if they expected a better treatment response at baseline (controlled for other clinical baseline characteristics).7 However, there are also studies that found no influence of expectations on the outcome.8 9
These differences in the association of expectations and outcomes might be partly explained by the fact that each study used a newly invented measure, and differences between measures might hide or exaggerate associations between expectations and intervention outcomes. Additionally, the match between expectations of patients and treatment providers might be relevant for the success of a specific treatment.10
Expectation is a well-known and oft-used term. A clear definition and a sharp distinction from associated constructs is important for the development of a measure.11 In the context of medical treatments, the term ‘expectations’ describes cognitions about treatment-related health outcomes in the future after a specific intervention.12 13 Patients can consider a treatment more or less beneficial for their complaints or disease at a specific time-point (ie, outcome expectations).13 Role expectations also capture the role of a patient and the therapist during the treatment. In other words, a patient might consider himself rather inactive during treatment in defining treatment goals and expects an active therapist to achieve a good treatment outcome. However, our purpose was to develop a scale on ‘patient expectations’ that covers treatment-related outcome expectations. Bowling et al 14 provide an insightful summary about the theoretical underpinning of expectations. Following the definition by Bowling et al,14 we therefore designed our measure to assess expectations related to a clinical intervention with a clinically relevant outcome from a patient’s perspective.
Earlier findings about the expectation outcome association in clinical studies have been limited by the diversity of measures. Several authors claimed diversity in covered concepts, time-point of assessment and problems to evaluate the validity of the measures.15–17 A strong measure is a prerequisite to accurately predict treatment responses based on pretreatment expectations. A closer investigation of the results from a systematic review about acupuncture expectation measures by Prady and colleagues18 showed that of 10 trials, only 5 provided their exact item wording for measuring expectations. Because many of the assessment instruments are not publicly available, it is difficult to replicate the studies. Three of the five mentioned studies used only one item to assess expectations. There is no reporting at all of Cronbach’s alpha in the two remaining studies.
For further research in the field of expectations, a strong measure with high acceptance across clinical fields would be needed for several reasons. First, a reliable measure with high internal consistency at a specific time-point is a prerequisite to use expectations as a robust predictor. Second, ceiling effects are a common problem in the measurement of expectations, because patients who are seeking help from a specific treatment often expect large benefits; otherwise, they would not be attracted by this treatment. This problem was apparent in an established expectation measure for acupuncture treatment that served as a benchmark measure for our scale (Acupuncture Expectancy Scale (AES)).19 Ceiling effects are particularly problematic because the predictive power of such skewed variables is low. In the case of expectations, many research questions address the prediction of treatment outcomes; therefore, a measure with sufficient variation between patients is needed. Some authors have used the term ‘realistically expect’ to capture expectations in a recent study with a comprehensive 10-item assessment of expectations, hope and beliefs (EXPECT)20 with limited internal consistency. Third, a measurement of expectation should be stable in a reasonable time frame: the EXPECT scale showed only a moderate retest reliability, with an intraclass correlation coefficient (ICC) of 0.75. Most importantly, the association of EXPECT with the established AES, a benchmark measure for the field of acupuncture, was unexpectedly low (r=0.54).
This study aimed to develop a measure to reliably capture patient expectations with a short scale. The newly developed scale (Expectation for Treatment Scale (ETS)) ideally has a strong association with available measures of expectations, moderate associations with related constructs (eg, optimism and pessimism) and no association with personality (eg, neuroticism). Furthermore, it should be constructed such that it can be adapted to other treatments and used universally in different clinical fields independent of patients’ complaints.
Methods
To address the problem of the abovementioned ceiling effects, we developed the items of our scale (ETS) in a pilot study with patients suffering from pain in our outpatient clinic to measure expected benefits before treatment from the patient’s perspective. Based on existing questionnaires on patient expectations,9 19 21–24 we created a list of 17 items covering different facets of expectations that fit with our aim to develop a measure for treatment-related outcome expectations. We had been particularly interested in questionnaires from the field of acupuncture research and other non-pharmacological interventions, and the questions should be applicable in an applied context. The first and senior author was responsible for the selection of these items.
Patient and public involvement
Twenty patients completed the questionnaires, provided sociodemographic information and were asked for written comments about the accessibility of the questions. In addition, two patients were interviewed by a qualitative researcher. Two health professionals (one acupuncturist and a doctor assistant) also verbally commented about the appropriateness of the questions. Based on these data, we selected items with low skewness and a large range of responses (ie, variation). High correlations between items and the findings from the qualitative feedback were also considered.
Participants
For the main validation, study subjects of the convenience sample were recruited using different methods. Three regional patient organisations distributed the information, and we used several email distribution lists (including the University of Zurich, Switzerland, and the Charité University Hospital Berlin, Germany). Furthermore, patients from the previous year seeking treatment for a musculoskeletal condition at the Institute for Complementary and Integrative Medicine of the University Hospital Zurich were contacted by email. All participants were required to be at least aged 18 years and, according to their own evaluation, have sufficient knowledge to understand German. The included patients suffering from pain had to suffer from at least some pain at the day of the assessment (>0 on a numeric rating scale from 0 (no pain) to 10 (worst pain)).
The study link was accessed by 522 subjects, and 244 started the survey. In total, 142 subjects were excluded due to insufficient pain (n=113), missing data in the nine-item version of the ETS (n=14) and more than 20% missing responses across all items (n=13). Data from patients suffering from pain (n=102) with retest data from 54 patients were available.
Procedures
Subjects who decided to participate activated an access link to the online survey provided via email. The survey was hosted by the specific website (https://www.soscisurvey.de/) and all data were collected electronically and anonymously. Participants were able to complete the survey within 15 min. All questions were created in a forced choice format, meaning that subjects were not able to continue to the next set of questions without completing the previous set. On starting the survey, a short welcome message, followed by an introduction to the study, was provided. Subjects who agreed to be contacted again for the retest assessment provided their email address at the end of the survey. The retest sample received a follow-up ETS 1 week after completion of the first survey.
Measures
The survey included demographic information (age, gender, education, employment status and country of residence); questions about any previous experience with acupuncture (current or earlier); the degree to which the acupuncture treatment was successful (numeric rating scale from 1 to 10, indicating no success to much success) and the reason for the treatment (pain, mental health or non-specific). Patients who suffered from pain (binary variable with yes vs no option) were asked to give information about their pain. We assessed average pain intensity (numeric rating scale from 1 to 10, indicating no pain to worse pain); whether a physician was consulted; whether any other type of therapy was used and the number of days of restriction due to pain. Subsequently, subjects completed the nine-item ETS. Below, we provide a detailed description of all measures in this study.
Expectation for Treatment Scale
The first version of the ETS consisted of nine items (eg, ‘I expect the treatment (acupuncture) will help me to cope with my complaints.’). Each item was to be rated on a 4-point scale ranging from 1 to 4 (partially disagree, partially agree, agree and definitely agree). We decided to use a 4-point scale instead of a 5-point scale for two reasons. First, the chosen format forces the patient to provide an answer with a direction (higher or lower than the middle answer choice) instead of opting for the middle category, which often occurs in situations of insecurity (such as the present estimation of future events).25 Second, the lowest answer on the scale of ‘definitely disagree’ can be considered unexpected for patients motivated to undergo an acupuncture treatment. After the statistical analyses, the nine-item version was reduced to a final five-item version of the ETS. A detailed description of these five items is provided in online supplementary appendix table 1. These five items were translated into English by two bilingual researchers and were translated back into German by two other bilingual researchers. The wording was improved based on feedback from Dr George Lewith. The final English version is presented in online supplementary appendix table 1.
Supplemental material
Optimism and pessimism
Both concepts were assessed using the German version of the Life Orientation Test—Revised.26 The questionnaire consists of six self-report items (plus four filler items), each rated on a 5-point Likert scale ranging from 0 (strongly disagree) to 4 (strongly agree). The data were separated into optimism and pessimism scores, as recommended by Glaesmer et al.26 Each score can range from 0 to 12, with higher values indicating either higher optimism or pessimism. In the present study, Cronbach’s alpha was acceptable for optimism (0.72) and questionable for pessimism (0.60).
Depression
The Patient Health Questionnaire-9 (PHQ-9) is widely used as a standard instrument for diagnosing depression in primary care and is considered well validated.27 The PHQ-9 consists of nine questions operating according to the modified Diagnostic and Statistical Manual, Fourth Edition criteria. Patients indicated their answers on a scale ranging from 0 (not at all) to 3 (almost every day).28 A higher score indicates a higher severity of depressive symptoms (ranging between 0 and 27). In the present study, the internal consistency of the scale was excellent (Cronbach’s alpha=0.90).
Resilience
As a protective personality factor, resilience was appraised using the Resilience Scale.29 In the current study, we used the German Version Resilienzskala (RS-11).30 The instrument consists of 11 questions, with seven response alternatives ranging from 1 (disagree) to 7 (fully agree). Higher scores indicate higher resilience. In the present study, the internal consistency was excellent (Cronbach’s alpha=0.90).
Body efficacy expectation (BEE)
To measure beliefs concerning bodily coping capabilities, the BEE questionnaire31 was used. The instrument consists of five items using a 4-point Likert scale ranging from 1 (not true at all) to 4 (exactly true). A higher score indicates stronger beliefs in one’s bodily coping capabilities. In the present study, Cronbach’s alpha was 0.75, indicating acceptable internal consistency.
Perceived sensitivity to medicines
To assess the individual’s sensitivity to medicines, we used the Perceived Sensitivity to Medicines Scale (PSM).32 The PSM scale is considered a reliable and valid measure composed of five self-report questions to assess perceived sensitivity to the potential adverse effects of medicines. Responses are scored on a 5-point Likert scale, and patients’ item scores are summed to provide a total score ranging between 5 and 25. Higher scores point towards a high perceived sensitivity to the potential adverse effects of medicines. In the current study, the scale showed excellent internal consistency (Cronbach’s alpha=0.94).
Neuroticism and openness to experience
To assess the distinctiveness of neuroticism and openness to experience among patients, we used the corresponding subscales of the NEO Five-Factor Inventory (NEO-FFI).33 To that end, 23 questions were extracted from the 60-item NEO-FFI. The instrument uses a 5-point Likert response format, from 1 (strongly refuse) to 5 (strongly agree). A higher score indicates a higher value for neuroticism and openness to experience. In the present study, Cronbach’s alpha was 0.85 for neuroticism and 0.72 for openness to experience, which indicate good to acceptable internal consistency.
Acupuncture expectancy scale
Mao and colleagues developed the AES to measure patients’ expected response from acupuncture.19 The scale was developed for only one clinical intervention (ie, acupuncture). The instrument consists of four items. The answers are given using a 5-point Likert scale ranging from 1 (not at all agree) to 5 (completely agree). A higher score points towards higher expectancies. In the present study, the internal consistency of the scale was considered good (Cronbach’s alpha=0.88).
Statistical analyses
All data analyses were executed using SPSS V.22. As a first step, we used the nine items of the first ETS version to explore homogeneity and diversity between items. We conducted a descriptive analysis of the data to detect possible floor or ceiling effects and to assess the distribution of the data. Internal consistency was examined through reliability analyses (Cronbach’s alpha), with the corrected item-total correlation and Cronbach’s alpha if the item was deleted. Retest reliability for the nine items was assessed by the ICC. We set for each item a minimal acceptable ICC of 0.60 and for the total score an ICC of 0.80. Three criteria guided the decision to keep an item for the final version: (1) it should have a high corrected item-total correlation and no low internal consistency if deleted; (2) the item should not overlap too strongly in content with another item that might be included and (3) the item should not contribute to ceiling effects in the final version of the scale, which means items with lower values were preferred.
In the second step, we used the reduced version of the scale to generate a total sum score of the five items (ranging from 5 to 20). To examine divergent and convergent validities, correlations between the ETS sum score and the other measures were calculated. The selection of measures was based on theoretical assumptions: with another measure of expectations (AES), we hypothesised very high correlations, since three of the five items of the ETS cover similar topics as the AES (coping, disappearance of complaints and energy) even though instruction and response options differ. We assumed a very high correlation between the ETS and the most strongly related construct (correlation about 0.70, AES) and a moderate correlation with strongly related constructs (correlation about 0.30, Life Orientation Test (LOT-R) optimism, inverse with LOT-R pessimism). Optimism can be viewed as a trait characteristic of a person with high stability over time and situations. Optimism is defined as ‘the extent to which people hold generalised favourable expectancies for their future’ (Carver et al,34 p879). We included optimisms and the counterpart pessimism to assess the overlap between expectation and this personality trait.
Smaller correlations with less related constructs (correlation about 0.20; PHQ-9, RS-11 and BEE) were assumed. Explanatory styles (ie, expectation about future events) are associated with depressed mood with similar correlations.35 Self-efficacy is also a construct at a general level (ie, ‘Perceived self-represents an optimistic sense of personal competence […]’; Scholz et al,36 p342). If self-efficacy is related to a specific behaviour or problem, it captures the strength of a belief to cope in a situation successfully (eg, Pain Self-Efficacy Questionnaire).37 In our study we used the BEE since this scale assess the ‘conviction that one’s body is able to heal and take care of itself by dealing with pathogens and other health-threatening demands on its own’ (Schützler and Witt,31 p2). Resources for health also capture positive beliefs on how to deal with a difficult situation in life. We hypothesised for both dimensions only low correlations since such resources are rather general and neither related to a specific disorder nor to a specific time-point in life. Finally, we assumed no correlation with unrelated constructs (PSM, NEO-FFI neuroticism and NEO-FFI openness to experience); however, we wanted to assess these dimensions since the ETS might be used in upcoming placebo/nocebo research, and several studies have shown that these dimensions are possibly related to placebo/nocebo responses.38 39
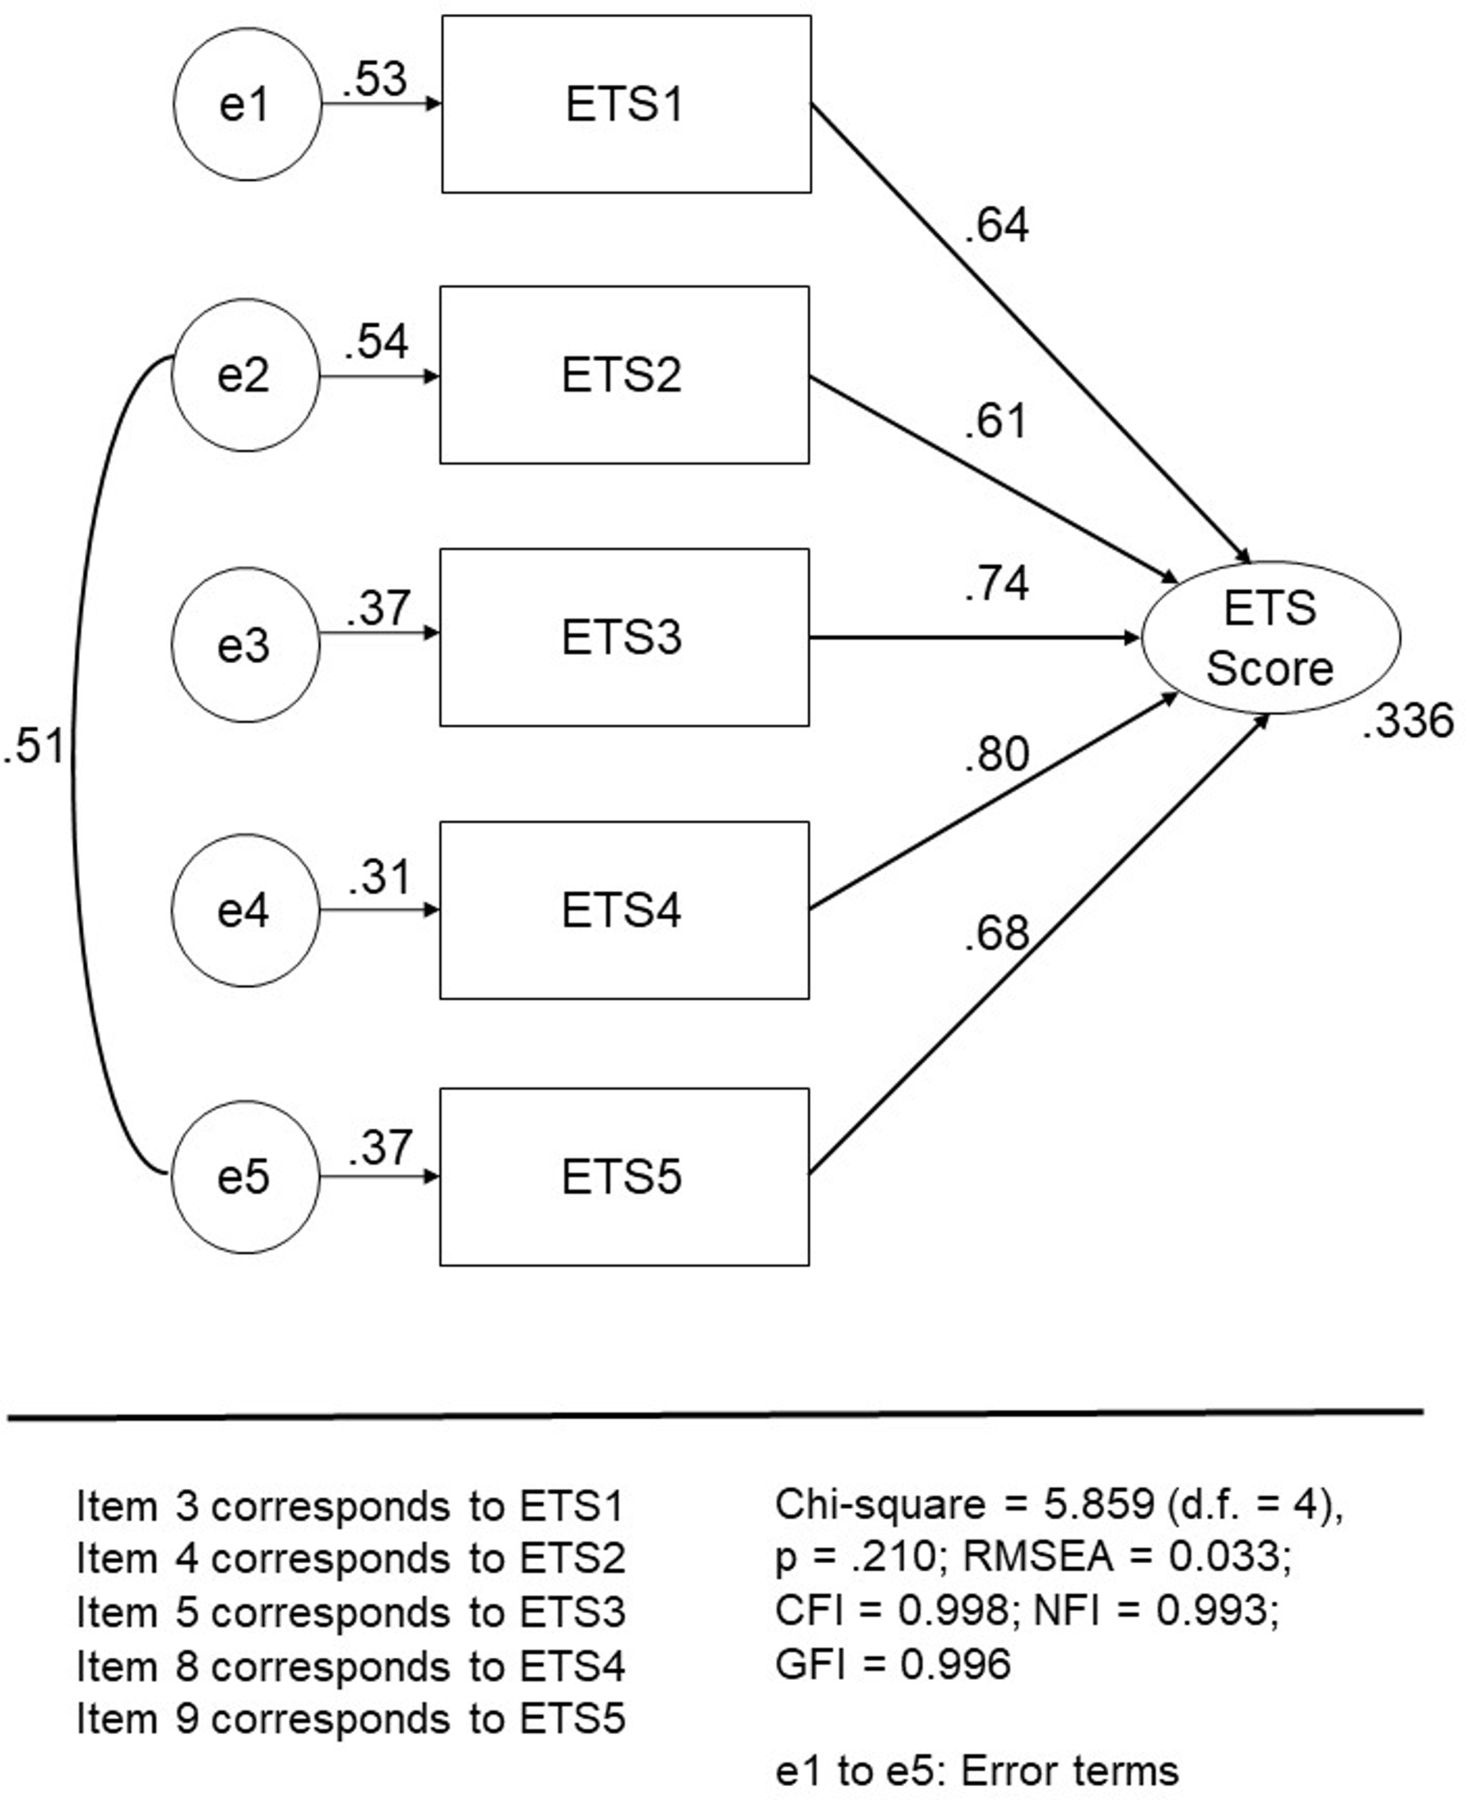
To test our assumption of one general factor, an explorative factor analysis using a varimax rotation, an eigenvalue of more than 1, and the Scree test were used with the five ETS items to determine the number of underlying factors. In addition, we conducted a confirmatory factor analysis (CFA) with an independent sample of patients with chronic low back pain, which had been included in a randomised controlled trial (registration number DRKS-ID: DRKS00010191). These patients completed the ETS. The data were used to test the single-factor structure. The best model used correlated error terms between items 2 and 5 and is shown in figure 1. Multiple goodness-of-fit tests40 were used to evaluate the model, including the comparative-fit index (CFI),41 the normed-fit index (NFI),40 the goodness-of-fit index (GFI)42 and the root mean squared error of approximation (RMSEA). A CFI greater than 0.90 indicates a good fit to the data.43 An NFI and GFI greater than 0.90 indicate a good fit to the data.44 An RMSEA with values of less than 0.08 indicates a good fit to the data,45 whereas values greater than 0.10 suggest strongly that the model fit is unsatisfactory. The χ2 goodness-of-fit test can be considered a general test for the acceptability of the model; a statistically significant χ2 indicates that a significant proportion of variance remains unexplained by the model.40 CFA was conducted with the Analysis of Moment Structures software V.25, which is part of the SPSS package.

Confirmatory factor analysis with factor loadings (n=439) of the final five-item ETS version in patients with chronic low back pain. ETS, Expectation for Treatment Scale.
Results
Sample characteristics
Three-quarters of the patients were female, one-third had a high school degree or higher vocational training, and approximately 70% were currently employed. Approximately two-thirds of the surveys were conducted with patients in Switzerland, and one-third came from Germany. The characteristics of patients with current pain are displayed in table 1. Descriptive information about the scales used in the study is presented in online supplementary appendix table 2.
Sample characteristics of subjects with current pain (n=102)
First version of the ETS
In an initial analysis, we included nine items of the ETS. Descriptive results and results from scale analyses are presented in online supplementary appendix table 3. In general, the SD showed large variances, with the exception of item 6 (‘The treatment (acupuncture) is in general effective’) and item 7 (‘I myself have positive expectations about the treatment (acupuncture)’). The mean value of item 6 was relatively high, which can be considered an indicator of a ceiling effect. Therefore, we decided to exclude item 6 (ie, general expectations about the effectiveness of the treatment (acupuncture)) and item 7 (ie, personal expectation of a treatment) from the final ETS.
The item-total correlation and Cronbach’s alpha if an item is deleted are indicators for the coherence of the single item meaning with the total scale (see online supplementary appendix table 4). The corrected item-total correlation did not give any strong reason for the exclusion of items. However, there were items with very high total correlations between items (items 2 and 9). Item 2 (‘I expect my complaints will be much better because of the treatment (acupuncture)’) and item 9 (‘I expect that after the treatment (acupuncture), my complaints will be considerably better’) were very similar in terms of their wording; therefore, we decided to keep only one of the items for the final version. The reason for this decision was that the ICC value for item 2 was lower than that of item 9. In addition, the mean value for item 9 was lower than the mean of item 2, which consequently can contribute to a larger variation in the final scale because ceiling effects can be avoided. The decision to exclude item 1 was based on content. Our pilot study indicated problems with understanding the meaning of ‘clearly reduced’. Furthermore, item 1 (‘I expect the treatment (acupuncture) will clearly reduce my complaints’) and item 4 (‘I expect the treatment (acupuncture) will make my complaints disappear’) covered similar topics. The factor loading confirmed our earlier decision to eliminate item 6 (‘The treatment (acupuncture) is in general effective’) because the factor loading was relatively low. All items of the first version contributed to one single factor with 65.51% of explained variance. The nine-item ETS version total score is normally distributed. For the five-item ETS version and the AES items, there were a substantial number of subjects with either the lowest or the highest score on the scale.
The final version of the ETS consists of five items (see table 2): the previous item 3 (‘I expect the treatment (acupuncture) will help me to cope with my complaints’) covers coping ability; item 4 (‘I expect the treatment (acupuncture) will make my complaints disappear’) covers total absence of complaints; item 5 (‘I expect the treatment (acupuncture) will improve my energy’) covers an energy increase; item 8 (‘I expect the treatment (acupuncture) will improve my physical performance’) covers an improvement of physical functioning and item 9 (‘I expect that after the treatment (acupuncture) my complaints will be considerably better’) covers a considerable decrease in symptoms. To summarise, the ETS captures an expected decrease in symptoms, an expected increase in energy and an expected overall well-being after a treatment.
Scale and factor analysis of the five-item ETS for subjects with current pain (n=102)
Cronbach’s alpha of the final version was 0.90, which is an excellent value for a very short scale (table 2). Retest reliability was excellent for the five items. All items contributed substantially to the final scale, and the factor loading indicated a single factor structure with 72.33% of explained variance.
Convergent and divergent validity
We expected a moderate correlation between the ETS and the LOT-R optimism and an inverse correlation with pessimism. However, these assumptions were not confirmed by our findings (table 3). Interestingly, higher pessimism was moderately associated with higher expectations, both for the ETS and the AES. The ETS showed a small but significant correlation with the PHQ-9, which is consistent with our assumption. The correlation between the ETS and the RS-11 or the BEE was close to 0, which is unexpected according to our assumptions. However, we found a moderate correlation between the ETS and the PSM, for which higher expectations were associated with a higher sensitivity to medication. The shared aspect of this association is the responsiveness to a medical treatment. Personality traits (NEO-FFI) were not associated with the ETS, which is consistent with our assumptions. The ETS score has a very high correlation (>0.90) with the AES, which can be considered a benchmark measure for acupuncture expectations.
Convergent and divergent validity of the five-item version of the ETS for subjects with current pain (n=102): Pearson correlation, significance level (two tailed), patients (n)
Confirmatory factor analysis
In addition, we conducted a CFA with the data from the 439 ETS questionnaires mentioned above with the model presented in figure 1. The factor loadings were between 0.609 (item 2) and 0.796 (item 4). We found an acceptable model fit in the χ2 statistics (χ2=5.859, df=4, p=0.210), indicating that the model is able to explain the data structure in general. The CFI was 0.998 in our model, indicating a very good model fit. Similarly, the NFI (0.993) and the GFI (0.995) confirm the excellent model fit. The RMSEA (0.033) also suggests that the model with one single factor explains the data very well. The good internal consistency of the ETS in this sample (Cronbach’s alpha=0.836) confirmed the findings of the scale development.
Discussion
The ETS is a well-validated and brief five-item scale for measuring patient expectations, with excellent test–retest properties. We were able to overcome ceiling effects, which had been a limitation of earlier measures.19 This improvement might result from using only four response categories instead of a larger scale with rather inadequate categories (namely, definitely disagree). The ETS has excellent measurement properties concerning Cronbach’s alpha; retest reliability over 1 week and single factor structure were replicated in a clinical sample. The ETS can be used for research and clinical purposes equally.
The ETS could be adapted to other clinical situations and treatments beyond acupuncture, which would be an important step towards implementing treatment expectations as standardised working mechanisms among a variety of patient populations. Pain disorders, mental disorders and functional symptoms might be the most appropriate fields, because clinical research indicates the high relevance of expectations for treatment outcomes.
Another notable issue that deserves discussion is the moderate correlation between high pessimism and high expectations for both the ETS and the AES. Our initial assumption was that we would find a negative association between both expectation measures and pessimism. This assumption was not confirmed. Furthermore, we found no correlation between optimism and the ETS in our study, which is contrary to the underlying theoretical framework of Bowling et al in this study. The findings about negative cognitions (pessimism) are consistent with our result of a small but significant correlation of the ETS and depression (PHQ-9). A possible explanation for both findings might be that in patients suffering from pain, depression might be associated with more severe medical symptoms that might lower patients’ expectations in some cases, depending on treatment history.
Limitations
There are limitations to our study. First, although collection of data via a web-based survey holds many advantages, there are also downsides to this method because recruitment is done using an unstructured approach. Because the ETS questionnaire was also validated in a paper-based version in a clinical population, this limitation is of minor importance. Second, to enhance the external validity of our study, other clinical populations should be investigated to prove the validity of our scale across clinical conditions. Thus far, the application appears feasible and valid for patients with pain. Third, there might be clinical intervention in situations in which patients might have a very vague idea about procedures and outcomes. We did not collect data from a clinical pain population prior to their acupuncture treatment. The patients from our sample provided information about their previous experience with acupuncture, but such an assessment could be done more comprehensively to capture the underlying beliefs and experiences of patients and their relevance for expectations.
Conclusion
The ETS is a short and validated measure that can contribute to the understanding of patient expectations for treatment outcomes. The field of acupuncture served as an example to develop the ETS, but it could be easily adapted for other treatments and clinical contexts. The ETS fills a gap by providing a strong and flexible measure that can serve as a basis for upcoming predictor analyses of treatment expectations in clinical studies.
Acknowledgments
We thank Dr George Lewith, who made important suggestions on the 462 phrasings of questions in our scale.
References
Footnotes
Contributors JB was involved in the conception and execution of the scale and survey, the analysis and interpretation of data, the writing of the first draft and the revision of the manuscript. AK was involved in the analysis and interpretation of data and the writing of the manuscript. SL was involved in programming and conducting the survey, managing and analysing the data, and revising the manuscript. CMW was involved in the conception of the scale and survey, the interpretation of the data and the revision of the manuscript.
Funding This study was funded by the Swiss National Science Foundation (Schweizerischer Nationalfonds zur Förderung der Wissenschaftlichen Forschung), grant number 105319_159833.
Competing interests None declared.
Ethics approval The study was granted ethics approval by the local ethics committee (Kantonale Ethikkommission Zürich, no. 48–2015).
Provenance and peer review Not commissioned; externally peer reviewed.
Data sharing statement Data are available from the first author on request.
Patient consent for publication Obtained.