Article Text

Abstract
Objectives To describe the laboratory test ordering patterns by general practitioners (GPs) in Northern Ireland Western Health and Social Care Trust (WHSCT) and explore demographic and socioeconomic associations with test requesting.
Design Cross-sectional study.
Setting WHSCT, Northern Ireland.
Participants 55 WHSCT primary care medical practices that remained open throughout the study period 1 April 2011–31 March 2016.
Outcomes To identify the temporal patterns of laboratory test ordering behaviour for eight commonly requested clinical biochemistry tests/test groups in WHSCT. To analyse the extent of variations in laboratory test requests by GPs and to explore whether these variations can be accounted for by clinical outcomes or geographical, demographic and socioeconomic characteristics.
Results The median number of adjusted test request rates over 5 consecutive years of the study period decreased by 45.7% for urine albumin/creatinine ratio (p<0.000001) and 19.4% for lipid profiles (p<0.000001) while a 60.6%, 36.6% and 29.5% increase was observed for HbA1c (p<0.000001), immunoglobulins (p=0.000007) and prostate-specific antigen (PSA) (p=0.0003), respectively. The between-practice variation in test ordering rates increased by 272% for immunoglobulins (p=0.008) and 500% for HbA1c (p=0.0001). No statistically significant relationship between ordering activity and either demographic (age and gender) and socioeconomic factors (deprivation) or Quality and Outcome Framework scores was observed. We found the rural–urban differences in between-practice variability in ordering rates for lipid profiles, thyroid profiles, PSA and immunoglobulins to be statistically significant at the Bonferroni-adjusted significance level p<0.01.
Conclusions We explored potential factors of the interpractice variability in the use of laboratory tests and found that differences in requesting activity appear unrelated to either demographic and socioeconomic characteristics of GP practices or clinical outcome indicators.
- quality in health care
- pathology
- chemical pathology
- primary care
This is an open access article distributed in accordance with the Creative Commons Attribution Non Commercial (CC BY-NC 4.0) license, which permits others to distribute, remix, adapt, build upon this work non-commercially, and license their derivative works on different terms, provided the original work is properly cited, appropriate credit is given, any changes made indicated, and the use is non-commercial. See: http://creativecommons.org/licenses/by-nc/4.0/.
Statistics from Altmetric.com
Strengths and limitations of this study
The study provides a comprehensive analysis of temporal changes in laboratory test utilisation patterns and establishes the extent of variability in test requesting activity across general practices in Northern Ireland’s Western Health and Social Care Trust.
The variation in test ordering, not related to demographic and socioeconomic characteristics of practices, practice location or clinical outcome indicators, may reflect inappropriate laboratory test utilisation and hence, suggest a potential for more efficient demand management of laboratory services.
Given a cohort of general practices within one catchment area, our results provide evidence of differences in behaviour of individual general practitioner (GP) when managing patients with similar clinical symptoms.
Failure to collect and cross-tabulate data on characteristics of GPs, such as GP’s age, years of experience, medical training was a study limitation and a missed opportunity in assessing the influence of practitioner factors on the variation in test ordering behaviour.
Introduction
Despite the important role of laboratory testing in the diagnosis and monitoring of disease, there is concern about the increasing number of requested tests and in particular, large differences in laboratory utilisation between clinical teams.1 In the UK, laboratory test orders grew by approximately 5% per year in recent years and inappropriate test requests are considered to be an important cause for this increase.2 3 Although pathology expenditures account for only 5%–6% of the UK total health budget, they are viewed as a potential source of savings, most likely because the costs can be easily identified and measured.4 According to the Department of Health, the rationalisation of pathology services, including demand management of laboratory tests and elimination of unnecessary requesting, could produce savings of at least £500 million.5
Unnecessary testing is not only wasteful of resources but impacts on patients directly through the requirement for venepuncture and the follow-up of minor (and possibly insignificant) abnormalities which may cause patient anxiety. On the other hand, inappropriate under requesting may cause harm through failure to diagnose or manage disease optimally. Several studies suggested that unnecessary and inappropriate utilisation of laboratory services is closely linked to interpractitioner variability in test requesting.6–8 Despite the increased availability of clinical management guidelines promoting harmonisation of the use of laboratory tests, there is still substantial variation in test utilisation among general practitioners (GPs).7 9 These differences appear to be unrelated to demographic characteristics of patient populations, socioeconomic status of GP practices, disease prevalence or clinical outcome indicators.6 7 10 11 Even if some of these variables have been shown to have an effect on test ordering patterns, the variation in requesting rates is so large that it can only be explained by differences in attitudes towards the use of laboratory tests of individual practitioners.10 Accordingly, factors such as confidence in clinical judgement, clinical experience, an attitude about clinical practice guidelines, a lack of knowledge regarding the correct use of tests and fear of litigation have been identified as potential sources of practice variation.12–15
Since unwarranted variation can lead to suboptimal clinical outcomes,16 17 identification of factors contributing to differences in test requesting can provide useful information for optimising utilisation of laboratory services. The aim of our study was to establish the extent of variability in test requesting and characterise temporal changes in test ordering patterns across general practices within the catchment area of the Northern Ireland (NI) Western Health and Social Care Trust (WHSCT) for a range of most commonly requested clinical biochemistry tests/test groups. In addition, we investigated potential factors associated with interdoctor variability in the use of laboratory tests including geographical, demographic and socioeconomic factors as well as Quality and Outcome Framework (QOF) scores.
Materials and methods
Study design and data sources
We conducted a cross-sectional study of laboratory test ordering activity across general practices in the WHSCT in the period from 1 April 2011 to 31 March 2016. The data on the use of laboratory tests were obtained from a HSC Business Object XI clinical information system. We investigated requesting rates for eight clinical biochemistry tests/test groups including electrolyte profile, thyroid profile (FT4 and TSH), liver profile, lipid profile, urine albumin/creatinine ratio (ACR), glycosylated haemoglobin (HbA1c), prostate-specific antigen (PSA) and immunoglobulins. The profile tests, that is, electrolyte, lipid, liver and thyroid profiles contained a number of different related analytes. Individual elements of the profile tests could not be requested separately. Other tests, such as HbA1c, comprised one single analyte. The standardised number of laboratory tests requested in each general practice was determined by dividing the total number of requested tests by the number of registered patients and expressed as requests per 1000 patients, with the exception of HbA1c and ACR for which ordering rates were expressed as tests per patient with diabetes and PSA rates, calculated per 1000 male patients. GP practice list size data (including the number of patients with diabetes) and patient demographic data were extracted from the Business Services Organisation Family Practitioner Service Information and Registration Unit system. The rural–urban distribution of GP practices was based on the data from the Census Office of the Northern Ireland Statistics and Research Agency (NISRA).18 Socioeconomic characteristics of GP practices were determined using the NISRA Neighbourhood Information System.19 QOF scores for individual practices were extracted from the website of the Northern Ireland Department of Health.20
Participants and setting
Data on laboratory tests requested from 55 general practices within the WHSCT were collected from the laboratory databases of Clinical Chemistry departments of the Altnagelvin Area Hospital, Tyrone County Hospital and the Erne Hospital (subsequently the South West Acute Hospital). WHSCT provides health and social care services throughout the west of NI, across the council areas of Derry City and Strabane District Council, Limavady in the Causeway Coast and Glens Borough Council, and Fermanagh and Omagh District Council.
Inclusion criteria
We examined laboratory test requests from 55 separate primary care medical practices within the catchment area of WHSCT that remained open throughout the study period, that is, during 5consecutive years: April 2011–March 2012, April 2012–March 2013, April 2013–March 2014, April 2014–March 2015 and April 2015–March 2016. To ensure the completeness and consistency of the data, test orders from WHSCT GP practices that were closed (two GP practices) or taken over by other practices (one GP practice) during the period of investigation were not taken into account.
Variables and characteristics
Our analysis was limited to eight most frequently requested clinical biochemistry tests/test groups including electrolyte profile, thyroid profile, liver profile, lipid profile, ACR, HbA1c, PSA and immunoglobulins. All considered tests/profiles (with the exception of immunoglobulins and ACR) were listed on a paper pathology request form and ordered by ticking a box adjacent to the test name; requests for ACR and immunoglobulins were made by writing the test name in an open text field.
Rates of test requests were analysed in the context of geographical and socioeconomic characteristics of practices, patient demographics (age and gender) and clinical outcome indicators. Note that we were not able to obtain a consolidated data on both gender and age of patients (ie, the number of patients split into age bands and broken down by gender) registered in individual GP practices.
The practice setting (rural vs urban area) was determined using the urban–rural classification of the Department for Environment, Food and Rural Affairs21 while the size of settlements was obtained from the NISRA Census Office.18 A GP practice was defined as rural if its physical address was situated in a settlement of less than 10 000. Accordingly, we classified 24 practices as rural and 31 as urban. Furthermore, GP practices were categorised based on the NI Multiple Deprivation Measure (MDM) identified for individual Super Output Areas (SOAs).19 The MDM comprises a weighted combination of seven component measures (Income Deprivation; Employment Deprivation; Health Deprivation and Disability; Education, Skills and Training Deprivation; Proximity to Services; Living Environment and Crime and Disorder) and ranges from 1 (most deprived SOAs) to 890 (least deprived SOAs). The Health Deprivation and Disability rank (one of the MDM domains)19 was analysed separately as a potential factor contributing to interdoctor variability in the use of laboratory tests.
Given a detailed breakdown of the age of patients on the individual practice lists, we examined the relationship between the percentage of patients over age 65 and ordering rates for electrolyte, thyroid, liver and lipid profiles. In addition, we investigated the link between gender and requesting activity for PSA (for males) and thyroid profiles (for females).
To evaluate the impact of test requesting patterns for diabetes mellitus on the QOF clinical indicator scores in diabetes, we used the overall QOF points under clinical indicator DM007 (‘The percentage of patients with diabetes in whom the last HbA1c is 59 mmol/mol or less in the preceding 15 months’), DM008 (‘The percentage of patients with diabetes in whom the last HbA1c is 64 mmol/mol or less in the preceding 15 months’) and DM009 (‘The percentage of patients with diabetes in whom the last HbA1c is 75 mmol/mol or less in the preceding 15 months’). Specifically, we combined the number of points for each of these three categories, calculated the overall achievement rate and investigated its relationship with interpractitioner variability in test requesting of HbA1c.
Outcome measures
Our outcome of interest was to identify the presence and extent of variations in primary care laboratory tests ordering and to evaluate temporal changes in both the standardised number of test requests and between-practice variability in requesting. In addition, we studied demographic, socioeconomic, geographical and clinical factors that may explain this variation.
Statistical analysis
Interpractice variability in test requests was assessed by calculating the variance (σ²). Furthermore, we computed ‘variability index’ (Vari) defined as the top decile divided by the bottom decile of standardised test request rates.10 Vari is a dimensionless measure of dispersion allowing us to compare the amount of variation in request rates of individual tests despite their differences in scale. The Shapiro-Wilk test of normality was used to determine if the distribution of test ordering data deviated from a normal distribution.22 Since the distribution of laboratory test request rates was found to be non-normal, the non-parametric statistics were implemented to perform further analysis. Mann Whitney U (MWU) test was employed to compare distributions of laboratory test rates between GP practices located in rural and urban areas.23 The homogeneity of variances for requesting activity in rural and urban GP practices was assessed with the Fligner-Killeen (FK) test.24 Significance of temporal changes in median and variation in test requesting rates was examined with the Mann–Kendall (MK) test.25 To test the relationship between adjusted requesting rates and (1) MDM; (2) Health Deprivation and Disability Deprivation rank; (3) proportions of patients over age 65; (4) distribution of patient’s gender and (5) QOF clinical indicator scores, we calculated the Kendall rank correlation coefficient (τ) with the corresponding p-value.26 The Kendall coefficient (−1 ≤ τ ≤1) measures the strength of a correlation between two variables and assesses the degree of overall correspondence of variables’ ranking.26
Since the test statistics were used to simultaneously evaluate the significance of observations for different case scenarios (ie, differences over time or differences between clinical biochemistry tests/test groups), we took a conservative approach in selecting the significance level α by applying the Bonferroni correction.23 This multiple comparison correction technique minimises the risk of obtaining false positive results by using an adjusted α for each single test. Single threshold values α were calculated in such a way that the family wise error probability pfwe (here adopted pfwe <0.05) was retained at the global level.23 Accordingly, the significance level α for a single test was approximated by dividing the global error probability pfwe by the total number of independent tests.23
Patient and public involvement
No patients or GPs were involved in defining the research question or outcome measures nor were they engaged in the design or implementation this study. The study was approved by the WHSCT. All identifiable information used for the purpose of the study was anonymised and not traceable to individual patients or GPs.
Results
Test ordering patterns
We analysed the laboratory test request rates of 55 general practices within the catchment area of the WHSCT comprising a total of 316 382 (2011–2012), 316 688 (2012–2013), 318 057 (2013–2014), 319 383 (2014–2015) and 326 429 (2015–2016) patients. Figure 1 shows the total number of eight considered clinical biochemistry tests/test groups ordered during the study period of 5 consecutive years. The total number of ordered tests was 523 111 (2011–2012), 531 849 (2012–2013), 531 583 (2013–2014), 525 146 (2014–2015) and 542 118 (2015–2016) with electrolyte profiles found to be the most frequently ordered tests, making up approximately 30% of all requests in each year.

The total number of eight considered clinical biochemistry tests/test groups ordered by 55 general practices during the period 1 April 2011–31 March 2016. ACR,albumin/creatinine ratio; EP, electrolyte profiles; PSA, prostate-specific antigen.
The median number of adjusted test request rates between the 2011–2012 and 2015–2016 decreased by 45.7% for urine ACR (p<0.000001) and 19.4% for lipid profiles (p<0.000001). We observed a 60.6%, 36.6% and 29.5% increase for HbA1c (p<0.000001), immunoglobulins (p=0.000007) and PSA (p=0.0003), respectively. The Bonferroni-adjusted probability p<0.01 was used in testing for statistical significance (table 1).
Overview of general statistics
The between-practice variation in the number of laboratory test requests is shown in table 1. In the considered period, the Vari was lowest for electrolyte profiles (2.0–2.3), liver profiles (2.2–2.5) and HbA1c (2.2–2.9) and highest for immunoglobulins (19.2–69.8). The number of outlier GP practices, that is, practices with outlier ordering rates of laboratory tests contributed to the overall variability (figure 2). The number of requested tests for thyroid profiles, HbA1c and immunoglobulins per patient was over three times higher in the outlier GP practices (table 2). We however acknowledge that a statistical outlier in terms of test utilisation is not necessarily an example of inappropriate practice. When compared with 2011–2012, the variance in test utilisation was 16.8% lower for electrolyte profiles, 15.3% for lipid profiles, 28.3% for thyroid profiles and 23.5% for liver profiles in 2015–2016. For ACR, immunoglobulins and HbA1c, the variance was 40%, 272% and 500% higher, respectively.
Number of requested tests per patients in outlier (O) and non-outlier (NO) GP practices

Temporal variability of the standardised laboratory test requests for (A) electrolyte profiles, (B) lipid profile, (C) prostate-specific antigen (PSA), (D) thyroid profiles, (E) liver profiles, (F) HbA1c, (G) urine albumin/creatinine ratio (ACR) and (H) immunoglobulins (immunos) for 55 considered general practices. Each data point (dot): a single practice. Solid, horizontal line inside the box: median. Lower and upper ‘hinges’ of the boxplots: first and third quartiles, respectively. Lower and upper extremes of whiskers: interval boundaries of the non-outliers (black dots). Data outside interval: outliers.
Trends in the number and variation of test requests over time
We observed no statistically significant linear trend in the median standardised number of laboratory tests over the period of investigation as indicated by the MK test p-values (figure 3). Furthermore, no linear trend was found in the annual changes in variation in test requesting rates (figure 3). Note that to control the false discovery rate in multiple comparisons (for eight laboratory tests), the Bonferroni-adjusted probability p<0.00625 was used in testing for statistical significance.

Trend lines for median (blue) and variance (red) of the standardised number of (A) electrolyte profiles, (B) lipid profile, (C) prostate-specific antigen (PSA), (D) thyroid profiles, (E) liver profiles, (F) HbA1c, (G) urine albumin/creatinine ratio (ACR) and (H) immunoglobulins (immunos).
Test ordering variation between general practices and explanatory factors
The relationship between test requesting rates and potential explanatory factors was established based on the information on the number of ordered tests, patient demographics and Quality and Outcomes Framework indicator scores obtained for the period 1 April 2015–31 March 2016.
Demographic characteristics of patient population
Proportion of the oldest age category of patients (>75) constituted a relatively small group in each GP practice (mean=6.1%, 95% CI = 5.7% to 6.5%). Hence, we combined the 65–74 and >75 age categories to create a more meaningful group of patients in the older age band. We examined four tests for which differences in proportions of older patients were expected to be reflected in test requesting, that is, electrolyte profiles, liver profiles, lipid profiles and thyroid profiles. Since we were unable to obtain a consolidated data on both gender and age of patients, we did not assess the relationship between the PSA requesting rates and the category of males aged 65 and over. We found no statistically significant relationship between the adjusted request rates of selected laboratory tests and the percentage distribution of patients of age over 65 (online supplementary table S1).
Supplemental material
Since previous studies reported on a higher rate of testing of thyroid hormones in females,27 we looked at the strength of a relationship between the percentage of females in individual GP practices and requesting rates for thyroid profiles. We found no statistically significant association between these two characteristics (τ=−0.19, p=0.05) (online supplementary figure S1).
In addition, we examined the effect of gender distribution on the standardised number of PSA tests, with the PSA ordering rates expected to be higher for GP practices with higher percentage of males (online supplementary figure S2). No statistically significant correlation between these two variables was found (τ=0.15 and p=0.1). Note that we acknowledge the fact that a combined effect of sex and age distributions might have had a more significant effect on PSA requesting activity. However, the restricted access to such data limited the opportunity of more insightful analysis.
Practice setting
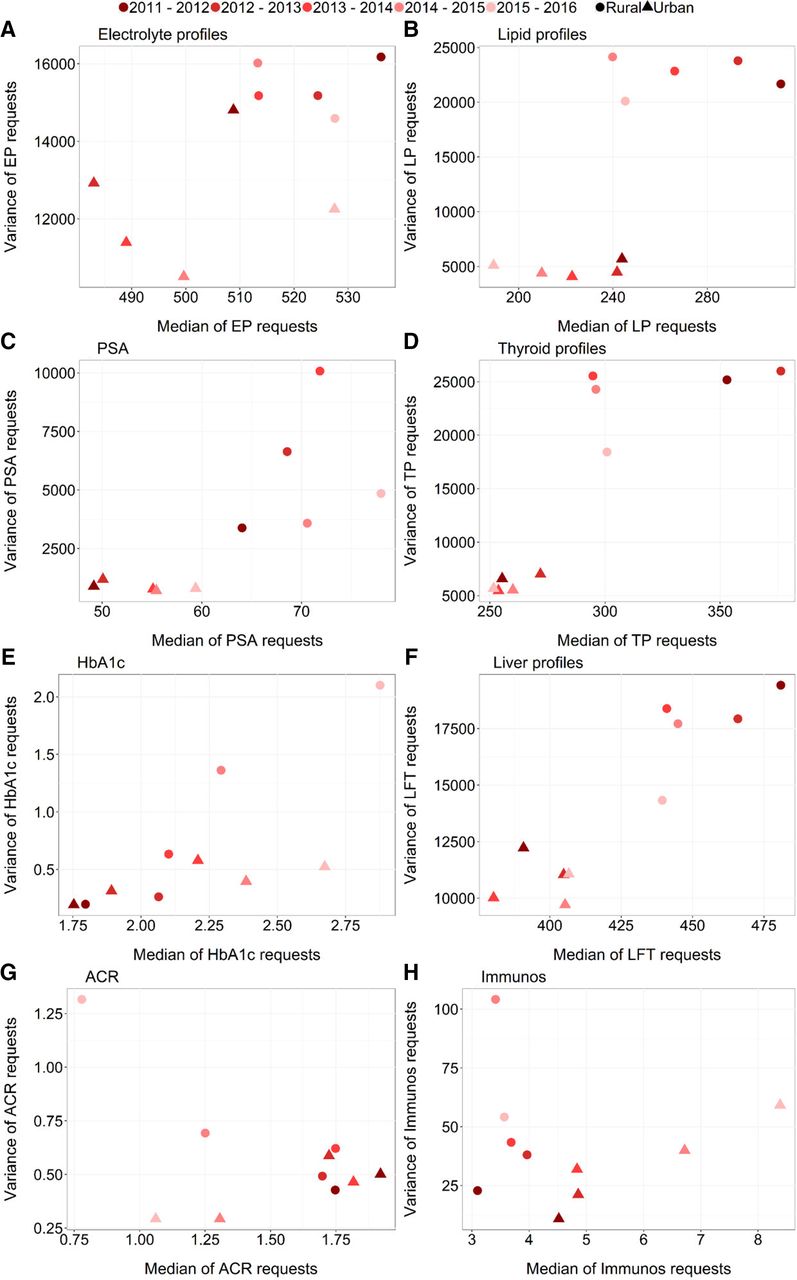
Figure 4 shows a temporal median–variance relationship of the standardised number of laboratory test requests for rural and urban areas. The median number of tests ordered annually by practices located in rural areas was higher by approximately 27%–37% for PSA, 14%–30% for lipid profiles, 14%–38% for thyroid profiles and 8%–23% for liver profiles. For ACR and immunoglobulins, the median requesting rates were lower in rural areas by 1%–27% and 18%–57%, respectively.
The temporal median–variance relationship of the standardised number of laboratory test requests across the years for (A) electrolyte profiles (EP), (B) lipid profile (LP), (C) prostate-specific antigen (PSA), (D) thyroid profiles (TP), (E) liver profiles (LFT), (F) HbA1c, (G) urine albumin/creatinine ratio (ACR) and (H) immunoglobulins (immunos). Circle/triangle: rural/urban general practices.
Across five consecutive time periods, the MWU test showed significant differences between ‘rural’ and ‘urban’ distributions of laboratory test rates for lipid profiles (pMWU=0.0004 in 2011–2012, 0.001 in 2012–2013 and 0.0097 in 2013–2014), thyroid profiles (pMWU=0.009 in 2011–2012), PSA (pMWU=0.003 in 2015–2016) and immunoglobulins (pMWU=0.0096 in 2015–2016) while no statistically significant rural–urban difference in between-practice variation in ordering rates was found for any of the studied* tests (table 3). Note that pMWU and pFK lower than Bonferroni-corrected significance cut-off α < 0.01 (corrected for five different measurements over time) were considered statistically significant.
The significance of differences in the distribution and variability in test request rates between GP practices located in rural and urban areas
Socioeconomic factors
We observed no statistically significant relationship between the MDM and test requesting activity (online supplementary table S2). Similarly, the relationship between the Health Deprivation and Disability rank and the standardised number of test requests was found insignificant for any of the considered tests (online supplementary table S2). Note that to adjust for multiple comparisons at a family-wise simultaneous error rate of pfwe <0.05, the Bonferroni-adjusted α <0.003125 (corrected for 16 different comparisons) was used to test for statistical significance.
Quality and outcomes framework indicators
To evaluate the relationship between standardised number of laboratory tests and QOF indicator scores, we looked at the management of diabetes. There are two main reasons for that. First, the guidelines for the management of diabetes are widely available to practitioners to improve clinical practice and care of diabetic patients. Second, HbA1c is a specific test in diabetes care and does not play an important role in the monitoring or diagnosis of any other condition.
All practices achieved the maximum 17 points available under QOF clinical indicator DM007. All but nine practices attained the maximum eight points available under DM008 (range: 4.1–8.0) and 31 practices attained the maximum 10 points available under DM009 (range: 6.36–10.0). The relationship between the number of HbA1c tests performed and the GP practice effectiveness, as measured by the QOF overall achievement rate (combined DM007, DM008 and DM009), was found statistically insignificant (τ=0.12, p=0.2).
Discussion
We evaluated temporal changes in variability and number of laboratory tests ordered by individual GP practices in the WHSCT. We also investigated a range of key demographic, socioeconomic, geographical and clinical factors to assess whether any of these factors are likely to explain a part of the observed variation in requesting activity.
Interpractice variability in test requests expressed by the index of variability was the lowest for profile tests and the highest for HbA1c and immunoglobulins. This observation was consistent with previous studies.10 28 29 In addition, we observed a 23.3% decrease in profile tests (electrolyte, lipid, liver and thyroid profiles combined) between 2011–2012 and 2015–2016 (p=0.009, the Bonferroni-adjusted α <0.01 used). This might have been related to the implementation of the demand optimisation intervention in the WHSCT over the 3-year period from April 2012 to March 2015. The intervention was developed to support appropriate use of laboratory testing in the WHSCT and consisted of several elements including educational materials on the benefits of the optimal tests utilisation, information on minimal retest intervals, the review of the test requesting processes and financial incentive. Educational material covered the major clinical indications for a range of most commonly requested tests (including profile tests) and was circulated electronically to all GPs. The educational material was supplemented by face-to-face educational sessions with primary care teams and presentation of data showing the local variability on test requesting rates. Furthermore, all primary care teams were asked to engage in the process of reviewing test requesting procedures within their practice (ie, what staff are allowed to request tests and what is the process for test requesting), and to reflect on the information provided on their practice test requesting rates and ranking in comparison to other practices. GPs also received a very small incentive to participate in the scrutiny of their requesting processes and activities. The 500% increase in variance of HbA1c ordering rates (statistically significant at the Bonferroni-adjusted α <0.01), on the other hand, may have been caused by between-practice differences in the adoption of HbA1c as a diagnostic test (from 2012) and inconsistent implementation of new guidelines on appropriate rate of diabetes monitoring. This may indicate that recommended guidelines did not predispose GPs to change their perceptions on the value and role of HbA1c test in patient assessment.
The interpractitioner variations in test ordering were found unrelated to demographic and socioeconomic factors. We showed that distributions of patients’ age and sex had little impact on ordering rates for a predetermined set of pathology tests. The socioeconomic status of GP practice also did not appear to identify low or high requestors of laboratory tests. No significant relationship between test ordering and age, gender or deprivation measures was reported by other studies.6 30–32
The practice location was found to be a significant factor associated with variability in use of lipid profiles, thyroid profiles, PSA and immunoglobulins. This may reflect the differences in clinical practice associated with the specific aspects of practice organisation and workflow in rural and urban practices as well as personal characteristics of GPs. The practice location was previously related to the between-practice variation in prescribing.33–35 Further studies are needed to explore in more detail the potential reasons for the rural–urban discrepancy in test utilisation, especially that these differences appear to be significant only for some clinical biochemistry tests/test groups.
Finally, we found no evidence of a significant correlation between test requesting rates and clinical outcomes. This observation is consistent with other studies.10 The fact that the majority of practices attained maximum points for the three target levels for HbA1c (59, 64 and 75 mmol/mol) implies that the glycaemic control was generally good and could not explain the variability in HbA1c testing.
Note that we took a conservative approach in determining the significance cut-off α when evaluating the significance of observations for multiple comparisons (eg, differences in laboratory test requests over time or differences in request rates between considered clinical biochemistry tests/test groups) by applying the Bonferroni correction. We are aware that while the Bonferroni adjustment decreases the risk of type I errors, that is, a probability of a false significant result, this happens at cost of inflating type II errors, that is, the probability of accepting the null hypothesis when the alternative is true. However, by applying this correction technique, we believe we reinforced confidence in the significance of our results.
Implications for practice and research
The findings of our study suggest that there may be considerable potential for the rationalisation of test ordering through minimising the between-practice variability in test utilisation. Yet, it is important to establish whether the observed variation is, and to what extent, associated with over-requesting (unnecessary repeat requesting of tests) in GP practices with high ordering rates or on the contrary, it reflects a failure to prescribe clinically indicated tests by GP practices characterised by low use of tests. Further analysis on the degree and detection of inappropriate use of laboratory resources in primary care could contribute to improving the consistency, efficiency and cost-effectiveness of patient diagnostics, monitoring and treatment and hence, reduce unnecessary costs to patient care.
Further exploration of variations in requesting activity in the context of factors not considered in this study (eg, practitioner-specific characteristics) may help identify and implement appropriate optimisation strategies to manage demand for laboratory tests. Previous studies reported on the number of successful approaches in fostering best practice and reducing variation in test utilisation including implementing locally agreed clinical guidelines, changing test order forms, incorporating clinical decision support tools with embedded retest interval rules, conducting audits of GPs on their request rates and providing financial incentives.36–42 In fact, several studies showed that multifaceted interventions were most successful in optimising laboratory demand.43 44
Finally, it is essential to better understand implications of variability in laboratory test requesting for the cost and quality of care. In particular, an important question to be answered is whether or not the growing costs associated with increased use of laboratory services has led to commensurate benefits to the patient.
Strengths and limitations
Test requesting data were directly extracted from the HSC Business Object XI clinical information system that captures information on tests’ use from three clinical chemistry departments of Altnagelvin Area Hospital, Tyrone County Hospital, and South West Acute Hospital. Accordingly, our analysis was based on all available data regarding requesting activity in the Northern Ireland WHSCT in the period of 1 April 2011–31 March 2016 and hence, was not subject to selection bias. Furthermore, our study provides a first comprehensive insight into the use of laboratory tests and factors accounting for the variation in between-practice test utilisation in the WHSCT primary care system.
Due to data unavailability, we were unable to investigate the relationship between laboratory use patterns and practitioner-specific characteristics including GP’s age, education and medical training. Such analysis could help identify potential reasons behind variation in clinical practice. Besides the lack of information on the practitioners, the present study was limited by a paucity of research evidence in this area. We were also unable to retrieve consolidated data on both gender and age of patients registered in individual GP practices and therefore, assess the combined effect of sex and age distributions on test requesting activity. Furthermore, despite our attempt to maintain consistency by analysing laboratory test requests only from primary care medical practices that remained open throughout the study period, we acknowledge that some GPs in those practices could have been replaced, moved to alternative locations or quit direct patient care during the period of investigation. This could have an impact on the centre-associated requesting rates of laboratory tests. Finally, although the rationale of the study, research objectives, variables, inclusion criteria, outcome measures and statistical methods to be used in our study were identified in advance to guide the analysis of the primary care use of laboratory tests in the WHSCT, the a-priori defined analysis plan was not published. We acknowledge that this could be perceived as a potential limitation of our study.
Conclusion
This study investigated the patterns and temporal changes in request rates across a range of frequently ordered laboratory tests. In addition, it explored potential factors of the interpractice variability in the use of laboratory tests and found that differences in requesting activity appear unrelated to either demographic and socioeconomic characteristics of GP practices or clinical outcome indicators. Our results highlight the need for further investigations to identify other potential factors that may account for the differences in test utilisation between practitioners.
References
Footnotes
Contributors MB and MO had the original idea for this study. SA led the data collection. MB designed the methodology, performed the analysis and drafted the manuscript. MO, CM and LM contributed to the drafting and critical revision of the manuscript.
Funding This project was supported by the EU’s INTERREG VA Programme, managed by the Special EU Programmes Body (SEUPB). The views and opinions expressed in this paper do not necessarily reflect those of the European Commission or the Special EU Programmes Body (SEUPB).
Competing interests None declared.
Provenance and peer review Not commissioned; externally peer reviewed.
Data sharing statement No additional data are available.
Patient consent for publication Not required.