Article Text

Abstract
Objectives Medical crowdfunding is a rapidly growing practice where individuals leverage social networks to raise money for health-related needs. This practice has allowed many to access healthcare and avoid medical debt but has also raised a number of ethical concerns. A dominant criticism of this practice is that it is likely to increase inequities in access to healthcare if persons from relatively wealthy backgrounds, media connections, tech-savvy and educational attainments are best positioned to use and succeed with crowdfunding. However, limited data has been published to support this claim. Our objective in this paper is to assess this concern using socioeconomic data and information from crowdfunding campaigns.
Setting To assess this concern, we present an exploratory spatial analysis of a new dataset of crowdfunding campaigns for cancer-related care by Canadian residents.
Participants Four datasets were used: (1) a medical crowdfunding dataset that included cancer-related campaigns posted by Canadians, (2) 2016 Census Profile for aggregate dissemination areas, (3) aggregate dissemination area boundaries and (4) forward sortation area boundaries.
Results Our exploratory spatial analysis demonstrates that use of crowdfunding for cancer-related needs in Canada corresponds with high income, home ownership and high educational attainment. Campaigns were also commonly located near city centres.
Conclusions These findings support concerns that those in positions of relative socioeconomic privilege disproportionately use crowdfunding to address health-related needs. This study was not able to determine whether other socioeconomic dimensions such as race, gender, ethnicity, nationality and linguistic fluency are also correlated with use of medical crowdfunding. Thus, we call for further research to explore the relationship between socioeconomic variables and medical crowdfunding campaigning to explore these other socioeconomic variables and campaigns for needs unrelated to cancer.
- crowdfunding
- equity
- cancer
- spatial analysis
This is an open access article distributed in accordance with the Creative Commons Attribution Non Commercial (CC BY-NC 4.0) license, which permits others to distribute, remix, adapt, build upon this work non-commercially, and license their derivative works on different terms, provided the original work is properly cited, appropriate credit is given, any changes made indicated, and the use is non-commercial. See: http://creativecommons.org/licenses/by-nc/4.0/.
Statistics from Altmetric.com
Strengths and limitations of this study
Developed large dataset of crowdfunding data.
Presents methods for analysing datasets of crowdfunding campaign information.
Links data on crowdfunding campaigns to data on income, home ownership and education levels.
Unable to determine whether race, gender, ethnicity, nationality or linguistic fluency impact use of crowdfunding.
Introduction
Individuals and groups have increasingly turned to online social networking and social media platforms to fund-raise. This practice has come to be popularly known as crowdfunding. In particular, charitable crowdfunding, as opposed to entrepreneurial fund-raising intended to raise money for businesses, has developed as a means for individuals or small groups to finance their personal needs. These platforms host campaigns, including text, images and video, facilitate outreach to potential donors via social media and process donations.
The crowdfunding platform GoFundMe dominates the charitable crowdfunding sector. Before it recently acquired YouCaring, the second largest social crowdfunding platform, it controlled 90% of the charitable crowdfunding business in the USA and 80% globally.1 2 Launched in 2010, US$5 billion has been raised via GoFundMe to date and this platform supports a community consisting of more than 50 million donors and users.1 Campaigns for health-related purposes comprise the largest proportion of fund-raisers hosted by GoFundMe.2 3 These medical crowdfunding campaigns are thought to be used to pay for essential services for those lacking comprehensive medical insurance, elective procedures not covered by insurance and unproven or experimental medical treatments. They are also used to pay for indirect needs related to receiving medical care, including travel to receive care, compensation for time off from work and payments for medical equipment.3 The use of crowdfunding platforms for medical purposes is expected to continue to grow and thus have a substantial impact on how individuals access health-related care.3 4
Successful medical crowdfunders can benefit greatly from being better able to obtain health-related support via crowdfunding. However, this practice has also been the target of considerable criticism. These concerns include worries about fraudulent campaigns, loss of medical privacy and encouraging the privatisation of healthcare.3 4 Arguably the most common and serious critique of medical crowdfunding is that it will exacerbate existing inequities in who is ultimately able to (financially) access healthcare. While differential access to healthcare is shaped by each community’s health and social care system, insurance coverage and demographics, in general those in positions of socioeconomic privilege, even in universal health systems, have relatively better access to health-related care than their less privileged compatriots. Medical crowdfunding could exacerbate this problem, it is argued, if crowdfunding serves to reward recipients according to their popularity, extent of social networks, technological capabilities or media-savvy rather than need.5 For example, Young and Scheinberg 4 (p1623) flag the ‘potential for unfairly advantaging those with the means to engage with online tools and tap into large social networks, which may lead to an under-representation of cases with the greatest need in which patients lack the tools to coordinate effective crowdfunding campaigns.’ Similarly, critics express that medical crowdfunding is likely to reinforce existing inequalities in class and power6 and reward those with social connections to wealthy persons, media connections and the educational attainments needed to communicate effectively online.7 Others note that placing the distribution of medical funds in the hands of private crowdfunding platforms has problematic effects, as when these companies prohibit fund-raisers for certain services and procedures such as abortion or promote and donate to specific fund-raisers (as in the case of the parents of Charlie Gard fund-raising for an unproven medical treatment).8–10
Empirical support for the criticism that medical crowdfunding mostly benefits those who are socioeconomically advantaged is thus far limited. Lukk, Schneiderhan and Soares reviewed 319 crowdfunding campaigns by Canadians for services related to education and healthcare.11 They found that older and visible minority Canadians were relatively less successful in these campaigns. Berliner and Kenworthy examined 200 medical crowdfunding campaigns and found correlations between success in meeting medical crowdfunding goals and the inclusion of photos and videos, campaign updates and interactions including comments, social media shares and ‘liking’ a campaign.12 A review of 850 campaigns for services related to organ transplantation found that campaigns with positive emotional sentiment tend to be relatively successful.13 An analysis of 410 crowdfunding campaigns for medical transition and gender affirming surgeries and treatments demonstrated that campaigners that are young, are white and transgender men raise more than others in this area but that campaigns for medical transition perform less well than medical crowdfunding campaigns generally.14
Here we present an exploratory analysis of a new dataset of crowdfunding campaigns for cancer-related care by Canadian residents that is connected to a selection of demographic information from the 2016 Canadian Census to explore the relationship between campaign use and socioeconomic status. We captured this medical crowdfunding dataset using an automated data crawling programme and machine learning techniques. We specifically examine crowdfunding campaigns for cancer-related care as existing research has already documented the commonality of such campaigns in Canada,15–17 and we contrast these campaigns against geodemographic trends using an exploratory spatial data analysis (ESDA) approach. ESDA facilitates the investigation of prior assumptions and guides the identification of spatial patterns.18 19 We use these patterns to raise important new research questions about medical crowdfunding in the discussion.
Materials and methods
We used four datasets in this exploratory analysis: (1) a medical crowdfunding dataset that included cancer-related campaigns posted by Canadians, (2) the 2016 Census Profile for aggregate dissemination areas (ADAs), (3) ADA area boundaries and (4) forward sortation area (FSA) boundaries. In consultation with the Simon Fraser University Research Ethics Board, we determined that ethics approval was not required for this project under the locally relevant Tri-Council policy (article 2.2) as the data being collected and used was publicly accessible with no reasonable expectation of privacy given the nature of crowdfunding as an activity.20 While not required by local research ethics regulations, we have chosen not to publish any identifiable details from the scraped campaigns in the interest of the privacy of campaign recipients.
We compiled a medical crowdfunding dataset by creating an automated web crawling algorithm. To do this we developed a Python-based automated web crawler that scraped the GoFundMe platform looking for keywords or strings of words—in this case, the keyword ‘cancer’—and postal codes identifying campaigns as originating within Canada. We chose the key term ‘cancer’ as it is a higher order concept that captures many subtypes. Furthermore, it is a term that will be more familiar and more likely to be used by crowdfunders and donors than subtype names. Our goal was to capture a large selection of cancer-related campaigns rather than an exhaustive sample of such campaigns, making the higher order term well suited to our aims.
The search took place on 11 June 2016. Any ambiguous posts were read by the researchers to determine if they fit the classification and should be included. After relevant campaigns were identified, we used a SQL database server to store the site in HTML form for further analysis. Once the full HTML files from each campaign were retrieved, the pages were then parsed to remove HTML tags. Further cleaning and labelling took place using a machine learning algorithm designed to find and include any missing information or attributes of the campaigns related to cancer. Through this process, campaigns not listed in the ‘medical’ category were excluded and the main campaign content attributes were extracted and irrelevant content (eg, footers) were removed. The final records were stored in a Redis database for access by simple query for analysis. The dataset used in this study contains 1788 records from May 2012 to June 2016 pertaining to cancer-related campaigns created by Canadians.
ADAs are a new census product released by Statistics Canada as part of the 2016 Canadian Census. Delineation of ADAs considers boundaries of previous census products, including existing census divisions, census metropolitan areas and census tracts.21 FSAs are administrative boundaries determined by Canada Post.22 They are alphanumerically represented by ‘the first three characters in a Canadian postal code’.22 The records contained in our crowdfunding dataset described above have an FSA attribute. This geographical data unit enables ESDA. Boundaries of ADAs and FSAs were obtained from Statistics Canada.23
Socioeconomic status and its correlation with an individual’s health or ability to obtain treatments have been previously assessed at a FSA level24–26 which is why we opted to explore socioeconomic status indicators. Variables related to income, education and housing were chosen and obtained using the University of Toronto’s Canadian Census Analyser at the ADA level (see table 1 for exact variables obtained).27 Further data pre-processing and transformations were required in order to link socioeconomic data to FSAs due to current data limitations.
Variables obtained from 2016 census profiles for aggregate dissemination areas
Profile and boundary datasets for FSAs are unavailable for the Statistics Canada 2016 Census data. In lieu of the FSAs, we computed the weighted average of socioeconomic variables based on the per cent of spatial overlap between ADAs and FSAs. To prepare for this conversion, ADAs were spatially joined with data retrieved from the 2016 Census Profile. Each FSA is also joined with respective campaign frequencies (see figure 1 for the high-level description of conversion procedure used to add socioeconomic data at ADA level to FSA level). Once the relationship matrix was generated from the function GenerateWeights, it was then retrieved and used to calculate weighted averages of socioeconomic variables contained in each intersecting ADA. These weighted socioeconomic variables were appended to each respective FSA.

High-level description of conversion procedure used to add socioeconomic data at ADA level to FSA level. This figure denotes the methodology employed to associate socioeconomic data at the ADA level with the crowdfunding data collected at the FSA level. ADA, aggregate dissemination area; FSA, forward sortation area.
Using ArcMap from the ArcGIS suite (V.10.5), quintiles were created using natural breaks. The data were categorised as quintiles as we trusted that five classes would be sufficient to showcase meaningful differences while minimising complexity of visual results. These quintiles were used in cartographic representations to support ESDA tasks. Visual comparisons at regional and provincial levels were then conducted with regards to income, education and housing ownership. The creation of these quintiles allowed project correspondents to examine the data for geographical trends. These cartographic products enabled the significance of these socioeconomic variables to be gauged for medical crowdfunding.
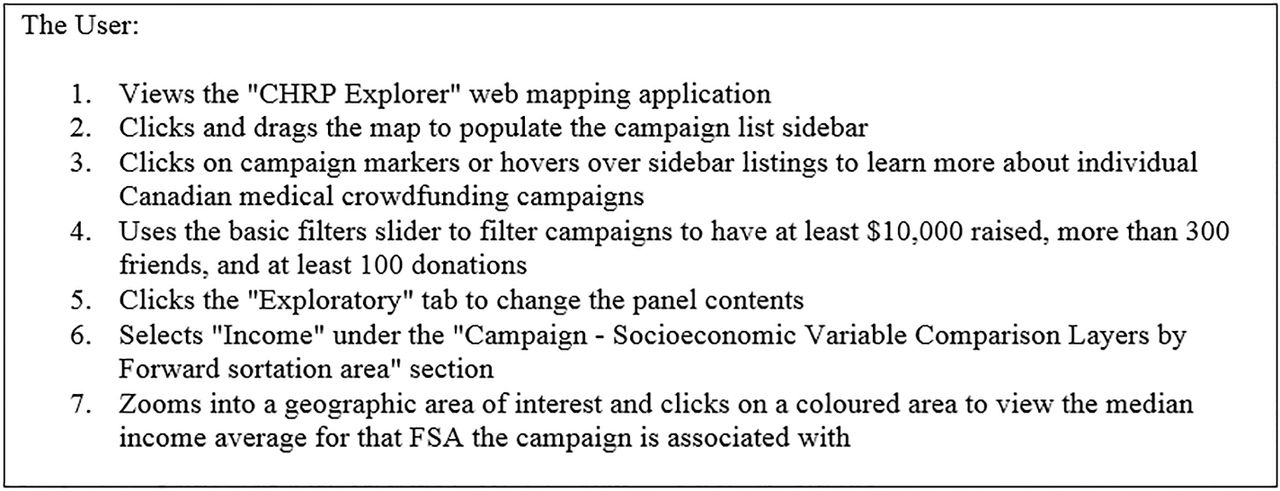
Campaigns for each FSA were counted, and these frequencies were assigned to their respective boundaries. These FSAs were subsequently linked with ADAs that feature census variables from the 2016 Canadian Census. These variables consisted of income, number of persons who have completed post-secondary education, and home ownership. These linkages were informed by research conducted by Rogers28 in which these variables were shown to be commonly associated with vulnerability with regard to health and healthcare. To link these datasets, the variables were weighted based on the percent of areal overlap each ADA shares with each FSA. The resulting weighted attributes were then divided into quintiles using a method similar to Southern et al.29 Resulting quintiles were then visualised in an interactive cartographic display, or web map, enabling geographical comparisons to be made. This map can be viewed at: https://www.crowdfundingforhealth.org/chrpexplorer. Figure 2 describes the process for users of Crowdfunding for Health Research Program (CHRP) to explore the ESDA results. Figure 3 shows an image of the web map interface.

Sample interaction sequence to support adding context to campaign markers in the interactive web mapping tool. This figure provides a set of sample instructions to users of the CHRP web map to better understand the datasets displayed. FSA, forward sortation area.

Screen capture of the web map application (main page). This figure shows the home page of the CHRP. The data shown in this figure denotes the locations of all crowdfunding campaigns involved with this study. Basic information associated with each of the campaigns can be viewed here. Permission has been granted to reproduce, this image and it is not under copyright.
Patient and public involvement
As the information analysed in this study was publicly available, patients were not recruited for or actively involved in this study. Patients and the public were not involved in the design or planning of the study.
Results
Our exploratory analysis utses socioeconomic variables that have been linked with FSAs. These include a layer of campaign counts per FSA, income, education and housing (see figures 4–7 for screen captures).
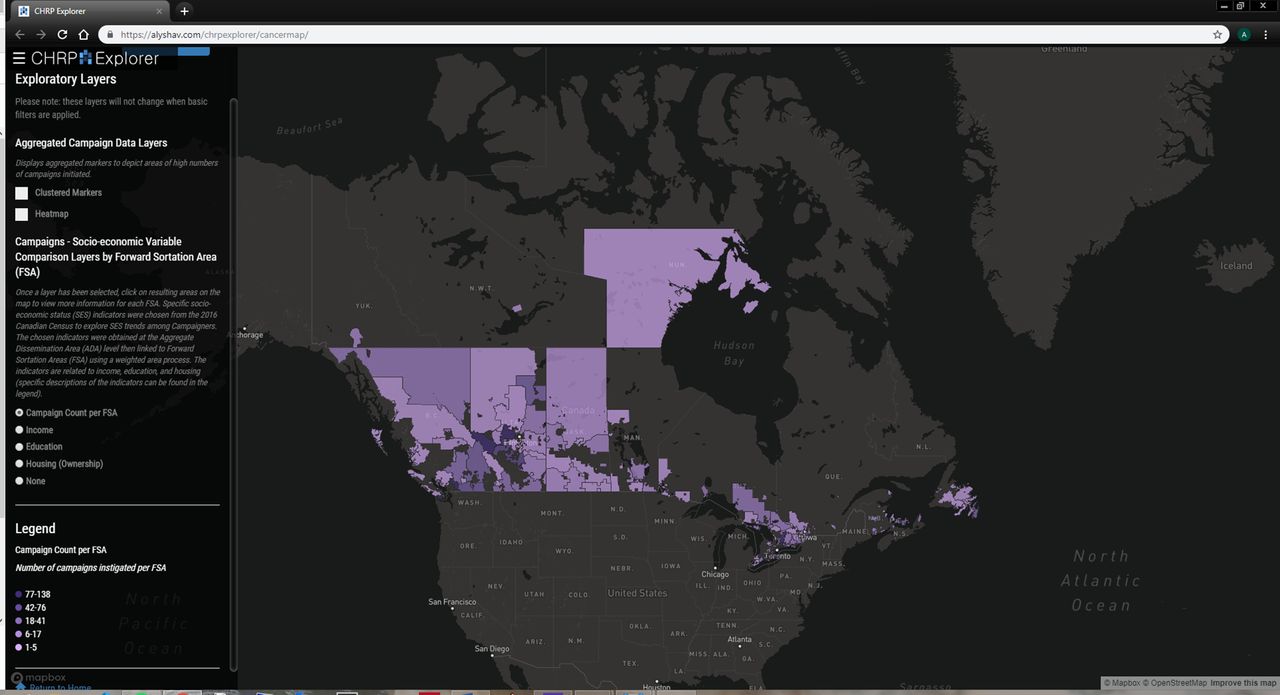
Screen capture of web map application (with the exploratory layer of frequency counts of campaigns per forward sortation area (FSA) displayed). This figure shows the CHRP displaying one of its exploratory layers. The variable of interest here is number of crowdfunding campaigns per forward sortation area. Permission has been granted to reproduce this image and it is not under copyright.
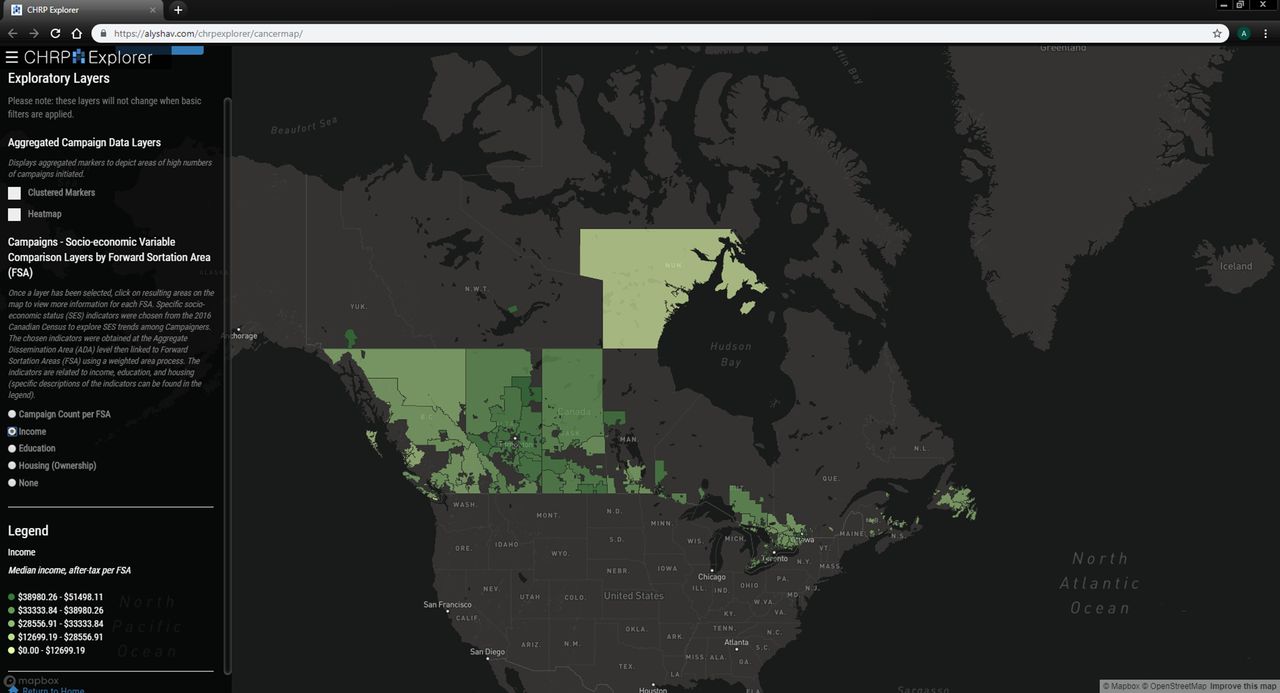
Screen capture of web map application (with the exploratory layer of income (median, after-tax, 2015) Displayed). This figure shows the CHRP displaying one of its exploratory layers. The variable of interest here is income (median, after-tax, 2015). The income data was obtained from the 2016 Canadian Census at the aggregate dissemination area (ADA) level. Permission has been granted to reproduce this image, and it is not under copyright.

Screen capture of web map application (with exploratory layer of education (number of people with a post-secondary education) displayed). This figure shows the CHRP displaying one of its exploratory layers. The variable of interest here is education (number of individuals that identify as having post-secondary education). The education data was obtained from the 2016 Canadian Census at the aggregate dissemination area (ADA) level. Permission has been granted to reproduce this image, and it is not under copyright.
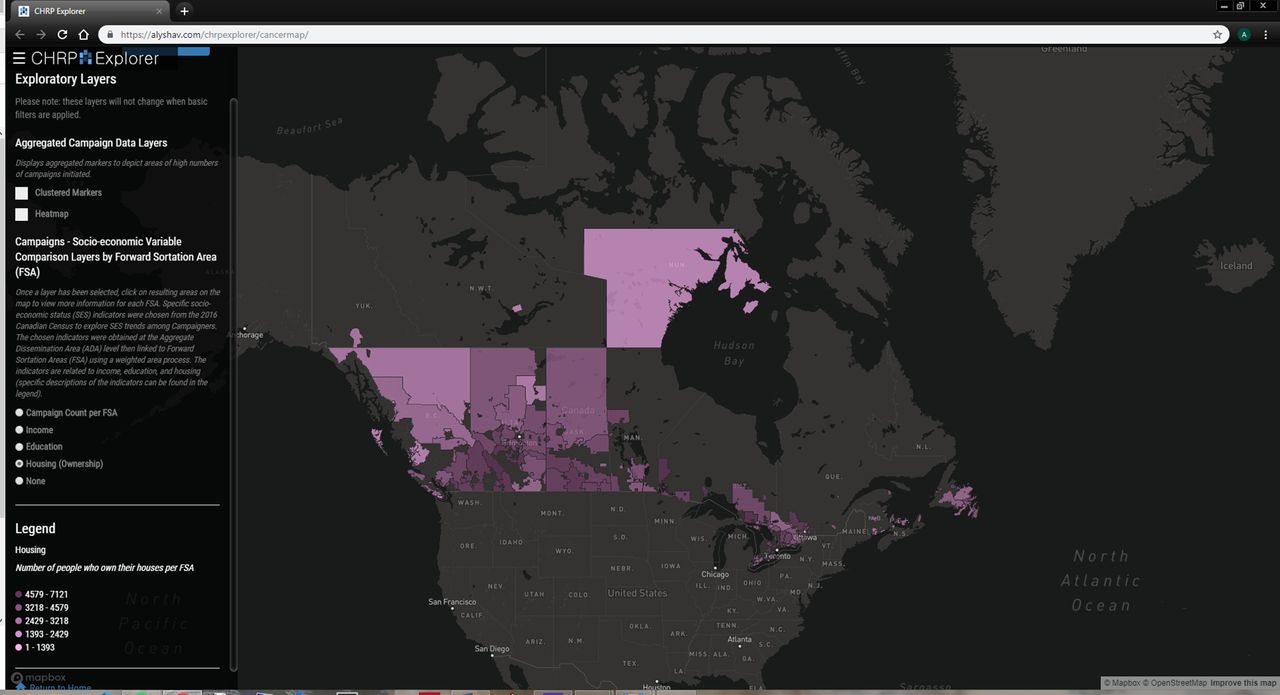
Screen capture of web map application (with the exploratory layer of housing (number of people that own homes) displayed). This figure shows the CHRP displaying one of its exploratory layers. The dataset of interest here is housing (number of individuals that own homes). The housing data was obtained from the 2016 Canadian Census at the aggregate dissemination area (ADA) level. Permission has been granted to reproduce this image, and it is not under copyright.
In addition to the web map, a table was generated that showed the proportion of crowdfunding campaigns that belong in each quintile for each socioeconomic variable (see tables 2–5).
Frequency of campaigns per forward sortation area (FSA): proportion of campaigns belonging to each quintile
Income, median after-tax (2015): proportion of campaigns belonging to each quintile
Education, post-secondary: proportion of campaigns belonging to each quintile
Housing, owner: proportion of campaigns belonging to each quintile
It is important to note that only 176 FSAs out of the 1620 FSAs in Canada contained at least one crowdfunding campaign, with the population of these FSAs representing approximately 5% of the national total. A separate table shows the distribution of the crowdfunding campaigns between each Canadian province and territory and the average value of each socioeconomic variable within each administrative division (see table 6).
Number of campaigns, population and socioeconomic values per province
The average income of crowdfunding campaigners in this dataset is within middle to high level FSAs, with 65.49% of campaigns located in FSAs within the three highest quintiles in the income category (see table 3). These higher income levels are matched by higher rates of home ownership among these campaigners, with housing ownership values being larger in the middle quintile (see table 5). This group also tends to be well educated, with education values tending toward the higher quintiles (see table 4).
Collectively, our ESDA shows that use of cancer-related medical crowdfunding is occurring unevenly across the country relative to population distribution. For example, Canadians’ cancer-related crowdfunding campaigns were also commonly located near city centres (see figure 3). Provincial differences in campaign use also exist. Campaigns were more commonly posted in the provinces of Ontario and British Columbia and less so in the Atlantic provinces. There is a noticeable density of campaigns in the prairie provinces of Alberta and Saskatchewan.
Discussion
Our ESDA-based findings support existing concerns that persons in positions of relative socioeconomic privilege disproportionately use crowdfunding to address health-related needs—in this case care related to cancer. Individuals in the highest income FSAs were found to be the heaviest users of medical crowdfunding for cancer-related campaigns, as were individuals in FSAs with high rates of home ownership. These ESDA-based interpretations support the idea that wealthier individuals are more likely to see crowdfunding as a way to draw together financial resources from elsewhere to meet their health needs. We also observed that individuals in FSAs with higher rates of education turned more frequently to medical crowdfunding. This ESDA-based interpretation supports existing claims that individuals who are better educated, more familiar with online technologies and better able to express themselves online are more likely to take advantage of crowdfunding to address health-related needs. The positive correlation between the amount raised in a campaign and number of times the campaign was shared supports the speculation that social capital and tech-savviness are important constituents of crowdfunding campaign success.
Our exploration of geodemographic trends regarding Canadians’ use of cancer-related crowdfunding shows that this is a highly urban phenomenon. This is somewhat counterintuitive considering the extensive health service gaps in rural Canadian communities that drive some residents to consider alternative ways to access necessary care,30 such as crowdfunding for the costs of private treatment or to relocate to an urban centre. Research regarding a potential urban–rural divide in crowdfunding use is very limited, and so it is difficult to know why there can be proportionately less use in rural areas. This may be due to limited access to technology or lower levels of education in rural Canadian communities.31 32 Alternatively, it may be due to strong voluntary and informal care sectors in ‘tight-knit’ rural communities that would lead to residents pulling together to support those in need,30 33 which would lessen the need for drawing on disparate social networks via crowdfunding. It is important to note, however, that our ESDA approach means that we cannot conclusively state that our analysis documents a clear urban–rural divide. This is due in part to the large aggregations of FSAs as well as the sparse population of Nunavut that can both overestimate and underestimate socioeconomic variables. We thus flag this as an important issue for future medical crowdfunding research. Furthermore, factors distinctive to the Canadian cultural, geographical and healthcare context may mean that these specific results are not applicable elsewhere. These factors include widespread access to basic cancer care through the Canadian single payer health system, cultural differences in charitable giving and the geographically disparate nature of Canadian communities. These differences may be less acute in European communities with greater access to public health insurance and greater in the USA and other countries with more limited pubic provision of care but requires additional investigation in other settings.
While our interpretations of the ESDA results support the general concern that medical crowdfunding will tend to exacerbate socioeconomic inequities in access to health-related care, only certain dimensions of this critique were explored here. For example, while we found positive correlations between cancer-related crowdfunding and wealth and education levels, we were not able to explore whether other dimensions of socioeconomic privilege are positively correlated. These dimensions include race, gender, ethnicity, nationality and linguistic fluency, all of which are factors that lead to inequities in health status.34 35 This leads us to make three important points. First, we acknowledge that it is possible that only certain dimensions of socioeconomic privilege correlate with using crowdfunding to address health-related needs, and that some or all of those not explored here do not shape medical crowdfunding use in the ways documented here. Second, and because of this, it is important to explicitly state that this exploratory analysis supports the hypothesis of a more general correlation but does not provide direct evidence supporting every dimension of this correlation. And third, we call for further research to explore the relationship between socioeconomic variables and medical crowdfunding use in general or for cancer-related campaigns in order to assist with developing a more robust understanding of any interrelationships.
Limitations
Only the first three digits of postal codes were included in the dataset of crowdfunding campaigns which were then linked to FSAs. FSAs are smaller in urban areas and may be geographically vast in rural areas. Linking ADAs to FSAs could result in broad generalisations and aggregation errors and lead to ecological fallacies. This implies that findings from our study are limited, as only broad claims can be stated. The aforementioned generalisations could be less impacted in urban areas with smaller FSAs comparatively to rural areas. While this has implications for our results, the impact may be reduced considering that as of 2011, over 80% of Canada’s population lives in urban environments.36
We acknowledge that a medical crowdfunding campaign recipient may be different from campaign’s creator. This necessitates further research with regard to the issues explored in this analysis because campaigners may reside in or report different FSAs than the individual or family in need of financial assistance. Further to this, postal codes are self-reported by campaign creators which allows mistakes to be made. Nothing can be done to address this as a limitation beyond acknowledging our awareness of the potential for errors to exist in postal code reporting. Campaigners may also have moved to an urban centre in order to access care, thus introducing an urban bias into our sample.
FSAs encoded in the campaign entries dictated the primary level of aggregation for our study, thus necessitating us to limit selection of socioeconomic variables. If spatial and non-spatial attributes were improved, more socioeconomic status variables could be involved, such as sex or immigration status. This would aid in obtaining more robust results. Another limitation encountered was the fact that the census profiles at the FSA level were unavailable due to accuracy issues (Statistics Canada, 2018).37 To substitute, a methodology to link and weight the chosen socioeconomic variables from the ADA level to FSA level had to be developed.
At the time this analysis was conducted, the Census profile for the FSA level was not published. To handle this, we selected the Socioeconomic Status (SES) variables from the ADA level. Performing an intersection operation between FSAs and ADAs, SES variables were added to FSAs based on the percentage of area shared. By taking the weighted average of SES variables from the ADAs that intersect with each FSA, values such as those for shown for Nunavut are impacted by the error accumulation from this procedure, where populations are sparse. Likewise, if there were any issues with values in the ADA -level SES data, these will propagate to the weighted SES variables linked to the FSAs. This means that data issues from the ADA Census profile product or low populations contribute to and exacerbate errors. The Nunavut values are correct with respect to this method applied. This is a systematic limitation that is exaggerated by the sparse population of Nunavut and affects all data reported in the tables at varying degrees.
As our dataset was acquired for a snapshot in time, we acknowledge that campaigns have been instantiated at different times and have been under way for varying durations. These comparisons may impact results because the campaign duration captured in the current dataset may not be representative of the overall success of the campaign. For example, less successful campaigns may be deleted more quickly than more successful campaigns, more successful campaigns may not be removed at all or less technologically adept individuals may not think to delete completed campaigns. Future work may look to compare individual campaigns that have either been run for the same length of time or have completed their respective lifecycles on major crowdfunding platforms.
Conclusions
The findings reported here support concerns that charitable crowdfunding will tend to advantage relatively socioeconomically privileged individuals. While supporters of medical crowdfunding point to its potential to help people access necessary healthcare and avoid debt or even medical bankruptcy, this paper demonstrates that this potential is not distributed equitably across society. While medical crowdfunding still benefits many, these findings show its limits in serving as a systematic and fair solution to structural deficiencies in health systems. Additional research, including using the methods described here, would help to demonstrate whether these findings are reproduced for other socioeconomic factors, in countries other than Canada, and for health needs beyond cancer.
References
Footnotes
Contributors AvD, AL and RM contributed to developing the methods, conducting the analysis and writing the manuscript. JS and VAC contributed to method design, securing project funding and writing the manuscript. PCW contributed to data acquisition and writing the manuscript. NS contributed to method design and writing the manuscript.
Funding This study was funded by the Canadian Institutes of Health Research. VAC holds the Canada Research Chair in Health Services Geographies and a Scholar Award from the Michael Smith Foundation for Health Research.
Competing interests None declared.
Provenance and peer review Not commissioned; externally peer reviewed.
Data sharing statement Data will be made available following publication via the SFU Vault data repository.
Patient consent for publication Not required.