Article Text

Abstract
Objectives Achieving the Sustainable Development Goals will require data-driven public health action. There are limited publications on national health information systems that continuously generate health data. Given the need to develop these systems, we summarised their current status in low-income and middle-income countries.
Setting The survey team jointly developed a questionnaire covering policy, planning, legislation and organisation of case reporting, patient monitoring and civil registration and vital statistics (CRVS) systems. From January until May 2017, we administered the questionnaire to key informants in 51 Centers for Disease Control country offices. Countries were aggregated for descriptive analyses in Microsoft Excel.
Results Key informants in 15 countries responded to the questionnaire. Several key informants did not answer all questions, leading to different denominators across questions. The Ministry of Health coordinated case reporting, patient monitoring and CRVS systems in 93% (14/15), 93% (13/14) and 53% (8/15) of responding countries, respectively. Domestic financing supported case reporting, patient monitoring and CRVS systems in 86% (12/14), 75% (9/12) and 92% (11/12) of responding countries, respectively. The most common uses for system-generated data were to guide programme response in 100% (15/15) of countries for case reporting, to calculate service coverage in 92% (12/13) of countries for patient monitoring and to estimate the national burden of disease in 83% (10/12) of countries for CRVS. Systems with an electronic component were being used for case reporting, patient monitoring, birth registration and death registration in 87% (13/15), 92% (11/12), 77% (10/13) and 64% (7/11) of responding countries, respectively.
Conclusions Most responding countries have a solid foundation for policy, planning, legislation and organisation of health information systems. Further evaluation is needed to assess the quality of data generated from systems. Periodic evaluations may be useful in monitoring progress in strengthening and harmonising these systems over time.
- Health Informatics
- International Health Services
- Infectious Diseases
This is an open access article distributed in accordance with the Creative Commons Attribution Non Commercial (CC BY-NC 4.0) license, which permits others to distribute, remix, adapt, build upon this work non-commercially, and license their derivative works on different terms, provided the original work is properly cited, appropriate credit is given, any changes made indicated, and the use is non-commercial. See: http://creativecommons.org/licenses/by-nc/4.0/.
Statistics from Altmetric.com
Strengths and limitations of this study
To our knowledge, this is the first detailed multicountry assessment of national case reporting, patient monitoring and vital statistics systems.
Given that this survey was administered electronically, there may have been differences in how respondents interpreted question and answer choices.
Knowledge and experience of respondents may have varied from office to office.
Given that the survey represents 15 countries globally, the results may not be globally representative.
Given that survey respondents did not answer all questions, there are differences in the denominator across questions.
Introduction
Data should guide governments as they plan, budget, and act for health. The Sustainable Development Goal (SDG) for health, ensure healthy lives and promote well-being for all at all ages, requires data on disease transmission, service coverage and outcomes and causes of death (table 1).1 These data can come from various sources including surveys, longitudinal studies and data systems. Given that surveys and longitudinal studies often are time-limited, require external resources and take time to design and administer, the role of systems in generating population disaggregated, geographically specific and timely data is becoming more important.2
Corresponding health information systems for SDG 3, ensure healthy lives and promote well-being for all at all ages
WHO has specified that key data sources for health information systems include individual records (such as case reports and disease registries), service records from health providers, civil registration and vital statistics, among others.3 For the purposes of this survey, we honed in on three core systems used for disease identification, service provision and vital status monitoring. These include: (1) communicable disease case reporting from individual records, (2) patient monitoring from service records and (3) vital statistics derived from civil registration systems. Communicable disease case reporting is traditionally used to monitor trends in disease transmission across different geographic settings and among different populations as part of routine surveillance.4 Patient monitoring can be used to monitor health service coverage, such as treatment for HIV, tuberculosis, childhood immunisations, among others as part of universal healthcare coverage.5 Well-functioning civil registration and vital statistics (CRVS) systems produce data on registered births, deaths (including cause of death) as well as marriages, adoptions and divorces; public health authorities primarily focus on registration of births, deaths and causes of deaths for decision making.6
For case reporting, many of the global norms and standards trace back to disease-specific reporting requirements, the Integrated Disease Surveillance and Response (IDSR) framework and to the International Health Regulations.7 8 Patient monitoring, and other health information systems, are transitioning from paper-based to electronic-based systems.9 The Statistical Commission of the United Nations provides comprehensive principles and recommendations for CRVS systems to achieve universal coverage, continuity, confidentiality and regular dissemination in order to be a dependable and primary data source for vital statistics.10 Although WHO collates global health data in its Global Health Observatory,11 to our knowledge there are few publications evaluating contributing systems in detail.12 The objective of this article is to summarise the status of case reporting, patient monitoring and CRVS systems among a sample of low-income and middle-income countries.
Methods
Survey design
The survey team, comprised global experts in informatics, surveillance and programme, jointly developed a survey covering policy, planning, legislation and organisation of case reporting, patient monitoring and CRVS systems. This survey was primarily designed to assess the state of information systems that could potentially be leveraged for HIV-related clinical surveillance, monitoring progress towards meeting national and global goals and improving national responses.13 The survey was piloted prior to full implementation by review from system-specific experts and staff working in country offices for content and usability of the survey tool. The survey was administered through a tool developed in Excel (Microsoft, Seattle, Washington, USA). The tool consisted of multiple-choice questions and text boxes through which respondents could elaborate on their selections (online supplementary tables S1-S3).
Definitions
For the purposes of establishing a common framework for administration of this tool, we developed definitions for case reporting, patient monitoring and CRVS systems:
A functioning case reporting system routinely collects information on diagnosed disease-specific cases. These cases may be reported from health facilities or providers to a central level. At subnational and national levels, these data can be used to track epidemics and quantify the burden of disease in order to inform public health programmes. For example, some countries may use IDSR to report individual and aggregated newly diagnosed cases of communicable disease.
Patient monitoring systems collect routine data from health facilities related to clinical patient management. Patient monitoring systems are often used to measure service coverage and quality. Data are often used to assess the health sector response from the facility to the national level.
CRVS systems register births, deaths, cause of deaths, marriages and divorces. In public health, authorities focus on the registration of births, deaths and cause of deaths to track population demographics and patterns of disease. CRVS can generate disease-specific mortality trends to inform burden and impact assessments.
Data collection
We surveyed all regional and country Centers for Disease Control (CDC) offices with Division of Global HIV and Tuberculosis staff outside of the USA (online supplementary table S4). CDC country staff overseeing strategic information (encompassing health information systems, surveillance and monitoring and evaluation) were selected as key informants and were contacted by email to complete the tool. One staff member was contacted per country. Respondents were encouraged to liaise with their national government counterparts for questions to which they did not know the answer. Questions that the counterpart did not know, and for which they were unable to liaise with their counterpart, were left blank. We administered the questionnaire via email in January 2017. Up to three follow-up emails were sent to non-respondents from February to May 2017. The results were then reviewed with government counterparts for validity.
Supplementary file 4
Data management and analysis
Country key informants entered their responses directly into the Excel tool. All country files were cleaned and merged into a Stata database (StataCorp, College Station, Texas, USA). The Stata database was then exported to Excel (Microsoft, Redmond, Washington, USA) for analysis. Any response that was left blank or indicated ‘not applicable’ was excluded from the denominator when percentages were calculated. With countries acting as our unit of measure we had limited statistical power and chose not to conduct statistical tests but rather describe the results of the survey using proportions. Since different questions were left blank or indicated not applicable from key informants, most of the descriptive analyses have different denominators. Tableau (Tableau, Seattle, Washington, USA) was used for creating maps with OpenStreetMap images while Excel was used to create descriptive tables. The United Nations Human Development Index was used to summarise life expectancy, mean years of schooling and gross national income per capita.14 World Bank thresholds were used to classify countries as low, lower-middle or upper-middle income.15
Patient and public involvement
This survey included countries rather than patients as a unit of measure. Patients and the public were not involved in the design or planning of the study.
Results
Overall, 15 of 51 (29%) country key informants responded to the tool (online supplementary table S4). Socioeconomic characteristics of responding countries, including life expectancy, mean years of schooling, gross national per capita income and human development index, are found in table 2.14 15
Human development indicators and World Bank economy classification for responding countries
Case reporting systems
Key informants from 14 of 15 (93%) countries that responded to the case reporting systems section of the survey indicated that the Ministry of Health was responsible for disease case reporting. Overall, there was legislation mandating reporting for at least one disease in 13 of 15 (87%) of responding countries. Domestic financing contributed to funding case reporting systems in 12 of 14 (86%) responding countries. Some form of unique identifier was used for 8 of 14 (57%) of responding countries. All 14 responding countries indicated a physical barrier, software barrier, legal barrier, encryption and/or unique ID being used as a security measure. The majority of case reporting systems were linked to patient monitoring (80%) and laboratory information systems (70%) with a small proportion being linked to CRVS systems (10%). These findings and others are presented in table 3. Key informants from 13 of 15 responding countries (87%) reported an electronic component in the country’s case reporting system, and 8 of these 13 (62%) countries collect data on individual cases (figure 1). Eleven of the 13 (85%) responding countries reported that the coverage of the case reporting system exceeded 75% (figure 1).

Case reporting systems by system type and geographic coverage. Map created with OpenStreetMap images.
Characteristics of case reporting systems by region
Patient monitoring systems
Key informants from 13 of 14 (93%) countries that responded to the patient monitoring systems section of the survey indicated that the Ministry of Health was responsible for patient monitoring. The primary use of patient monitoring data was to monitor service coverage (reported by 12 of 13 countries, 92%); however, 8 of 13 (62%) and 10 of 13 (77%) reported using patient monitoring data for service quality improvement and commodity forecasting, respectively. Multilateral (9 of 12 countries, 75%) and bilateral (9 of 12 countries, 75%) financial support was more common for patient monitoring compared with case reporting. Five of 12 countries (42%) of patient monitoring systems used the same system for monitoring in the private and public health sector. Two of 14 (14%) countries used patient monitoring for social health insurance reimbursement. Patient monitoring systems were linked to case reporting (43%) and laboratory information systems (71%), vital statistics (43%) and health insurance systems (14%). These findings and others are presented in table 4. Key informants from 11 of 12 (92%) responding countries reported an electronic component in the country’s patient monitoring system, and 7 of these 11 (64%) countries collect data on individual patients (figure 2). Seven of the 11 (64%) responding countries reported that the coverage of the patient monitoring system exceeded 75% (figure 2).

Patient monitoring systems by system type and geographic coverage. Map created with OpenStreetMap images.
Characteristics of patient monitoring systems by region
CRVS systems
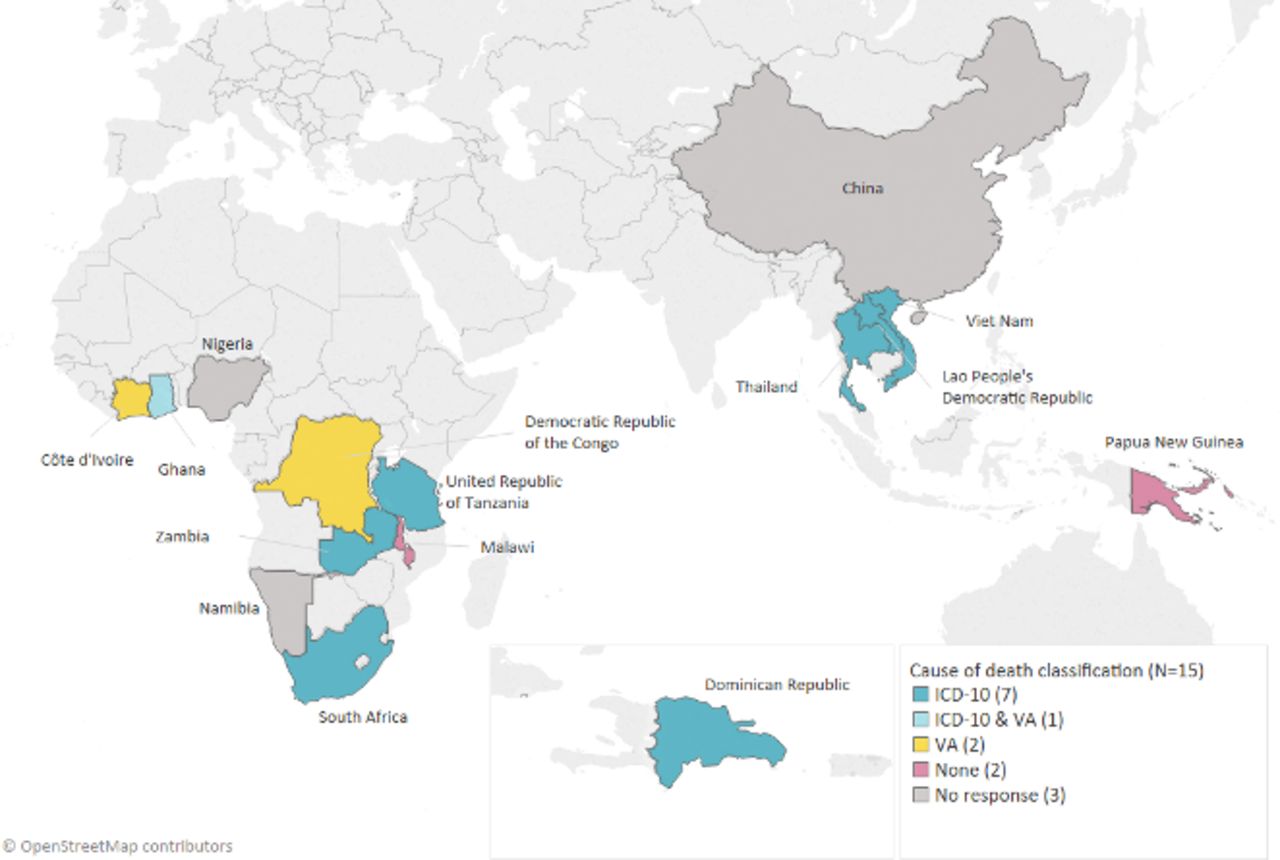
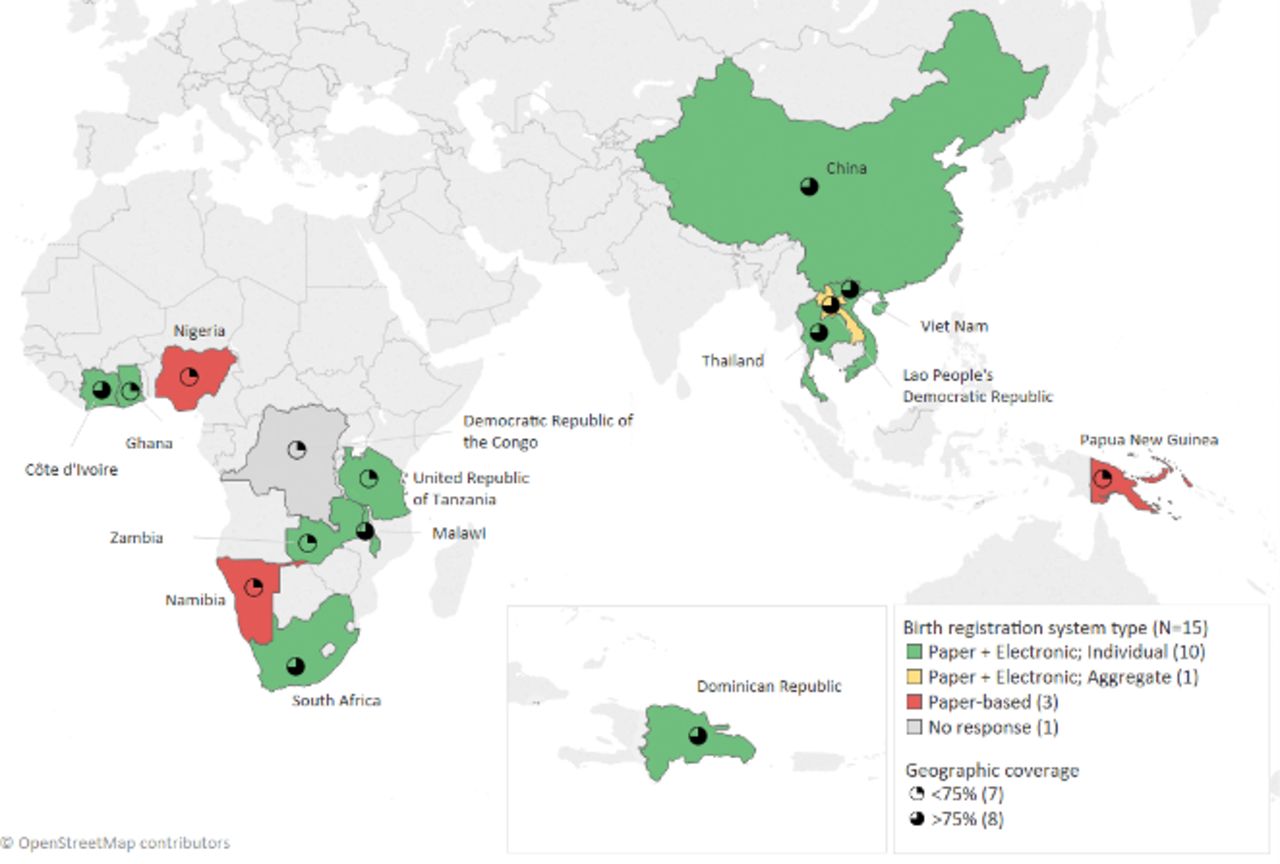
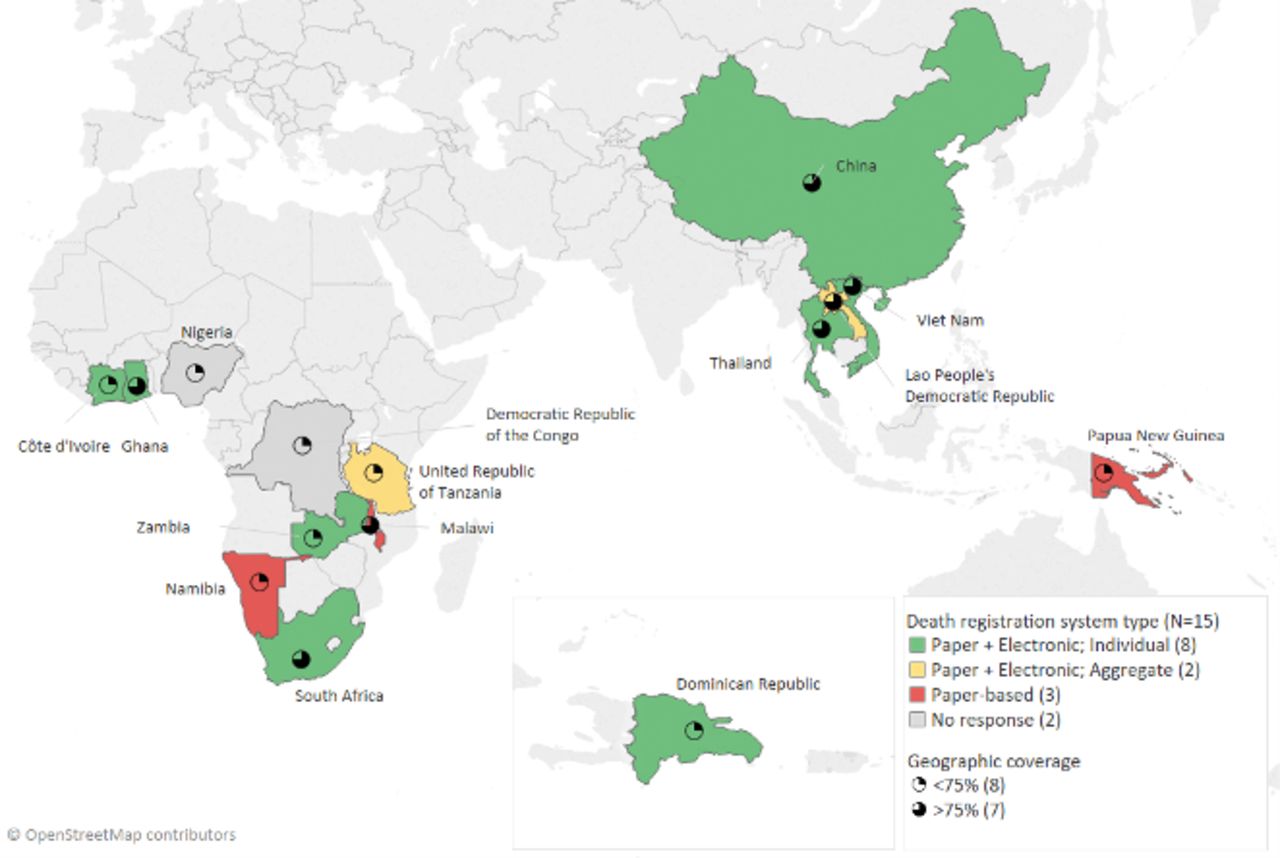
Key informants from 8 of 15 (53%) countries that responded to the CRVS systems section of the survey indicated that the Ministry of Health was responsible for CRVS, in 7 of 15 responding countries (47%) the Ministry of Interior (or similar) was responsible for CRVS, and in 4 of 15 countries (27%) the Ministry of Justice was responsible for CRVS. There were some countries in which multiple Ministries were responsible for CRVS. There was legislation mandating birth and death registration in 13 of 14 (93%) countries. Birth and death data were used to quantify service need (7 of 12 countries, 58%), analyse cost-effectiveness (6 of 12 countries, 50%), measure impact of disease programmes (7 of 12 countries, 58%) and to measure the national burden of disease (10 of 12 countries, 83%). Birth and death registration was required to access government services in all 15 responding countries (100%). These findings and others are presented in table 5. Key informants from 10 of 13 responding countries (77%) reported an electronic component for birth registration, and 9 of these 10 (90%) countries collect data on individual births (figure 3). Key informants from 7 of 11 responding countries (64%) reported an electronic component for death registration, and 6 of these 7 (85%) countries collect data on individual deaths (figure 4). Key informants from 8 of 12 (67%) reported that the country used the tenth revision of the International Classification of Disease (ICD-10) for reporting the cause of death while 2 of 12 (17%) responding countries indicated that the vital statistics system used verbal autopsy to ascertain the cause of death (figure 5). Eight of 15 (53%) and 7 of 15 (47%) responding countries reported that the coverage of the vital statistics system registering births and deaths, respectively, exceeded 75% (figures 4 and 5, respectively).

Vital statistics systems for registering births by system type and geographic coverage. Map created with OpenStreetMap images.

Vital statistics systems for registering deaths by system type and geographic coverage. Map created with OpenStreetMap images.
Cause of death classifications in death registration and mortality surveillance. Map created with OpenStreetMap images.
Characteristics of CRVS systems by region
Discussion
Case reporting, patient monitoring and CRVS systems were widely implemented and used in responding countries. These systems generate critical data for public health planning, budgeting and action. There was funding for these systems from national budgets, bilateral arrangements and multilateral mechanisms, suggesting some level of political commitment for their development and implementation. Many countries also reported use of electronic and individual-level data, suggesting that more granular and accessible data may be available for end-users. Overall, these are encouraging trends which will hopefully continue in order to accelerate progress towards meeting the SDGs. Importantly, these results are indicative of systems interpreted by key informants as meeting the survey definitions and do not speak to the breadth of coverage relative to specific diseases or interoperability.
The majority of responding countries had >75% geographic coverage of their case reporting system. Moreover, most responding countries had an electronic component to their system. Electronic systems could help store increased volumes of data over time, store more detailed data prospectively and provide more rapid access to such data compared with paper-based systems.16 Understanding the number of diagnosed cases of diseases can directly inform programme response to contain transmission.8 All responding countries used case reporting data to achieve this. Future qualitative studies may help understand the ways in which case reporting data are used to contain disease transmission. For example, in Uganda a command centre was created to house an interdisciplinary rapid response team to receive, evaluate and distribute information as the centre of communication and coordination response operations.17 Many diseases require their own diagnostic commodities as part of national diagnostic algorithms. For example, HIV requires combinations of two or three rapid tests to diagnose each case.18 Approximately half of responding countries used case reporting data for commodity forecasting. As observed with medicines, central procurement, informed by case reporting data, could provide cost savings and increase availability of diagnostics at service delivery sites.19
The primary use of data from patient monitoring systems by responding countries was to monitor coverage of services. This is likely due to the importance of monitoring the coverage of key health sector interventions for reproductive health, communicable diseases and national immunisation schedules.5 Countries may also have disease-specific patient monitoring systems. Many countries are embarking on the development of national health insurance schemes as part of universal healthcare coverage.20 Given the wide geographic scale, and use of individual-level electronic data in many settings, there may be an opportunity to leverage these systems for processing claims and co-payments for services rendered.21 Based on this survey, some countries are using the same system for social health insurance while others have linked the patient monitoring system to the health insurance system. Lessons learnt from each of these scenarios should be further examined and documented.
Overall, more countries reported systems for registering birth events relative to deaths. This is consistent with globally available data suggesting that birth registration rates are higher than death registration rates.6 ICD-10 remains the global norm for classifying the cause of death within the health sector.22 In this survey, the majority of responding countries reported use of ICD-10 for classifying the cause of death. Death registration, and methods to ascertain the cause of death, are more heterogeneous in communities. Verbal autopsy has shown promise as an option to incorporate within CRVS systems when medical certification of cause of death is not possible23 and many countries reported using this approach. Vital statistics were required for a wide range of government services. The most common government service requiring birth registration was school enrolment; this requirement has been shown to be associated with higher coverage of national birth registration rates.24 25 The most common requirement for death registration was the need for a burial permit. This requirement may also be important in improving national death registration rates.26 27
There were several cross-cutting issues relevant to case reporting, patient monitoring and vital statistics systems. For example, there were a range of approaches for identification of people in systems. These included using national identification, health identification and system-generated identification. Across all systems national identification was used most often. Given the global momentum behind achieving SDG target 16.9, achieving free and universal legal identity by 2030, use of national identification may increase further with time.28 Security measures to protect data from unauthorised use has emerged as a critical issue in light of the transition to electronic data systems.29 In this survey, physical barriers, software barriers, legal barriers, encryption and use of unique identifiers were security measures used. Software and physical barriers were most common, suggesting opportunities for using encryption, legal protection measures and unique identifiers. Unique identifiers can offer complementary protections by limiting the number of locations, both paper and electronic, where names are used but do have additional risks such as re-identification of an identity from an available data source that uses the same unique identifier. Linking different information systems can provide improved inferences for patients longitudinally over their life course.30 The majority of case reporting systems were linked to patient monitoring and laboratory information systems with a small proportion being linked to vital statistics. The majority of patient monitoring systems were linked to case reporting and laboratory information systems with a minority linked to vital statistics and health insurance systems. Linking systems with health insurance may have implications on improved data quality since the data will directly affect staff remuneration for services rendered.31
One of the major limitations of this survey was the low response rate. Specifically, there were limited responses from the Americas, Central Asia and Eastern Europe. These regions comprise middle-income countries that may have a different health information system context. Reducing the number of questions and administering the survey later in the year may help improve the number of respondents in the future. We relied on knowledge and experience of participating staff members which may vary from office to office. Although attempts were made to extract missing information, and verify provided information from government counterparts, there were still questions without answers from some respondents. This may have been because they had less developed systems or because they did not know the answer at the time they filled the survey. Requiring all questions to be answered could improve our confidence in the final estimates. Moreover, since we conducted this survey electronically, there may have been differences in the way questions were interpreted across different key informants. This could have affected their answer selection. For example, linkage could be interpreted as interoperability across different systems or producing summary information for the same location and time while coverage could have used health facilities, regions or other measures as a denominator. Including more definitions in the survey tool could establish common terminology during future iterations of this survey. The electronic format of the survey also meant that there were limited opportunities to qualify answers. For example, although we collected information on whether individual or aggregated data were available in electronic systems, we did not describe pathways of data flow. In the future, use cases, success stories and lessons learnt may be based on specific answers during subsequent qualitative interviews of stakeholders. During the implementation of this survey, CDC placed additional field staff in countries through its Division of Global Health Protection. In the future, it may be worth reaching out to key informants in CDC countries irrespective of their programme focus to have the widest reach. Some important aspects of health information systems, such as interoperability, standards and required workforce competencies, were not covered in this survey and may merit further exploration. Since some countries may manage civil registration and vital statistics separately there is potential for confusion from key informants on how to respond to questions encompassing CRVS holistically. Finally, evaluating the quality of data generated from systems requires different methods that should be evaluated as part of future assessments.
To our knowledge, this is the first detailed assessment of national case reporting, patient monitoring and vital statistics systems. Most responding countries have a solid foundation for policy, planning, legislation and organisation of health information systems. There are opportunities to link systems, strengthen security measures for electronic data and use data more effectively. Periodic evaluations may help understand progress in strengthening and harmonising these systems over time to achieve the SDGs.
Supplementary file 1
Supplementary file 2
Supplementary file 3
References
Footnotes
ABS and AK contributed equally.
Contributors ABS and AK conceived of the survey. ABS, AK, OJ, E-JM, RLR, EKN, CSM, DR, WH designed and planned the survey. ABS and AK conducted the survey. AA-Q, FA, CA, GA, DB, GB, LB, MC, ITD, MDK, JD, JH, IJ, SJ, SK, LL, LRL, NL, LéL, AM, RM, GSM, LAM, MM, JM, NM, AN, RGN, YN, TAN, CEN, AAO, ZP, ERí, VS, BS, HTS, VHS, MS, SS, AT, PT, CW, DX, AY, DY and HZ contributed country-level data to the survey. AK conducted the analyses. ABS drafted the first version of the manuscript and all coauthors revised it critically for important intellectual content.
Funding This article was made possible by support from the US President’s Emergency Plan for AIDS Relief (PEPFAR) through the Centers for Disease Control and Prevention under the terms of project number CGH2017233.
Competing interests None declared
Ethics approval The Office of Science from the Center for Global Health at CDC deemed this survey to not require CDC Institutional Review Board review and approved the survey protocol for implementation.
Provenance and peer review Not commissioned; externally peer reviewed.
Data sharing statement Requests for de-identified data should be addressed to the corresponding author.
Patient consent for publication Not required.
Map disclaimer The depiction of boundaries on the map(s) in this article do not imply the expression of any opinion whatsoever on the part of BMJ (or any member of its group) concerning the legal status of any country, territory, jurisdiction or area or of its authorities. The map(s) are provided without any warranty of any kind, either express or implied.