Article Text

Abstract
Objective Sugar-sweetened beverages (SSBs) are associated with hyperuricaemia and gout. Whether other important food sources of fructose-containing sugars share this association is unclear.
Design To assess the relation of important food sources of fructose-containing sugars with incident gout and hyperuricaemia, we conducted a systematic review and meta-analysis of prospective cohort studies.
Methods We searched MEDLINE, Embase and the Cochrane Library (through 13 September 2017). We included prospective cohort studies that investigated the relationship between food sources of sugar and incident gout or hyperuricaemia. Two independent reviewers extracted relevant data and assessed the risk of bias. We pooled natural-log transformed risk ratios (RRs) using the generic inverse variance method with random effects model and expressed as RR with 95% confidence intervals (CIs). The overall certainty of the evidence was assessed using the Grading of Recommendations Assessment, Development and Evaluation system.
Results We identified three studies (1 54 289 participants, 1761 cases of gout), comparing the highest with the lowest level of exposure for SSBs, fruit juices and fruits. No reports were found reporting incident hyperuricaemia. Fruit juice and SSB intake showed an adverse association (fruit juice: RR=1.77, 95% CI 1.20 to 2.61; SSB: RR=2.08, 95% CI 1.40 to 3.08), when comparing the highest to lowest intake of the most adjusted models. There was no significant association between fruit intake and gout (RR 0.85, 95% CI 0.63 to 1.14). The strongest evidence was for the adverse association with SSB intake (moderate certainty), and the weakest evidence was for the adverse association with fruit juice intake (very low certainty) and lack of association with fruit intake (very low certainty).
Conclusion There is an adverse association of SSB and fruit juice intake with incident gout, which does not appear to extend to fruit intake. Further research is needed to improve our estimates.
Trial registration number NCT02702375; Results.
- uric acid
- systematic review and meta-analysis
- gout
- sugars
- fructose
- food sources of fructose containing sugars
This is an open access article distributed in accordance with the Creative Commons Attribution Non Commercial (CC BY-NC 4.0) license, which permits others to distribute, remix, adapt, build upon this work non-commercially, and license their derivative works on different terms, provided the original work is properly cited, appropriate credit is given, any changes made indicated, and the use is non-commercial. See: http://creativecommons.org/licenses/by-nc/4.0/.
Statistics from Altmetric.com
- uric acid
- systematic review and meta-analysis
- gout
- sugars
- fructose
- food sources of fructose containing sugars
Strengths and limitations of this study
This systematic review and meta-analysis assessed the certainty of the evidence using the Grading of Recommendations Assessment, Development and Evaluation (GRADE) system.
Large prospective cohort studies that were of high quality and had a long duration of follow-up were included.
Most of the pooled results showed good consistency (low between study heterogeneity) and sugar-sweetened beverages showed evidence of a dose–response gradient.
Only three prospective cohort studies with low external generalisability were available for inclusion.
The observational design of the prospective cohort studies did not allow for causal inferences to be drawn.
Introduction
Gout and associated hyperuricaemia are both associated with the development of hypertension, insulin resistance syndrome1 and cardiovascular disease (CVD).2 Different diets have been shown to be associated with the development and severity of gout.3 Foods that increase net adenosine triphosphate (ATP) degradation including alcohol and high purine meats are risk factors for gout.1 Ingestion of large amounts of the monosaccharide fructose can increase uric acid production during its metabolism in the liver through unregulated phosphorylation of ATP into adenosine monophosphate (AMP)1 as demonstrated in randomised controlled trials.4 5 Similarly, in cohort studies, high intake of fructose-containing sugars in the form of sugar-sweetened beverages (SSBs) is associated with incident gout.6 It is unclear whether the association seen for SSBs intake holds for other important food sources of fructose-containing sugars, such as fruit and fruit-based products, grains and grain-based products, dairy and dairy-based products and sweets and desserts. As dietary guidelines and public health policy move from nutrient-based recommendations towards food and dietary-based recommendations,3 4 7 it is important to understand the contribution of these different food sources of fructose-containing sugars to the association of incident gout. To address this gap, we conducted a systematic review and meta-analysis of prospective cohort studies of the relation of important food sources of fructose-containing sugars with incident gout and hyperuricaemia.
Method
Design
We followed the Cochrane Handbook for Systematic Reviews of Interventions8 for the conduct of our systematic review and meta-analysis and reported our results according to the Meta-analysis of Observational Studies in Epidemiology (MOOSE)9 and Preferred Reporting Items for Systematic Reviews and Meta-Analysis (PRISMA)10 guidelines. The study protocol was registered at ClinicalTrials.gov (identifier, NCT02702375; Results).
Search strategy
We conducted systematic searches in MEDLINE, Embase and Cochrane through 13 September 2017 with no language restriction (online supplementary table 1). Targeted manual searches served to supplement the database search; these included finding related papers from references of selected papers and review articles, perusing articles with data from major prospective cohorts that usually report dietary data and speaking to experts in the field.
Supplementary file 1
Study selection
We included prospective cohort studies of ≥1-year duration that assessed the association of important food sources of fructose-containing sugars including non-alcoholic beverages (SSBs), cereal grain and grain-based products, fruit and fruit-based products, dairy and dairy-based products and sweets, chocolate and desserts with incident gout or hyperuricaemia in participants free from gout or hyperuricaemia at the start of the study. One-year duration was chosen as it allows sufficient time for the development of disease.
Data extraction
Two independent reviewers (SA-C and QL) extracted relevant data from included studies onto standardised pro forma. Extracted data included sample size, subject characteristics, sources of fructose-containing sugars, exposure levels, duration of follow-up, number of gout or hyperuricaemia cases, model adjustments and the risk ratio (RR) with 95% confidence intervals (CIs) per quantile of intake. The main outcome was incident gout or hyperuricaemia expressed as RR with 95% CIs. Discrepancies were resolved by consensus.
Risk of bias
The same two independent reviewers (SA-C and QL) assessed each study for risk of bias. Risk of bias was assessed using the Newcastle-Ottawa Scale (NOS) for prospective cohort studies. Points were awarded based on cohort selection, comparability of groups and assessment of outcomes, for a maximum total of 9 points.11 Studies with ≥6 points were considered high quality.11 Difference between reviewers was resolved by consensus.
Statistical analyses
Primary pooled analyses and sensitivity analyses were conducted using Review Manager (RevMan) 5.3 (The Nordic Cochrane Centre, The Cochrane Collaboration, Copenhagen, Denmark). Dose response analyses were performed using Stata V.14 (StataCorp, College Station, Texas, USA). Natural log-transformed RR for incident gout or hyperuricaemia, comparing extreme quantiles (the highest exposure versus the lowest exposure or reference group), were pooled separately for each food source of fructose-containing sugars using the generic inverse variance method with DerSimonian and Laird random effects models and expressed as RRs with 95% CI. To overcome a unit-of-analysis error for studies appearing more than once in the same analysis, we divided participants equally among the multiple comparisons and readjusted the log-SEs.8 Interstudy heterogeneity was assessed with the Cochran Q statistic with significance set at p<0.10 and quantified with the I2 statistic, where I2≥50% represented evidence of substantial heterogeneity.8 Interaction between food sources was assessed using Cochran Q statistic for between group interaction. We explored sources of heterogeneity by sensitivity analyses. Influence analyses, where each study was systematically removed and effect size was recalculated in the remaining studies, were carried out to explore the influence of individual studies on the pooled risk. As ≥10 cohort comparisons were not available, a priori subgroup analyses were not performed. Linear and non-linear dose–response analyses were assessed using generalised least squares trend estimation models (GLST) and fixed-effects restricted cubic spline model with three knots, respectively.12 Publication bias was not assessed as the number of cohort comparisons was less than 10.
Grading of the evidence
The overall certainty and the strength of the evidence was assessed using the Grading of Recommendations Assessment, Development and Evaluation (GRADE) system.13–25 The evidence was graded as high, moderate, low or very low certainty, with observational studies starting with an initial grade of ‘low’. This then can be downgraded based on five prespecified criteria or upgraded based on three prespecified criteria. Criteria to downgrade included risk of bias (weight of studies showed risk of bias as assessed by low NOS <6), inconsistency (substantial unexplained interstudy heterogeneity, ie, I2>50%), indirectness (presence of factors that limit the generalisability of the results), imprecision in the pooled risk estimate (the 95% CI for risk estimates are wide or cross a minimally important difference of 10% for benefit or harm [RR 0.9–1.1]) and publication bias (evidence of small-study effect). Conversely, criteria to upgrade included a large magnitude of association (RR >2 or RR <0.5 in the absence of plausible confounders), dose–response gradient or reasonable evidence of attenuation of the pooled effect estimate by confounders.
Patient and public involvement
The study was performed using published data. No patients or the public were involved in the study.
Results
Search results
Figure 1 shows the flow of the systematic search and study selection. Of the 309 reports identified by the literature search, three reports with data from three prospective cohort studies met our inclusion criteria26–28: Nurses’ Health Study (NHS),27 Health Professionals Follow-up Study (HPFS)26 and the National Runner’s Health Study (NRHS).28 All three reports reported the association of food sources of fructose-containing sugars on incident gout but none did on incident hyperuricaemia. These reports involved a total of 154 289 participants with 1761 incident cases of gout. Two reports each reported data on fruit intake (n=75 383; 983 cases),26 28 fruit juice (n=125 299; 1533 cases)26 27 and SSBs (n=125 299; 983 cases).26 27 We did not identify prospective cohort studies reporting the association of other food sources of fructose-containing sugars (eg, cereal grain and grain-based products, sweets and desserts, dairy and dairy based products and chocolate) with incident gout fitting our inclusion criteria.

Summary of evidence search and selection. Flow of the literature search for the effect of food sources of sugar intake on incident gout and hyperuricaemia. Of the 309 studies initially identified, 294 were excluded based on title and/or abstract. The remainder were read in full by two independent reviewers; after, 12 were further excluded. Included in this analysis were three prospective cohort studies.
Study characteristics
Table 1 lists the characteristics of the included prospective cohort studies. All studies were performed in the USA. The median age of the included participants ranged from 30 to 75 years. The median follow-up period was 17 years (range: 12–22 years) for SSB, 18.7 years (12–22 years) for fruit juice and 9.9 years (7.74–12 years) for fruit. Dietary intake assessments were done with self-reported, validated food frequency questionnaires (FFQs) in all studies. Quantiles of exposure depended on the food source. Medians for the lowest and highest quantiles of exposure were <1 servings/month and ≥14 servings/week, respectively, for SSB; ≤1 servings/month and ≥14 servings/week, respectively, for fruit juice; and ≤0.4 servings/week (range: <0–0.5 servings/week) and ≥8 servings/day (range: ≥2–14 servings/day), respectively, for fruit. The ascertainment of incident gout in both HPFS and NHS cohorts26 27 was through self-report, followed by supplementary surveys of the subjects based on the American College of Rheumatology gout survey criteria29 to confirm that the diagnosis. The authors defined individuals with gout that met ≥6 of the 11 criteria for gout. In addition, in a subsample, the self-reported diagnoses were validated with medical records. As for the NRHS cohort,28 incident gout was self-reported based on physician diagnosis.
Characteristics of prospective cohort studies investigating food sources of fructose-containing sugar intake and incident gout
Online supplementary table 2 shows the complete list of adjusted confounding variables for the most adjusted models for each of the included prospective cohorts. The median number of variables in the most adjusted models was 14 (range: 6–14). All studies adjusted for primary and secondary confounders such as age, body mass index and history of hypertension. Each of the three cohorts were single-sex studies, so adjustment for sex was not necessary. The NHS cohort study authored by Choi et al 27 and NRHS study by Williams et al 28 were agency funded, while the HPFS paper authored by Choi and Curhan26 was funded by both agency and industry.
Study quality
Online supplementary table 3 shows the study quality assessments by the NOS. There was no evidence of serious risk of bias. Only NRHS cohort scored <6 on the NOS scale, which denotes lower quality.28
Fruit intake and incident gout
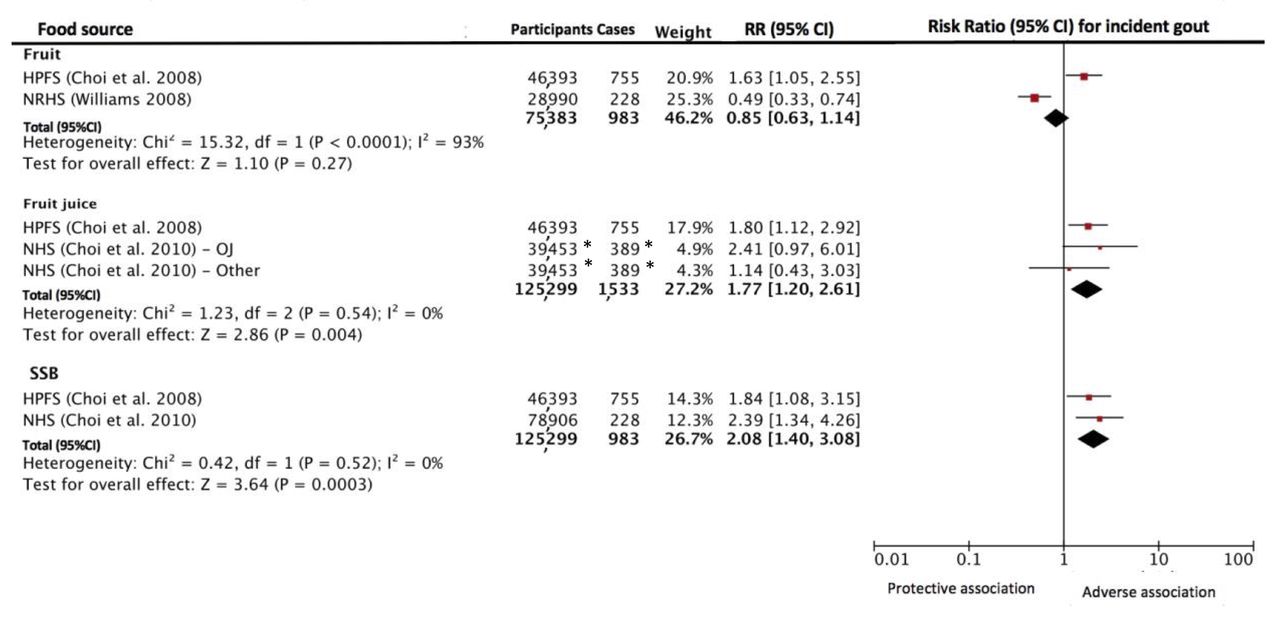
Figure 2 shows the relationship between food sources of fructose-containing sugars intake and incident gout. There was significant interaction between the food sources (p=0.02). When comparing the highest to the lowest fruit intake, no association was shown for fruit intake on incident gout (RR=0.85 [95% CI 0.63 to 1.14]). There was evidence of significant interstudy heterogeneity (I2=93%, p<0.001).
Relation between intake of fruit, fruit juice and SSB incident gout. Estimates from most adjusted multivariate models accounting for food sources of fructose-containing sugars intake were used. The diamond represents the pooled effect estimate. Interstudy heterogeneity was tested using the Cochran Q statistic and quantified using the I2 statistic (I2 ≥50% indicative of significant heterogeneity). All results are presented as RR with 95% CI. OJ=orange juice. Other=other fruit juices. *The number of cases and participants are divided equally between the multiple entries of the study to ensure total count gives unique individuals. To overcome a unit-of-analysis error for studies appearing more than once in the same analysis, we readjusted the log-SEs to participants equally among the multiple comparisons. HPFS, Health Professionals Follow-up Study; NHS, Nurses’ Health Study; NRHS, National Runner’s Health Study; RR, risk ratio; SSB, sugar-sweetened beverage.
Fruit juice intake and incident gout
Figure 2 shows the relationship between fruit juice intake and incident gout. When comparing the highest to lowest intake, an adverse association was shown for fruit juice intake on incident gout (RR 1.77 [95% CI 1.20 to 2.61]). There was no evidence of significant interstudy heterogeneity (I2=0% [95% CI 0% to 90%], p=0.54).
SSB intake and incident gout
Figure 2 shows the relationship between SSB intake and incident gout. When comparing the highest with the lowest intake, an adverse association was shown for SSB intake on incident gout (RR=2.08 [95% CI 1.40 to 3.08]). There was no evidence of significant interstudy heterogeneity (I2=0%, p=0.52).
Additional analysis
Influence analysis (the systematic removal of each study), publication bias and subgroup analyses could not be performed due to the small number of studies included in each analysis (n=2).
Dose–response analysis
A random effect GLST model showed a significant dose–response relationship between fruit juice intake and incident gout per serving/week (RR=1.03, 95% CI 1.02 to 1.05, p<0.001) (online supplementary figure 1) and for SSB intake (RR=1.04, 95% CI 1.02 to 1.07, p<0.001) (online supplementary figure 2). Fruit juice intake showed a significant departure from linearity (p=0.038), and visual inspection of the graph (online supplementary figure 1) indicated a plateau for risk increase after ≥5 servings per day. There was no evidence for departure from linear dose–response gradient or dose thresholds for SSB intake while using the restricted cubic spline model (p=1.29) (online supplementary figure 2). Dose–response modelling was not conduced for fruit intake due to lack of data.
GRADE assessment
Table 2 shows the GRADE assessment of individual food sources of fructose-containing sugars. The certainty of the evidence for an adverse association of both fruit and fruit juice intake with incident gout was rated as very low, with downgrades of one level for indirectness for fruit juice intake and of two levels for inconsistency and one level each for indirectness and imprecision for fruit intake. The certainty of the evidence for an adverse association of SSB intake with incident gout was rated as moderate, with a downgrade of one level for indirectness but upgrade of two levels for a large magnitude association and significant dose–response gradient.
GRADE assessment of individual food source of fructose-containing sugars
Discussion
We conducted a systematic review and meta-analysis of studies investigating the relation of important food sources of fructose-containing sugars with incident gout. We identified three prospective cohort studies26–28 comprising of 154 289 participants and 1761 cases of incident gout. The pooled analyses revealed that there was moderate certainty of evidence that SSB intake was associated with a 208% increase in incident gout when comparing the highest with the lowest intake. There was very low certainty of evidence that fruit juice intake was associated with a 77% increase in incident gout and that fruit intake was not associated with incident gout . There was no data available for other important food sources of fructose-containing sugars.
Findings in the context of the literature
Our results are consistent with previous research that indicate that the intake of certain food sources of fructose-containing sugars is associated with the risk of gout. Our previous systematic review and meta-analysis of prospective cohort studies found a harmful relationship between fructose consumption and gout.6 While that study indicated that fructose moiety might possibly drive the association with gout, all the fructose data in the included studies was derived from SSB intake. Another systematic review of the literature identified numerous dietary factors associated with the risk of gout including meat, alcohol, seafood and SSBs and also that lower risk was associated with the intake of dairy, folate and coffee.3
SSBs are a major source of fructose-containing added sugars in the western diet comprising around 30% of intake of added sugars in the USA30 and around 24% in Canada.31 Excess intake of fructose can increase uric acid though an unregulated phosphofructose kinase pathway that uses substantial amounts of ATP32 to convert fructose into fructose-1-phosphate in the liver.33 Mechanistically, net ATP degradation leads to accumulation of AMP, which is subsequently degraded to uric acid. Additionally, fructose can increase de novo purine synthesis, which further produces uric acid.1 This increase in uric acid can lead to the development of gout. Since we were unable to investigate the relationship between food sources of fructose-containing sugars and hyperuricaemia, we cannot validate this mechanism. It is possible that fructose increases the risk of gout independently of serum uric acid levels. However, since the link between fructose and serum uric acid,34–37 and the link between serum uric acid and the development of gout have been independently established,1 it is unlikely that fructose increases the risk of gout without using uric acid as an intermediate.
We identified adverse association of fruit juices intake with incident gout. The two studies that contributed to this result26 27 were both performed in two Harvard cohorts that do not differentiate between fruit drinks and pure fruit juice, the former being largely similar to SSBs, that is, mainly sugar and water. This difference between pure fruit juice and fruit drink is supported by studies investigating pure fruit juice and fruit drinks that show divergent response for cardiometabolic disease.38 39
We did not see any association between fruit intake and incident gout, but the individual effect estimates from the two studies were in opposite direction. The NRHS28 cohort showed a 51% reduction in the risk of gout with high intake of fruit, whereas the HPFS26 cohort showed a 63% increased risk; both studies were performed in men. These discordant results highlight the differences in the studies. HPFS cohort26 only measured oranges and apples, fruit high in fructose, while NRHS28 cohort assessed all fruit that might represent a healthier dietary intake. It is also possible that higher intake of fruits in NRHS might be associated with high intake of dairy or coffee, which have been associated with lowering the risk of gout.3 As the data on dairy and coffee was not reported by NRHS, this remains a speculation. The harmful association for oranges, which are rich in vitamin C, in HPFS26 cohort is at odds with another study from the same cohort, in which the authors demonstrated a protective association of vitamin C intake with gout.40 While fruits are rich in fructose that can increase uric acid levels, fruit intake has consistently shown a benefit for cardiometabolic risk factors, cardiometabolic diseases and all-cause mortality.41–47 Several case–control and cross-sectional studies have shown a protective effect of total fruit intake with gout although only in Asian populations,48 49 their relevance to the included studies, conducted in a largely Caucasian population, might be limited. More data from different populations might clarify the association between fruit intake and gout.
We could not find any prospective studies looking at the association of food sources of fructose-containing sugars and hyperuricaemia even though hyperuricaemia is the most important risk factor for gout.3 50 Hyperuricaemia is also a risk factor for hypertension, metabolic syndrome, diabetes and CVD.51 Several cross-sectional analyses have investigated the link between SSB consumption and serum uric acid levels, showing a positive relationship.34–37 In contrast, the analysis of the National Health and Nutrition Examination Survey (NHANES) showed no link between dietary fructose and risk of hyperuricsemia, indicating that perhaps different food sources of fructose-containing sugars may have different effects on serum uric acid. This point is reinforced by another analysis of NHANES data that showed a relationship of SSB intake with higher serum uric acid concentration but not with fruit juice intake.52 Future studies investigating food sources of sugars and risk of hyperuricaemia may help to elucidate some of the above inconsistent findings.
We were not been able to find prospective cohort studies investigating the association of other food sources of fructose-containing sugars and the risk of gout, though cross-sectional studies suggest that cereal and yoghourt consumption may be associated with lower serum uric acid.53 More research is needed to assess the relationship between other food sources of fructose-containing sugars and the risk of gout.
Strengths and limitations
Our analysis has many strengths. First, we employed a comprehensive systematic search across major databases and the quantitative synthesis of results. Second, the studies we included had a substantial number of participants and cases of gout (154 289 participants and 1761 gout cases) providing increased precision. Additionally, the median follow-up duration was greater than 10 years, which allowed for enough time from exposure for the development of disease. Another strength is the use of validated measures of intake like FFQs. The two Harvard cohorts26 27 administered FFQ multiple times and validated them on a subsample, allowing for more accurate and robust long-term intakes compared with the NRHS28 cohort, which only measured dietary intakes at baseline. In our analysis, we made use of GRADE to evaluate the certainty and strength of our analysis and evaluate our confidence in the estimates.
There are some notable limitations to our systematic review and meta-analysis. First, while we included the most adjusted multivariable models for this analysis, there is always potential for unmeasured and residual confounding, since the studies included were observational in nature. This explains why GRADE starts at ‘low certainty’ for observational studies. Second, there was evidence of serious indirectness in all of the relationships. All studies were conducted in the USA, and two of the three studies were conducted in health professionals. The two Harvard26 27 cohorts included only middle aged or older people who worked in healthcare and who were predominately white, and the NRHS28 cohort included only middle to old-aged physically active men. Thus, the specific nature of the included studies’ population limits the generalisability of our results to other populations and geographical locations; however, the biological process of diet and gout are still likely to be similar to other populations. While genome-wide association studies have found numerous genes that increase one’s risk for gout54 and some ethnic groups may be more susceptible than others,1 it is not known if the association of fructose intake with gout is modified by genes. Third, there was evidence of serious imprecsion and very serious inconsistency (heterogeneity) in our estimates for fruit intake with the sources of incosistency remaining unexplained; with only three studies identified, we were unable to assess publication bias or perform sensitivity analyses or a priori subgroup analysis. Thus, for these reasons, data pertaining to the relation of SSB and fruit juice intake with incident gout received a GRADE of moderate certainty and very low certainty, respectively, indicating that further studies may change the estimate for SSB intake and are very likely to change the estimate for fruit juice intake which is very uncertain; therefore, caution should be used when interpreting these results. Similarly for fruit intake, which received a GRADE of very low certainty, we are very uncertain and caution should be used in the interpretation of these results.
Implications
Dietary guidelines have shifted their focus from nutrient-based recommendations to food and dietary pattern-based recommendations,55 since it has been recognised that one does not eat nutrients in isolation but as a part of foods. Interactions between nutrients in food are complex, and the whole food matrix works as a whole to increase or decrease disease risk.55 Our findings support this view of food matrix affect independent of a single-nutrient in relation to food sources of fructose-containing sugars and their relationship with gout.
Our findings also have implications for recommendations for the prevention of gout. Conventional dietary recommendations for gout have focused on restriction of purine intake; however, low-purine diets are often high in carbohydrates, including fructose-rich foods.56 We have shown an adverse association between fruit juices and SSBs, supporting the recommendations to limit their intakes. Since we did not have data relating to children, hyperuricaemia or other food sources of fructose-containing sugars, we cannot extend our conclusion to these groups of individuals or these foods.
Conclusion
Our systematic review and meta-analysis of prospective cohort studies showed an adverse association of SSB and fruit juice intake with the risk of gout, while there was no association with fruit intake. The strength of the evidence was moderate for SSB intake and very low for fruit juice and fruit intake, as assessed by GRADE. For SSB intake, the true association is likely to be close to the estimate, but there is a possibility that it is substantially different. For fruit juice and fruit intake, the true association are likely to be substantially different from the estimate, and future research will very likely impact our confidence in the effect estimates and likely to change them.57 Our results are consistent with the literature that certain food sources of fructose-containing sugars, especially SSBs, are a risk factor for the development of gout. We were unable to identify studies assessing food sources of fructose-containing sugars and hyperuricaemia, indicating a gap in the literature. Given that incident gout is rising in many countries7 58–63 and that gout and hyperuricaemia are both associated with metabolic syndrome, myocardial infarction, diabetes and premature death,1 2 64 it is becoming increasingly important to identify and understand risk factors for developing gout. It is imperative for additional prospective studies to assess the intake of various food sources of fructose-containing sugars and their relationship with gout and hyperuricaemia in diverse populations. These future directions will aid in identifying the extent to which our foods mediate the risk for hyperuricaemia and gout and will further inform healthcare professionals, policymakers, and aid in the development of improved dietary guidelines for the prevention and management of gout and hyperuricaemia.
References
Footnotes
Contributors All authors had full access to all of the data (including statistical reports and tables) in this study and take full responsibility for the integrity of the data and the accuracy of the data analysis. Conception and design: JLS. Analysis and interpretation of the data: all authors. Drafting of the article: SA-C, QL, TAK, JLS. Critical revision of the article for important intellectual content: all authors. Final approval of the article: all authors. Statistical expertise: TAK and RJdS. Obtaining of funding: JLS. Administrative, technical or logistic support: SBM. Collection and assembly of data: QL, SA-C and FA-Y. Guarantor: JLS.
Funding This work was funded by the Canadian Institutes of Health Research (funding reference number, 129920). The Diet, Digestive tract, and Disease (3-D) Centre, funded through the Canada Foundation for Innovation and the Ministry of Research and Innovation’s Ontario Research Fund, provided the infrastructure for the conduct of this project. JLS was funded by a PSI Graham Farquharson Knowledge Translation Fellowship, Canadian Diabetes Association (CDA) Clinician Scientist award, Canadian Institutes of Health Research (CIHR) Institute of Nutrition, Metabolism and Diabetes (INMD)/Canadian Nutrition Society (CNS) New Investigator Partnership Prize and Banting & Best Diabetes Centre Sun Life Financial New Investigator Award. None of the sponsors had a role in any aspect of the present study, including design and conduct of the study; collection, management, analysis, and interpretation of the data; and preparation, review, approval of the manuscript or decision to publish.
Provenance and peer review Not commissioned; externally peer reviewed.
Data sharing statement There is no additional unpublished data available.
Patient consent for publication Not required.