Article Text

Abstract
Objective To quantitate the 2016 global and national burden of chronic kidney disease (CKD) attributable to ambient fine particulate matter air pollution ≤ 2.5 μm in aerodynamic diameter (PM2.5).
Design We used the Global Burden of Disease (GBD) study data and methodologies to estimate the 2016 burden of CKD attributable to PM2.5 in 194 countries and territories. Population-weighted PM2.5 levels and incident rates of CKD for each country were curated from the GBD study publicly available data sources.
Setting GBD global and national data on PM2.5 and CKD.
Participants 194 countries and territories.
Main outcome measures We estimated the attributable burden of disease (ABD), years living with disability (YLD), years of life lost (YLL) and disability-adjusted life-years (DALYs).
Results The 2016 global burden of incident CKD attributable to PM2.5 was 6 950 514 (95% uncertainty interval: 5 061 533–8 914 745). Global YLD, YLL and DALYs of CKD attributable to PM2.5 were 2 849 311 (1 875 219–3 983 941), 8 587 735 (6 355 784–10 772 239) and 11 445 397 (8 380 246–14 554 091), respectively. Age-standardised ABD, YLL, YLD and DALY rates varied substantially among geographies. Populations in Mesoamerica, Northern Africa, several countries in the Eastern Mediterranean region, Afghanistan, Pakistan, India and several countries in Southeast Asia were among those with highest age-standardised DALY rates. For example, age-standardised DALYs per 100 000 were 543.35 (391.16–707.96) in El Salvador, 455.29 (332.51–577.97) in Mexico, 408.41 (283.82–551.84) in Guatemala, 238.25 (173.90–303.98) in India and 178.26 (125.31–238.47) in Sri Lanka, compared with 5.52 (0.82–11.48) in Sweden, 6.46 (0.00–14.49) in Australia and 12.13 (4.95–21.82) in Canada. Frontier analyses showed that Mesoamerican countries had significantly higher CKD DALY rates relative to other countries with comparable sociodemographic development.
Conclusions Our results demonstrate that the global toll of CKD attributable to ambient air pollution is significant and identify several endemic geographies where air pollution may be a significant driver of CKD burden. Air pollution may need to be considered in the discussion of the global epidemiology of CKD.
- nephrology
- chronic renal failure
- public health
This is an open access article distributed in accordance with the Creative Commons Attribution Non Commercial (CC BY-NC 4.0) license, which permits others to distribute, remix, adapt, build upon this work non-commercially, and license their derivative works on different terms, provided the original work is properly cited, appropriate credit is given, any changes made indicated, and the use is non-commercial. See: http://creativecommons.org/licenses/by-nc/4.0/.
Statistics from Altmetric.com
Strengths and limitations of this study
The study leveraged the availability of the Global Burden of Disease study data, which is the most comprehensive compilation and analysis of global health information available.
The study quantitated the burden of chronic kidney disease (CKD) attributable to air pollution using the combined measure of disability-adjusted life-years, which comprehensively captures the years of healthy life lost due to dying prematurely and to the years living with disability.
For each estimate reported in this study, we also provide a measure of uncertainty (uncertainty intervals) to reflect how much is known, but more importantly how much is not known.
The burden was quantitated at the country level; the study does not provide subnational estimates of CKD burden.
Global burden of disease estimates, while considered robust and reliable, are necessarily limited by the quality of the available data.
Introduction
Several studies described substantial geographic variation in the burden of chronic kidney disease (CKD) that cannot be explained by traditional drivers including diabetes and hypertension.1–4 It was suggested that other risk factors including environmental pollution may explain these geographic variations.5 We recently characterised fine particulate matter of <2.5 µm in aerodynamic diameter (PM2.5) as a novel risk factor for development and progression of kidney disease and described a linear relationship between exposure to levels of PM2.5 and risk of incident CKD, kidney disease progression and end-stage renal disease.6
The global burden of kidney disease attributable to ambient air pollution has not been previously described. A quantitative assessment of the global burden of kidney disease attributable to air pollution might explain some of the geographic variation in burden of kidney disease, help identify endemic areas and contribute to the global and national discussions about the effect of environmental pollution on non-communicable disease in general and, more specifically, on the potential impact of air pollution on the global epidemiology of CKD. In this work, we used the Global Burden of Disease (GBD) study methodologies to estimate the burden of CKD attributable to fine particulate matter air pollution in 194 countries and territories using the following measures: attributable burden of disease (ABD), years living with disability (YLD), years of life lost (YLL) and disability-adjusted life-years (DALYs).
Methods
Global data sources
National PM2.5 exposure levels were obtained from publicly available 2016 GBD data.7–9 The GBD PM2.5 values are derived from the integration of satellite data, surface measurements, geographic data and a chemical transport model at a 1° (approximately 11 by 11 km at the equator) resolution, and then aggregated to national-level population-weighted means to produce a national exposure estimate.7 8 Estimates of global and national incident rates, YLDs, YLLs, DALYs of CKD and their uncertainty levels were obtained from the publicly available 2016 GBD.10 11 The GBD aims to use all accessible information on disease occurrence, natural history and severity that meets inclusion criteria, drawing on a large network of collaborators for subject matter expertise on disease and injury to generate internally consistent, comprehensive global health statistics on the burden of disease.12 GBD uses an integrative Bayesian meta-regression method that estimates a generalised negative binomial model for all epidemiological data through DisMod-MR 2.1 to compute GBD estimates of disease burden including YLDs, YLLs and DALYs.12 Estimates are generated using hierarchical modelling methodology that accounts for temporal, geospatial, sex, age and cause specific variance to establish attributable burden of disease across all levels of the GBD framework.10 13–16 Key to GBD estimates are the propagation of uncertainty through the modelling process, which incorporates uncertainty due to diversity in data sources, sparsity of data for some parts of the world, modelling choices and other factors that impact estimation such as the determination of disability weights. Detailed descriptions of overall GBD 2016 methodologies and specific CKD methodology have been provided elsewhere.10 12–17 Population size was obtained from the GBD Population Estimates dataset.18 Country income classifications were obtained from the World Bank.19
PM2.5 risk estimation
PM2.5 risk estimation was obtained from prior work assessing the association of PM2.5 with kidney disease outcomes.6 Department of Veterans Affairs datasets were linked with the Centers for Disease Control and Prevention’s National Environmental Public Health Tracking Network annual particulate matter estimates for the contiguous USA, which originates from Community Multiscale Air Quality modelled output.20 Time-dependent adjusted Cox proportional hazard survival models, where cohort participants’ exposure was updated annually and on movement in residence, were used to investigate the association between PM2.5 and time until incident estimated glomerular filtration rate (eGFR) <60 mL/min/1.73 m2. Models were adjusted for age, race, sex, cancer, cardiovascular disease, chronic lung disease, diabetes mellitus, hyperlipidaemia, hypertension, eGFR at time of cohort entry, body mass index, smoking status, ACE inhibitor/angiotensin receptor blocker use, county population density, number of outpatient eGFR measurements, number of hospitalisations and county percent in poverty. Restricted cubic spline analyses of PM2.5 suggested no deviation from linearity in the range of PM2.5 in the study (5.0–22.1 µg/m3). Alternate analyses using time zero exposure values and using National Aeronautics and Space Administration (NASA) data as an alternate exposure source produced consistent results.21 22 Ambient sodium levels were investigated as a negative control, where there existed no biological bases to support an association with risk of incident CKD. Results for every IQR (the distance between the 25th and 75th percentile; 0.046 µg/m3) increase in sodium showed a vanishingly weak association, 0.99 (0.99–0.99). Results were consistent in sensitivity analyses that used ground-level measures only and that assessed potential confounding by shared regional characteristics.6 To estimate risk in each country, we relied on the PM2.5 pollution and risk relationship characterised in the prior study described above6 where PM2.5 levels ranged from 5.0 to 22.1 µg/m3.6 In this study, we took a conservative approach where we considered annual average PM2.5 exposure greater than 22.1 µg/m3 to contribute the same amount of risk as an exposure of 22.1 µg/m3.7 23 This approach is supported by findings from GBD and several other studies where integrated exposure response functions suggest that risk of adverse health outcomes of PM2.5 pollution levels off (follows a near plateau morphology) at PM2.5 concentrations exceeding 20–25 µg/m3.7 8 23
Population attributable fraction and ABD
The population attributable fraction (PAF) of CKD due to PM2.5 exposure above the theoretical minimum risk exposure level (TMREL) was calculated using an adapted GBD equation.14 This PAF can be interpreted as the proportion of incident CKD attributable to PM2.5 exposure that exceeds the TMREL. The proportional hazards-based equation for PAF in a country is:

where HR(x) is the HR for PM2.5 at the national exposure level, and HR(TMREL) is the HR for PM2.5 at the TMREL. The TMREL was defined according to the GBD study methodologies.8 23 24 The TMREL was assigned as a uniform distribution of PM2.5 from 2.4 µg/m3to 5.9 µg/m3, which represents exposure values between the minimum and fifth percentiles of exposure distributions from outdoor air pollution cohort studies included in the GBD anlayses.8 23 24 Levels under the TMREL were treated as contributing no risk.8 Results were repeated using the WHO Air Quality Guidelines for annual average of PM2.5 concentration of 10 µg/m3 as the TMREL.25
Burden of CKD attributable to PM2.5 above the TMREL, as the number of incident CKD per year attributable to PM2.5 above the TMREL, was calculated using estimates from the 2016 GBD,13 from the equation:

where PAF is the population attributable fraction, IR is the incident rate of CKD, and population is the size of the population of the country or territory in which the burden is being assessed.2 Results were repeated using the WHO TMREL.
YLD, YLL and DALYs
YLD, YLL and DALY values were estimated by multiplying the CKD-specific GBD values of the corresponding burden measure by the PAF,13 17 resulting in YLD, YLL and DALY values due to CKD attributable to PM2.5. YLD, YLL and DALY estimates due to CKD were obtained from the GBD results tool.10 11 The basis of their calculation is presented below; further information has been described elsewhere.13 17 Results were repeated using the WHO TMREL.
YLD due to CKD is calculated as:

where P is the prevalent cases of CKD in the population, and DW is the disability weight for CKD representative of the severity of its impact on a person’s life (0: no impact, to 1: the same as death). YLD due to CKD is a measure of the burden placed on a population due to the ill effects of living with CKD.26
YLL due to CKD is calculated using the equation:

where N is the number of deaths due to CKD and L is the difference between age of death and average life expectancy due to CKD. YLL due to CKD is a measure of the burden placed on a population due to dying prematurely from CKD. Estimates of the difference between average life expectancy and age of death from CKD come from a GBD set of age and location–year specific life tables.10 13–16
DALYs due to CKD is calculated using the equation:

The DALY due to CKD is a summary measure of YLD and YLL and represents the total years of healthy life lost due to ill health, disability or early death due to CKD.
Measure estimation and uncertainty
In order to incorporate the uncertainty in measurements used in our estimation, all measures were generated from a distribution of 10 000 predictions, where the median (uncertainty interval (UI): 2.5th–97.5th percentile) are reported. Predictions incorporated uncertainty by randomly sampling from, unless otherwise specified, constructed normal distributions of the relevant measures. Uncertainty was derived from the TMREL distribution, the SE of the PM2.5 beta estimate and the uncertainty of the incident rates, YLD, YLL and DALY from the GBD data. While accounting for variability in measures, measures sampled under 0 were set to 0. Values of 0 thus represent instances of estimated zero burden, reflective of areas where the corresponding PM2.5 levels are below the TMREL distribution or where uncertainty was enough to result in such estimates. Maps of age-standardised rates are presented. All analyses were performed in SAS Enterprise Guide V.7.1. Maps were generated using Arc Map 10 (ESRI, Redlands, California, USA). The circular layout image was generated using the Circos software package.27
Frontier analysis
Frontier analysis was conducted as a quantitative methodology to identify the lowest potentially achievable age-standardised DALYs on the basis of development status as measured by the Sociodemographic Index (SDI). SDI is a summary measure of a country or territory’s sociodemographic development; it is a composite measure of average income per person, educational attainment and total fertility rate in any given country. The minimum possible SDI is 0, while the maximum is 100; it is comparable across geography and over time.28 The DALYs frontier delineates the minimum DALY that could be achieved for every geography (country or territory) given its SDI. Distance from the frontier is termed effective difference; if a country or territory exhibits a large effective difference from the frontier given its SDI, then this likely suggests unrealised opportunities for gains or improvement (reduction in DALYs) that should be possible based on the country or territory’s state on the development spectrum. A data envelope analysis, which allows for non-linear frontiers, using the free disposal hull method was developed to produce a frontier for age adjusted DALYs.28 29 In order to account for uncertainty, we used 1000 bootstrapped samples of the data, randomly sampling with replacement from all countries and territories. LOESS regression was then used on this result to produce a smoothed frontier.28 Super-efficient countries were excluded, to remove the influence of outliers, in the generation of the frontier.28 Absolute distances from the frontier of each country are reported as effective difference, where any countries with lower DALYs than the frontier were assigned a 0 distance.
In order to account for the effect of variation in prevalence of primary drivers of CKD (hypertension and diabetes) on differences in overall DALY rates, we repeated the frontier analysis following a decomposition analysis to generate risk deleted cause-specific age-standardised DALY rates of CKD attributable to PM2.5,17 where risks deleted were hypertension and diabetes. Diabetes and hypertension cause-specific CKD rates were obtained from the 2016 GBD, which were then subtracted from overall rates and then multiplied by the PAF.11 The risk deleted DALY can be conceptualised by the formula:

where DALYO is the DALY due to other causes, DALYDHO is the DALY due to all three causes and PAFDH is the population attributable fraction due to diabetes and hypertension.
Patient involvement
No patients were involved in developing the aims, design or implementation of this study. No patients were involved in the interpretation of study results, or write up of the manuscript.
Results
Global burden of kidney disease attributable to air pollution
In 2016, the global annual burden of incident CKD attributable to elevated PM2.5 was, in 1000s, 6950.51 (95% uncertainty interval: 5061.53–8914.74). ABD rate per 100 000 people was 94.29 (68.67–120.94), and age-standardised ABD rate per 100 000 was 101.39 (74.49–129.69) (table 1).
Attributable burden of chronic kidney disease (ABD) associated with PM2.5 exposure globally and for the top 10 most populous countries
The 2016 global YLD, YLL and DALYs of CKD attributable to elevated PM2.5 are reported in table 2 as absolute values in 1000s, rates per 100 000 population and age-standardised rates per 100 000. Age-standardised rates for YLD, YLL and DALYs were 40.97 (26.84–57.11), 122.71 (90.36–153.52) and 163.69 (120.58–207.28), respectively (table 2).
Years living with disability (YLD), years of life lost (YLL) and disability-adjusted life-years (DALYs) of chronic kidney disease associated with PM2.5 for the top 10 most populous countries
Burden of kidney disease attributable to air pollution at the national level
ABD, YLD, YLL and DALYs reported as absolute values, as rates per 100 000 population and as age-standardised rates per 100 000 population for 10 most populated countries (tables 1 and 2) and for 194 countries and territories are provided in online supplementary table 1 and online supplementary table 2.
Supplementary file 1
Among the 10 most populated countries in the world, India followed by China had the highest attributable burden of incident CKD due to air pollution globally (ABD=10 92.52, UI=791.38–1407.28, and 766.73, 558.72–985.14, in 1000s, respectively). India also outranked China in estimates standardised by population size and age distribution (table 1). Age-standardised ABD in the 10 most populated countries showed Nigeria, Bangladesh and India having high burden exceeding 100 incident cases of CKD per 100 000 population (table 1). Age-standardised ABD per 100 000 population varied substantially among geographies, where it was highest in Guinea-Bissau, El Salvador, Senegal, Togo, Benin, Mauritania, Chad, Ghana, Niger and Mali (online supplementary table 1 , figure 1). Mapping the geographic distribution of age-standardised ABD rates showed high burden in Mesoamerica, several countries in Central and South Africa, Mongolia and several countries in the Far East and the Eastern Mediterranean region (figure 1). Countries with the lowest age-standardised ABD per 100 000 population included Canada, Greenland, several countries in Scandinavia, Brunei, New Zealand and Australia (online supplementary table 1 , figure 1).

Age-standardised burden (ABD) of incident chronic kidney disease attributable to PM2.5 per 100 000 population. ATG, Antigua and Barbuda; FSM, Federated States of Micronesia; Isl, island; LCA, Saint Lucia; PM2.5, fine particulate matter <2.5 µm; TLS, Timor-Leste; TTO, Trinidad and Tobago; VCT, Saint Vincent and the Grenadines.
Years living with disability
Estimates for YLD in absolute terms, rates per 100 000 population and age-standardised YLL rates are provided in table 2 for the 10 most populated countries and in online supplementary table 2 for 194 countries and territories. Among the 10 most populated countries, Nigeria had the highest age-standardised YLD rate per 100 000 population (YLD=71.93, UI=45.61–103.27), followed by Bangladesh (45.58, 28.89–64.56) and then India (45.40, 29.19–64.54). Among all countries, Iraq, Afghanistan, Guinea-Bissau, Senegal, Chad, Turkey, Mali, Niger and Yemen had the highest age-standardised YLD rate per 100 000 population (online supplementary table 2 , figure 2).
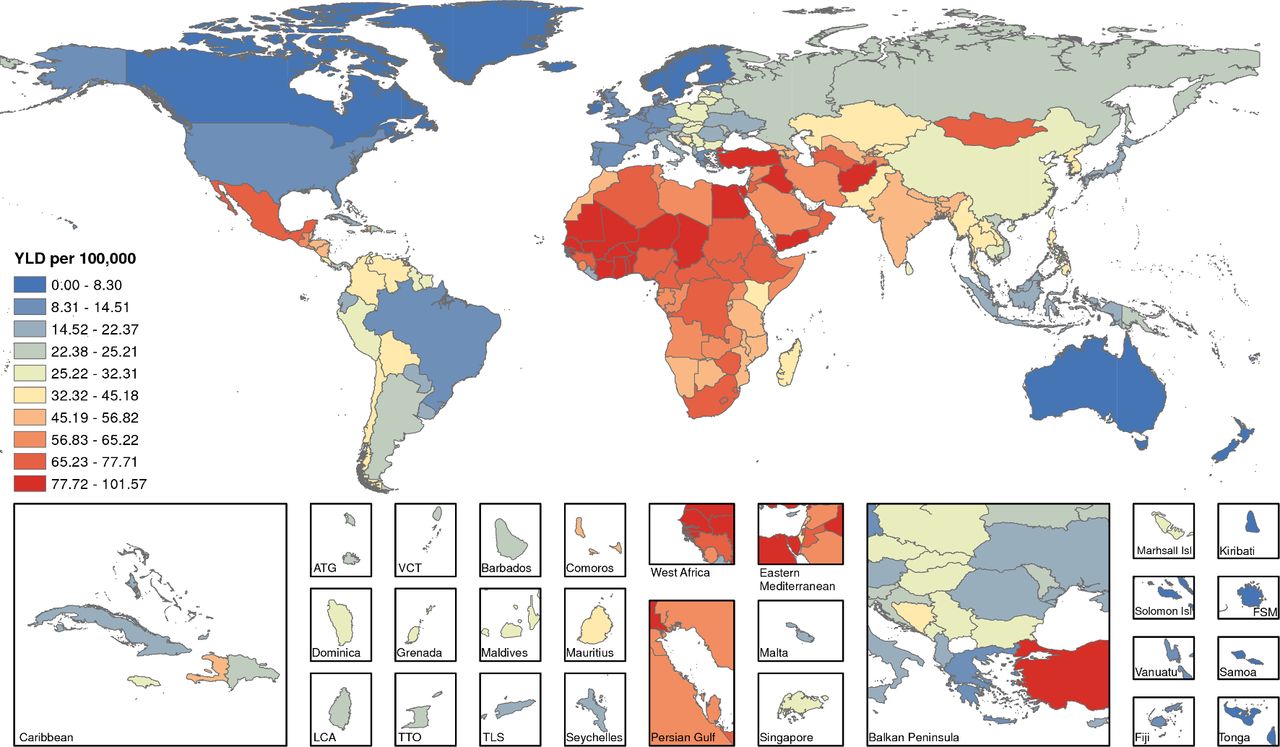
Age-standardised years living with disability (YLD) due to incident chronic kidney disease attributable to PM2.5 per 100 000 population. ATG, Antigua and Barbuda; FSM, Federated States of Micronesia; Isl, island; LCA, Saint Lucia; PM2.5, fine particulate matter <2.5 µm; TLS, Timor-Leste; TTO, Trinidad and Tobago; VCT, Saint Vincent and the Grenadines.
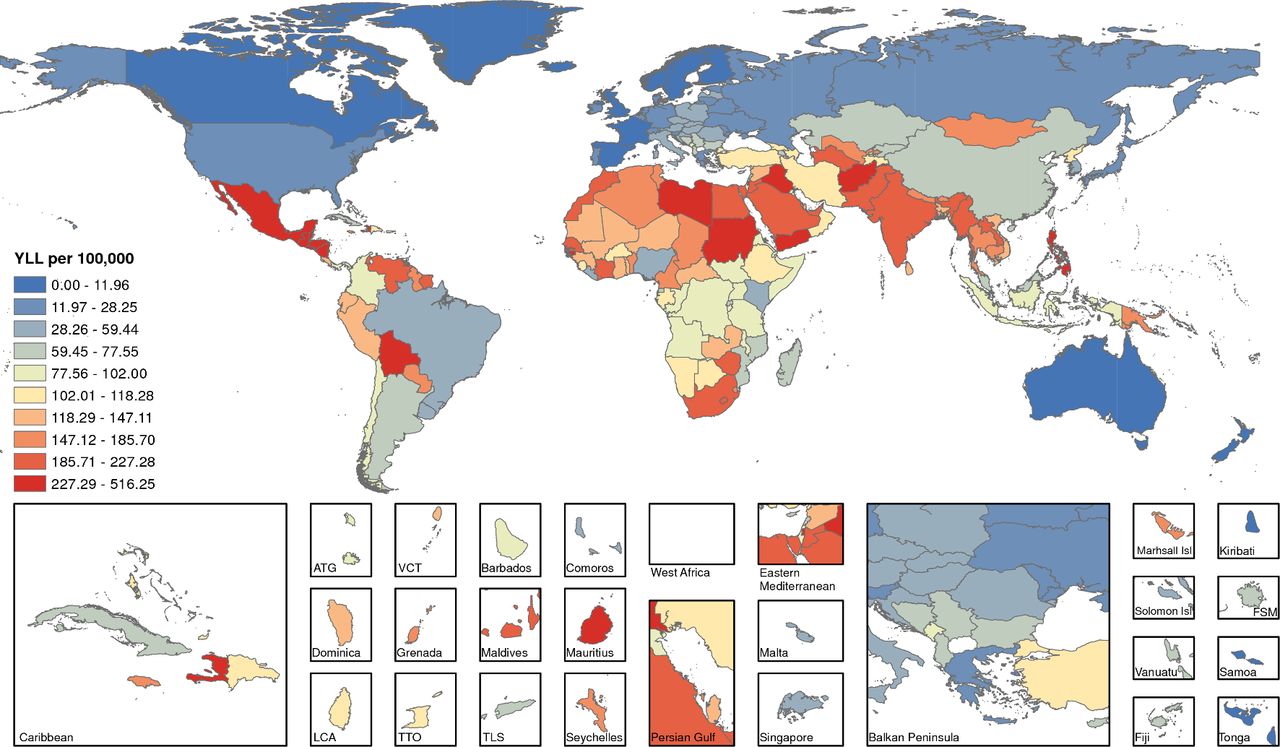
Years of life lost
Estimates for YLL in absolute numbers, rates per 100 000 population and age-standardised rates per 100 000 population for 10 most populated countries and for 194 countries and territories are provided in table 2 and online supplementary table 2, respectively. Among the 10 most populated countries, Pakistan had the highest age-standardised YLL per 100 000 population (YLL=215.59, UI=123.95–322.52), followed by India (192.55, 138.73–249.04) and then Bangladesh (137.57, 98.14–179.69). Among all countries and territories, Afghanistan, El Salvador, Nicaragua, Mexico, Honduras, Philippines, Guatemala, Iraq, Palestine and Belize had the highest age-standardised YLL per 100 000 population (online supplementary table 2 , figure 3).

Age-standardised years of life lost (YLL) due to incident chronic kidney disease attributable to PM2.5 per 100 000 population. ATG, Antigua and Barbuda; FSM, Federated States of Micronesia; Isl, island; LCA, Saint Lucia; PM2.5, fine particulate matter <2.5 µm; TLS, Timor-Leste; TTO, Trinidad and Tobago; VCT, Saint Vincent and the Grenadines.
Disability-adjusted life-years
Among the 10 most populated countries, India had the highest DALY (DALY=2502.15, UI=1827.96–3204.77 in 1000s), followed by China (1651.72, 1212.35–2103.21) and then Pakistan (342.45, 213.87–492.17) (table 2). DALY rates per 100 000 population showed that India remained on top with DALY rate of 190.77 (UI=139.37–244.33), followed by Pakistan with DALY rate of 181.14 (UI=113.12–260.33), then Bangladesh with DALY rate of 136.84 (UI=99.13–176.20) (table 2). Age-standardised DALY rates showed Pakistan leading, followed by India, then Bangladesh with age adjusted DALY rates of 254.25 (UI=157.33–365.23), 238.25 (UI=173.90–303.98) and 183.21 (132.76–236.87), respectively.
Among all countries and territories, those with the highest age-standardised DALY rates included Afghanistan, El Salvador, Nicaragua, Mexico, Honduras, Iraq, Guatemala, Philippines, Palestine and Belize (online supplementary table 2). Mapping the geographic distribution of age-standardised DALY rates across the globe showed populations in Mesoamerica, Northern Africa, South Africa, several countries in the Eastern Mediterranean Region, Afghanistan, Pakistan, India and several countries in Southeast Asia were among those with highest age-standardised DALY rates (figure 4). For example, age-standardised DALYs per 100 000 were 543.35 (391.16–707.96) in El Salvador, 455.29 (332.51–577.97) in Mexico, 408.41 (283.82–551.84) in Guatemala, 295.39 (203.17–401.39) in Jordan, 273.55 (184.84–379.35) in Egypt, 264.23 (181.58–360.76) in Morocco, 259.46 (189.72–330.98) in South Africa, 205.12 (148.73–264.89) in Thailand, 183.21 (132.76–236.87) in Bangladesh and 178.26 (125.31–238.47) in Sri Lanka. The map identified Canada, several northern European and Scandinavian countries, New Zealand and Australia as having lowest estimates of age-standardised DALY rates. For example, age-standardised DALY rates were 5.52 (0.82–11.48) in Sweden, 6.46 (0.00–14.49) in Australia, and 12.13 (4.95–21.82) in Canada (figure 4).

Age-standardised disability-adjust life-years (DALYs) due to incident chronic kidney disease attributable to PM2.5 per 100 000 population. ATG, Antigua and Barbuda; FSM, Federated States of Micronesia; Isl, island; LCA, Saint Lucia; PM2.5, fine particulate matter <2.5 µm; TLS, Timor-Leste; TTO, Trinidad and Tobago; VCT, Saint Vincent and the Grenadines.
Frontier analysis
We developed a frontier analysis to identify countries and territories that exhibited the least burden of kidney disease attributable to particulate matter air pollution given their SDI. The analysis provides a comparative quantitative assessment of the potential reduction in CKD burden that might be achievable in each country given their social and economic development. Most importantly, for each SDI, this analysis identifies exemplar countries at the frontier (with lowest DALYs for their SDI) and countries with the highest DALYs for their SDI. The effective difference between the frontier and the highest DALYs given an SDI represents a hypothetical magnitude of potential improvement in impact of air pollution on burden of CKD in a given country. Frontier analysis of age-adjusted DALYs are presented in figure 5. Online supplementary table 3 provides the effective difference from the frontier for each country given that country SDI; countries with the largest effective difference were El Salvador, Afghanistan, Mexico, Nicaragua, Honduras, Philippines, Iraq, Guatemala and Palestine. Among countries with an SDI <0.3, Somalia, Niger, Liberia, the Democratic Republic of Congo, Mozambique and Burundi had age-standardised DALY rates that are close to the frontier with an effective difference of less than 10. Afghanistan, Guinea-Bissau and Chad also had an SDI <0.3; however, they exhibited relatively high age-standardised DALY rates and effective difference from the frontier that exceeded 100 representing a large gap in performance vis-à-vis other countries with comparable resources. Among reasonably well-resourced countries with an SDI >0.7, Mexico, Mauritius, The United Arab Emirates, Saudi Arabia, Turkmenistan, Venezuela, South Africa, Bahrain and Mongolia had an effective difference from the frontier of more than 200 representing potential unrealised opportunities for progress in those countries given their resources.

Frontier analysis of age-standardised disability-adjusted life-years (DALYs) rate per 100 000 population by Sociodemographic Index. Countries with the top 10% effective difference are labelled. Countries are coloured by region.
To further evaluate the frontier independent of potential contamination by other strong drivers of CKD such as diabetes—where it is a major driver in Mexico30—and hypertension, we rebuilt the entire frontier following a decomposition analysis of risk-deleted cause-specific DALYs where we risk-deleted DALYs caused by diabetes and hypertension. This analysis yielded consistent results (online supplementary figure 1); specifically, that several countries including Mesoamerica exhibited significant effective difference from the frontier suggesting a disproportionally higher PM2.5 attributable DALYs than would be expected by their SDI (online supplementary figure 1).
Supplementary file 2
Burden of CKD attributable to PM2.5 levels above the WHO limit of 10 µg/m3
All the primary analyses were developed considering risk attributable to exposure levels of PM2.5 above a uniform distribution between 2.4 µg/m3and 5.9 µg/m3 representing exposure values between the minimum and fifth percentiles of exposure distributions from outdoor air pollution studies.7 8
We repeated all the analyses where we considered risk attributable to exposure levels of PM2.5 above the WHO limit of 10 µg/m3 (using the alternate scenario where the theoretical minimal risk exposure level was set at 10 µg/m3).6 The estimates describe the burden of kidney disease—globally and at the national level—that is attributable to PM2.5 concentrations in excess of the WHO limit. The geographic distribution of burden was consistent with the primary results (online supplementary tables 4 and 5). The results from this analysis necessarily underestimate the true burden as they—by definition—ignore PM2.5-related risk below the WHO limit but might be informative to policy makers and relevant stakeholders in estimating the burden of CKD that could be avoided should targeting the WHO limit become a policy goal.
Discussion
In this work, we provide a quantitative analysis of the global burden of CKD attributable to air pollution in 194 countries and territories. The results describe the annual incidence of kidney disease attributable to air pollution globally and at the national level and provide a quantitative assessment of the YLD due to kidney disease, YLL due to early mortality from kidney disease and the combined comprehensive measure of DALYs (years of healthy life lost, due to dying prematurely and and to the YLD) of kidney disease attributable to air pollution. The global toll of CKD attributable to air pollution is significant with 6.9 million incident cases of CKD per year, 94 cases per 100 000 population per year and 11.4 million DALYs per year. The findings suggest substantial geographic variation and identify geographies where the toll of air pollution may be a significant driver of the epidemiology of kidney disease. Our analyses also suggest disproportionately higher PM2.5 DALYs from kidney disease in several countries including Mesoamerica than would be expected for their SDI.
According to the GBD study, global age-standardised DALY rates attributable to PM2.5 are 1521 per 100 000.31 Our estimates of PM2.5 CKD DALYs were 164, representing 10.7% of the total global DALYs—years of healthy life lost—attributable to air pollution.31 Our analyses suggest that the overall burden of kidney disease attributable to air pollution is shaped by the epidemiological transition.32 Among countries that are poor with a high burden of communicable diseases and reduced life expectancy (eg, several countries in the African continent), we observed a lower global ranking for YLL than YLD (figures 2 and 3), reflecting increased probability of early loss of life from other diseases not related to air pollution. The corollary observation is that countries that are relatively more developed including Mesoamerica, South America (including Venezuela, Gynae, Surinam and Bolivia), Pakistan, India and several countries in southeast Asia ranked in the highest decile for YLL but not in YLD, reflecting much earlier loss of life attributable to air pollution-related kidney disease (figures 2 and 3). The results suggest that as countries journey forward along the path of the epidemiological transition, the contribution of air pollution to non-communicable disease mortality in general, and more specifically CKD, becomes more pronounced. Unfortunately, CKD has been largely ignored in the global and WHO discussion of non-communicable diseases33–36; CKD and its environmental drivers should feature on the national, international development, and global health agendas36–38 and should be assigned a priority commensurate with its ascending rank among the global burden of diseases.2 10 13–16 39–44
Our results show substantial geographic variation in the global burden of CKD attributable to air pollution (figure 4), where low-income and lower middle-income countries are most affected (figures 6 and 7). Air pollution is a significant global problem with well documented transboundary health impacts due to international trade and atmospheric pollutant transport45; it results in an estimated 4.2 million deaths per year and is worsening especially in low-income and middle-income countries.15 31 37 46 This is consistent with findings from the State of Global Air 2017 report where the largest increases in air pollution-related death were in rapidly industrialising low-income and middle-income countries.31 37 The global burden of CKD is increasing and its rank as a contributor to disability and death is ascending43; it disproportionately impacts low-income and middle-income countries,1 36 43 47 which are least equipped to provide costly but life-saving CKD care.33 34 While diabetes mellitus and hypertension are the leading causes of CKD in high and upper middle-income countries, a significant proportion of CKD cannot be explained by these traditional causes in low and lower middle-income countries where environmental exposures loom prominently as potential drivers of non-communicable diseases including CKD.36 37 48–50 In an elegant recent editorial, Jha and Modi51 reflected on the rise of kidney failure death in India and suggested that a sizeable portion of kidney failure is not due to traditional drivers (diabetes mellitus) and advocated for a research agenda to identify the drivers of this increased incidence of kidney failure and kidney failure death. Others have also advocated for greater understanding and larger emphasis of the role of environmental air pollution in non-communicable diseases and specifically kidney disease.37 49 The rise of CKD of unknown origin in Mesoamerica and other geographies including India and Sri Lanka illustrates the need for a broader and more comprehensive evaluation of potential risk factors for development and progression of kidney disease.36 52

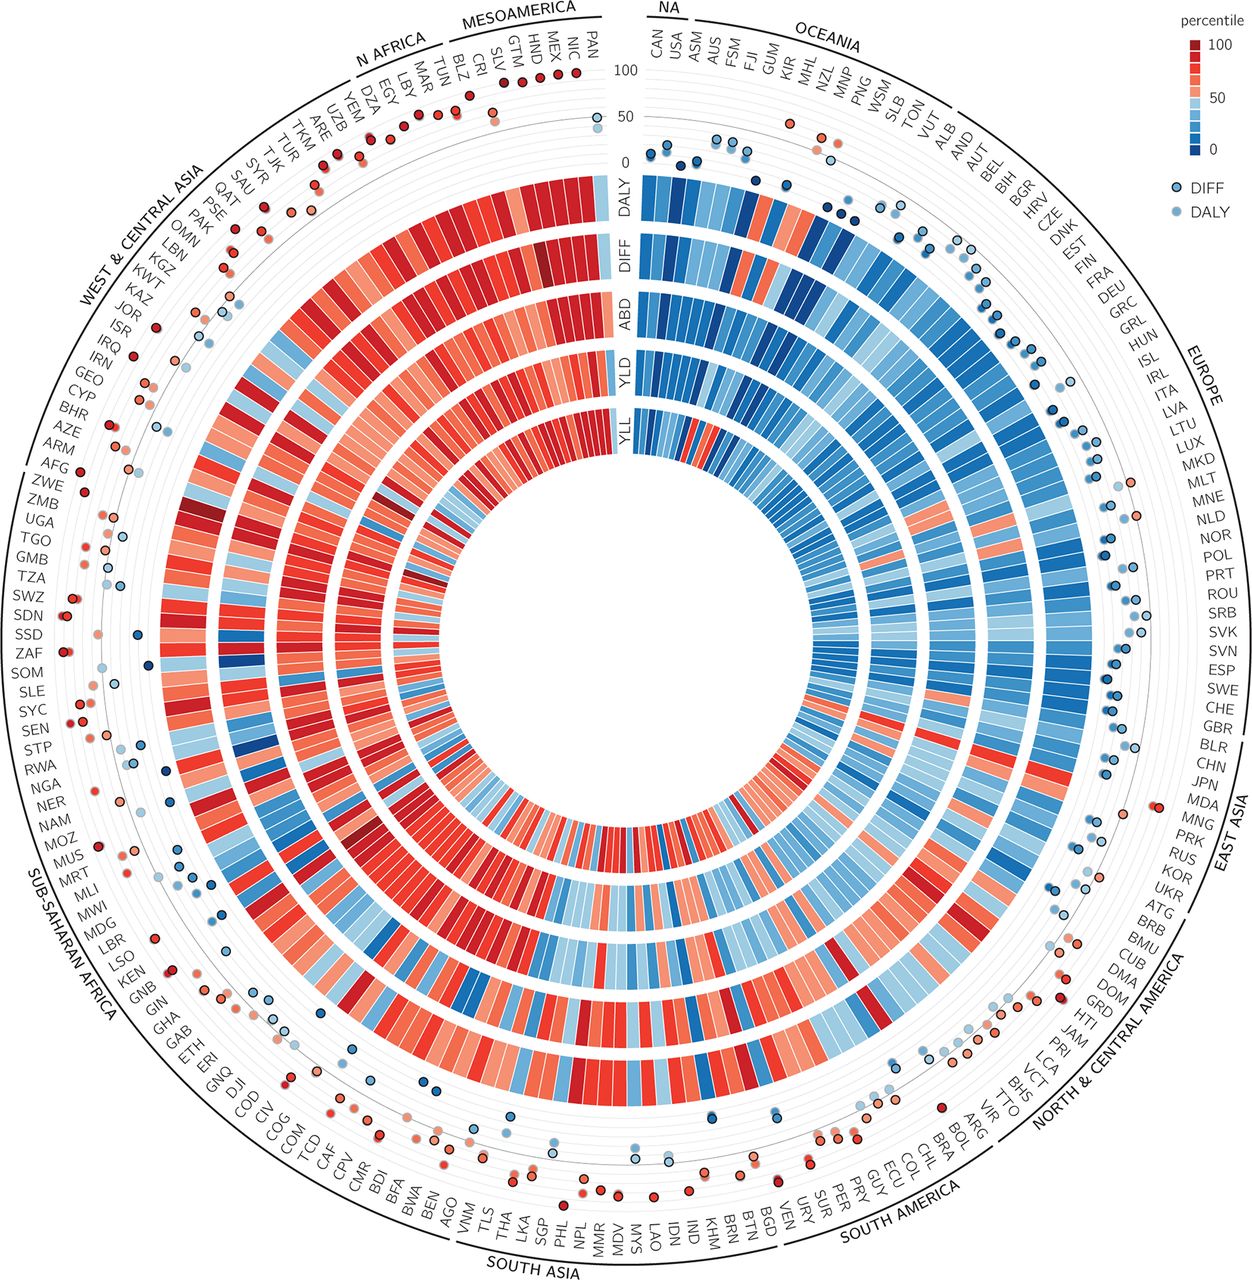
Plot showing burden of CKD attributable to PM2.5 in 194 countries and territories. Heat map tracks show percentiles, which from inside to outside represent the YLL, YLD, ABD, effective difference and DALY. Scatter plot represents the DALYs (in open circles) and effective difference (in closed circles) percentile, with a reference line at the median. Values are graded, from low to high, as blue to red (on the Brewer palette). Countries are represented by their three-character country code. Regions are ordered from low to high burden clockwise. ABD, attributable burden of disease; DALY, disability-adjusted life-years; DIFF, effective difference; CKD, chronic kidney disease; NA, North America; PM2.5, fine particulate matter <2.5 µm; YLD, years living with disability; YLL, years of life lost.

![[bmjopen-2018-022450supp002.jpg]](https://bmjopen.bmj.com/content/bmjopen/9/5/e022450/DC2/embed/inline-supplementary-material-2.jpg?download=true)
Age-standardised CKD DALYs (per 100 000) attributable to PM2.5 by World Bank income classification. CKD, chronic kidney disease; DALY, disability-adjusted life-years; PM2.5, fine particulate matter <2.5 µm.
Our frontier analysis provides a blueprint to comparatively evaluate the CKD DALYs attributable to air pollution in countries with similar resources. The analysis identifies a cluster of countries with substantially higher CKD DALYs than would be expected for their place on the development spectrum. The clustering of countries including Mesoamerican countries with a high CKD DALYs gap attributable to air pollution is likely not random and (A) supports the prescient hypothesis put forth by Orantes-Navarro et al 52 for inclusion of environmental air pollution—among others—as a potential risk factor for CKD of unknown cause—a so far elusive disease entity, vibrantly discussed among luminaries in the field36 42 53–62— and (B) potentially represents unrealised opportunity for improved performance through interventions in the form of laws, health and economic policy measures, reprioritisation and alignment of resources, technological transition and other devices that would ultimately close the DALYs gap. Similarly, our analysis identifies exemplar countries where performance for the county’s level of development is considered leading (at the frontier pushing the envelope), the identification of these exemplars provides a window for better understanding of the potential drivers for success34 and determination whether advocacy and wider adoption of these drivers by other countries might yield decreased CKD burden.38
While our analyses described the global and national burden of kidney disease attributable to PM2.5 air pollution, consideration of the impact of other air pollutants (ie, nitrogen oxides, ozone, carbon monoxide, PM10 and others),48 a higher spatial resolution analysis at the subnational level and a greater understanding of temporal trends over the years (eg, an annual global CKD burden report that would track the contributions of all risk factors over time) are certainly needed to develop a better understanding of the epidemiology of CKD driven by air pollution. Future work should revisit this question to provide updated estimates of the burden of CKD attributable to ambient air pollution when updated and more accurate estimates for PM2.5 and CKD are available across the PM2.5 exposure spectrum for incorporation in integrative meta-regression methods.23 63 64
Three hypotheses have been proposed to explain the mechanisms by which PM2.5 may play a role in the development of CKD: (A) Inhaled particular matter may result in pulmonary inflammation, which could then lead to systematic inflammation, (B) pollutants may also induce disturbances in respiratory autonomic nervous system and subsequently provoke systemic disturbances resulting in kidney damage and (C) evidence has also suggested that inhaled fine particulate matter when sufficiently small may enter the bloodstream and subsequently interact with kidney tissue.65 66 Furthermore, the association between PM2.5 and CKD has been supported by other work. In a recent study of the US Medicare population by Bragg-Gresham et al, a 4 µg/m3 increase in levels of PM2.5 was associated with higher prevalence of diagnosed CKD (prevalence ratio=1.03; 95% CI 1.02 to 1.05).67 In a study of 100 629 adult non-CKD Taiwanese residents by Chan et al, a 10 µg/m3 increase in PM2.5 was associated with an increased risk of incident CKD (HR: 1.06; 95% CI 1.02 to 1.10).68
This study has several limitations. Our analyses do not account for the composition and toxic content of PM2.5; however, studies have shown that estimates using non-specific PM2.5 biomass alone will underestimate the burden of kidney disease attributable to air pollution.7 8 46 Furthermore, we considered that risk plateaued for PM2.5 concentrations above 22 µg/m3; this likely yielded conservative estimate of the true burden of CKD attributable to air pollution. Our estimates of CKD attributable to PM2.5 at the global and national levels reflect the influence of PM2.5 levels across the globe and of demography and underlying CKD rates. Our analyses were performed at the global and national level where we assigned PM2.5 exposure and generated incident rates of CKD for every country and territory; thus, our analyses do not provide further insight into the subnational level. We relied on estimates for incident CKD generated by the GBD study group, and while those Bayesian estimates are considered reliable and robust, they are necessarily limited by the quality of the available data.69 Furthermore, variability and inconsistency of data collection methods and tools across the countries could influence geographic variations.69 Inaccuracies in prediction of population exposure levels may have introduced bias.70 We did not have data on indoor air pollutants, which may have resulted in misclassification of exposure or confounding of observed associations. Collinearity with other pollutants, geographic heterogeneity in effect, seasonal variation and lagged effect of exposure may have biased the association.71 72 To generate the estimates provided in this report, we relied on risk estimates generated in prior work6 and while the analytic strategies were robust including the application of negative controls, the possibility of residual confounding cannot be eliminated. Causal interpretations should be made with caution. Small differences in estimated risk could have profound impacts on estimated burden. In the GBD, CKD of unknown origin is not currently part of the casual framework; available evidence on how PM2.5 is associated with CKD of different aetiologies is limited and, if different, could have biased results.
Key strengths include leveraging the availability of the 2016 GBD data, which is the most comprehensive compilation and analysis of global health information available; we also employed GBD methodologies including the concept of DALY to capture the burden of disease across the globe and a measure of uncertainty (to reflect how much we know and how much we do not know). We also developed a frontier analysis to enable comparative evaluation among countries with similar SDI, and finally, we repeated all analyses using an alternative scenario where we considered the WHO air quality standards as counterfactual.
In sum, our results show that the global toll of CKD attributable to air pollution is significant. The burden varies substantially by geography. Air pollution might be a contributing risk factor and might partially explain the rise in the incidence of CKD of unknown cause in some geographies around the world. As countries further develop and industrialise and travel along the path of the epidemiological transition, the rise in air pollution related non-communicable disease and specifically kidney disease should be reflected on the global health agendas.
Acknowledgments
In this report, we used the publicly available Global Burden of Disease (GBD) studies data and methodologies. The Global Burden of Disease Collaborator Network is composed of more than 2700 collaborators worldwide and is headquartered at the Institute for Health Metrics and Evaluation (IHME) in Seattle, Washington. The estimates used in generating this manuscript relied on the GBD data and methodologies. We acknowledge the visionary global health leadership of IHME, and the contribution of all collaborators without whom this report would not be possible. We are enormously grateful to Martin Krzywinski for his instrumental help in generating the Circos plot in this manuscript.
References
Footnotes
Contributors Research area and study design: BB, YX and ZA-A; data acquisition: BB, YX and ZA-A; data analysis: BB, YX and ZA-A; interpretation of study results: all authors; statistical analysis: BB and YX; drafting the manuscript: BB and ZA-A; revision and comment on manuscript YX, TL, YY and HX; supervision or mentorship: ZA-A. Each author contributed important intellectual content during manuscript drafting or revision and accepts accountability for the overall work by ensuring that questions pertaining to the accuracy or integrity of any portion of the work are appropriately investigated and resolved. ZA-A takes responsibility that this study has been reported honestly, accurately and transparently and that no important aspects of the study have been omitted.
Funding This research was funded by the US Department of Veterans Affairs. The funders of this study had no role in study design; collection, analysis, and interpretation of data; writing the report; and the decision to submit the report for publication.
Disclaimer The contents do not represent the views of the US Department of Veterans Affairs or the US Government.
The depiction of boundaries on the map(s) in this article do not imply the expression of any opinion whatsoever on the part of BMJ (or any member of its group) concerning the legal status of any country, territory, jurisdiction or area or of its authorities. The map(s) are provided without any warranty of any kind, either express or implied.
Competing interests None declared.
Ethics approval This research project was reviewed and approved by the Institutional Review Board of the VA Saint Louis Health Care System.
Provenance and peer review Not commissioned; externally peer reviewed.
Data sharing statement Data are available through the Global Burden of Disease Results Portal.
Patient consent for publication Not required.