Article Text

Abstract
Objectives To empirically assess the relation between study characteristics and prognostic model performance in external validation studies of multivariable prognostic models.
Design Meta-epidemiological study.
Data sources and study selection On 16 October 2018, we searched electronic databases for systematic reviews of prognostic models. Reviews from non-overlapping clinical fields were selected if they reported common performance measures (either the concordance (c)-statistic or the ratio of observed over expected number of events (OE ratio)) from 10 or more validations of the same prognostic model.
Data extraction and analyses Study design features, population characteristics, methods of predictor and outcome assessment, and the aforementioned performance measures were extracted from the included external validation studies. Random effects meta-regression was used to quantify the association between the study characteristics and model performance.
Results We included 10 systematic reviews, describing a total of 224 external validations, of which 221 reported c-statistics and 124 OE ratios. Associations between study characteristics and model performance were heterogeneous across systematic reviews. C-statistics were most associated with variation in population characteristics, outcome definitions and measurement and predictor substitution. For example, validations with eligibility criteria comparable to the development study were associated with higher c-statistics compared with narrower criteria (difference in logit c-statistic 0.21(95% CI 0.07 to 0.35), similar to an increase from 0.70 to 0.74). Using a case-control design was associated with higher OE ratios, compared with using data from a cohort (difference in log OE ratio 0.97(95% CI 0.38 to 1.55), similar to an increase in OE ratio from 1.00 to 2.63).
Conclusions Variation in performance of prognostic models across studies is mainly associated with variation in case-mix, study designs, outcome definitions and measurement methods and predictor substitution. Researchers developing and validating prognostic models should realise the potential influence of these study characteristics on the predictive performance of prognostic models.
- meta-epidemiology
- prognosis
- prognostic models
- bias
- prediction
This is an open access article distributed in accordance with the Creative Commons Attribution Non Commercial (CC BY-NC 4.0) license, which permits others to distribute, remix, adapt, build upon this work non-commercially, and license their derivative works on different terms, provided the original work is properly cited, appropriate credit is given, any changes made indicated, and the use is non-commercial. See: http://creativecommons.org/licenses/by-nc/4.0/.
Statistics from Altmetric.com
Strengths and limitations of this study
To the best of our knowledge, this is the first meta-epidemiological study focusing on the association of study characteristics with estimates of prognostic model performance.
We included all 10 systematic reviews describing at least 10 external validations of the same prognostic model, resulting in 224 external validations.
We extracted relevant features of design and conduct according to existing checklists on quality assessment (Critical Appraisal and Data Extraction for Systematic Reviews of Prediction Modelling Studies checklist) and reporting of prediction model studies (Transparent Reporting of a Multivariable Prediction Model for Individual Prognosis or Diagnosis).
It was not feasible to fit multivariable meta-regression models due to the limited number of available, well-reported, validation studies within the individual reviews, rendering the effective sample size too small for multivariable meta-regression analyses.
Introduction
Prediction models, including diagnostic and prognostic models, estimate the probability that an individual has or will develop a certain outcome (eg, disease or complication). Hereto, they combine multiple predictors into an estimate of an individual’s risk.1 Before using a prediction model in clinical practice, it is recommended to validate the performance of the model in a population other than the population in which the model was developed (so called external validation studies).2 Such studies assess whether model predictions remain sufficiently accurate across different settings and populations. Obviously, it is important that the methodological quality of external validation studies is good, as otherwise estimates of the prediction model’s performance may be biased and thereby lead to misleading conclusions on its generalisability to practice.
Systematic reviews have found that the performance of existing prediction models often varies substantially across external validation studies of those models.3–5 These differences may appear due to random variation (when validation studies are small) and may arise when model predictions are invalid because the model is applied in very different populations (eg, the association between predictors in the model and the outcome are different) or when design-related characteristics of the validation study (eg, measurement methods or variable definitions) are not well aligned with the original development study.2 6
To provide empirical evidence of the association of study characteristics with prediction model performance, a meta-epidemiological approach can be used. Studies using this approach have shown the influence of study characteristics on the effectiveness of interventions studied in randomised trials and on the accuracy of diagnostic tests.7–12 For diagnostic prediction models, evidence suggests estimates of performance may be biased in studies with certain study characteristics. One study found a higher diagnostic odds ratio in case-control studies, studies with differential outcome verification (ie, using different outcome assessments across study individuals), and with low sample size.13 To date, no meta-epidemiological study has been performed investigating the possible impact of study characteristics on measures of the predictive performance of a prognostic model on external validation, which is commonly quantified in terms of discrimination and calibration.14 The aim of this study was to investigate sources of heterogeneity in the predictive performance of prognostic models. A meta-epidemiological approach was used to synthesise evidence from a range of clinical fields. This study can serve as empirical evidence for design-related and analysis-related bias in prognostic model studies.
Methods
Search and selection of systematic reviews
We used an existing database (last updated on 16 October 2018) consisting of studies evaluating multiple existing prediction models, including narrative or systematic reviews of prediction models, or head-to-head comparisons of multiple prediction models validated on a specific dataset (see online supplementary 1 for details of the search strategy and selection criteria). To construct this database, references identified by the search were screened for eligibility by one reviewer (GSC) on title, abstract and, if necessary, on full text. Subsequently, the full text of all articles in the database were screened for eligibility to the current project by another reviewer (JAAGD). We selected systematic reviews of prognostic models (ie, diagnostic models were excluded) that included at least 10 studies that externally validated the same prognostic model (this number was chosen a priori to facilitate the estimation of study-level parameters such as between-study heterogeneity), and that presented the performance of these models in terms of discrimination (concordance (c)-statistic or area under the receiver operating characteristic curve), or calibration (observed expected (OE) ratio). Discrimination is the ability of the model to distinguish between people who will and who will not develop the outcome of interest, while calibration reflects the overall agreement between the total number of observed and predicted (‘expected’) events.14 We excluded systematic reviews that selected studies based on specific study characteristics (eg, we excluded systematic reviews that did not include primary studies with a sample size below 100, if we were not able to identify the primary studies that had been excluded for this reason). Furthermore, we excluded reviews of prognostic models in which the weights of predictors in the original model were based on expert opinion rather than on coefficients estimated from a formal statistical approach. If more than one systematic review on the same prognostic model was identified, we included the one with the broadest inclusion criteria (eg, reviews focussing on specific patient populations were not preferred if a review with a broader population was available) or the most recent review (in this order of preference). When multiple prognostic models for the same condition were described in one systematic review which all fulfilled the selection criteria, we included the model with the highest number of external validations.
Supplemental material
Selection of the primary external validation studies from the included systematic reviews
From the included systematic reviews, we collected the primary studies in which the prognostic models were developed and externally validated. For primary external validation studies for which no measure of discrimination (c-statistic) or calibration (total OE ratio) was reported in the systematic review, we checked the full text of the primary study, and if performance was not reported, these studies were excluded.
If primary external validation studies described multiple external validations of the same model and if there was no overlap in included participants between these external validations (eg, a model was validated in two different cohorts, or a model was validated in men and women separately), data were extracted for every external validation separately. If a model was validated multiple times on the same population (described in either one or multiple publications), we selected the external validation that was included in the systematic review. If the systematic review included all those external validations, we selected the one in which the study population and predicted outcome most closely resembled the population and outcome of the original model.
Data extraction and preparation
We extracted relevant features of design and conduct according to existing checklists on quality assessment (Critical Appraisal and Data Extraction for Systematic Reviews of Prediction Modelling Studies [CHARMS]) and reporting of prediction model studies (Transparent Reporting of a Multivariable Prediction Model for Individual Prognosis or Diagnosis [TRIPOD]).15–17 Information about study characteristics of studies in which the models were developed were extracted from the corresponding development papers. Information about study characteristics of primary external validation studies were first extracted from systematic reviews. This information was subsequently checked using the external validation studies and, if necessary, additional information was extracted by one reviewer (JAAGD or RP). Items we extracted included study type (eg, external validation only, development of a new model and external validation of a model), study design (eg, existing cohort, existing RCT), dependency of investigators (validation by independent investigators or investigators also involved in the development study), eligibility criteria for participant inclusion, setting, location (continent), study dates, number of centres, follow-up time and prediction horizon, age and gender distribution, deletion or substitution of predictors, outcome definition and measurement method, sample size and number of events, handling of missing data and model performance (see online supplementary 2 for details). The data extraction form was piloted on multiple articles by all reviewers (JAAGD, TPAD, LH, KGMM, RP, JBR, RJPMS).
For analysis purposes, some study characteristics had to be categorised or transformed (see online supplementary 2). For example, eligibility criteria of the validation study as compared with the development study had to be judged and categorised as comparable, narrower (if subgroups included in the development study were excluded from the validation study), broader (if subgroups excluded from the development study were included in the validation study), mixture (a combination of the two) or unclear. For setting, location, predictors and outcome, a similar categorisation was used. If data on study characteristics were not reported in the primary external validation studies, these were either categorised as ‘unclear’ (in case of categorical study variables), or the study was excluded from the analyses of that (missing) study characteristic (in case of continuous study variables, such as sample size). In order to improve comparability between reviews, we standardised continuous study variables separately for each systematic review, that is for every variable, we subtracted the mean and divided by the SD of all external validations identified from the same systematic review.
Statistical analyses
We used a two-staged approach to study the possible association between study characteristics and predictive performance.
In the first stage, we fitted a univariable meta-regression model for every study characteristic within each systematic review with the logit c-statistic or log OE ratio as outcome variable.18 The regression coefficients estimated from this meta-regression model indicate the difference in logit c-statistic or log OE ratio between a certain category of a study characteristic and a chosen reference category (ie, the category that was present in most systematic reviews) of that characteristic.
In the second stage, these regression coefficients were pooled by the use of a random effects model. This reflected the average influence of the study characteristic on model performance across all systematic reviews. For continuous characteristics, the regression coefficients obtained in the first stage were jointly pooled across reviews, using bivariate meta-analysis.19 20 For categorical characteristics, the results of univariable meta-analyses are presented. We planned to perform multivariable analyses to assess the association between various study characteristics in combination and the performance of prognostic models, but due to the paucity of data, we were not able to do so. All analyses are described in more detail in online supplementary 3.
Patient and public involvement
Patients and public were not involved in the design, recruitment or conduct of the study.
Results
Identification and selection of studies
The search identified 2392 studies, of which 555 were included in the database and screened on full text, and 79 were further assessed (figure 1). Finally, 10 systematic reviews were included.21–30 These reviews addressed external validations of the following prognostic models: ABCD2,31 Essen Stroke Risk Score (ESRS),32 EuroSCORE,33 Framingham,34 FRAX,35 Injury Severity Score (ISS),36 model for end-stage liver disease (MELD),37 Pneumonia Severity Index (PSI),38 Revised Cardiac Risk Index (RCRI)39 and Simplified Acute Physiology Score (SAPS) 340 (table 1). The reviews included 248 primary external validation studies with 274 external model validations (one study could describe multiple model validations). During data extraction, 73 of 274 validations were eventually excluded (most often for not reporting a performance measure), and 20 additional external model validations were identified (figure 1). This resulted in the inclusion of 224 external validations, of which 221 could be included in the analyses of the c-statistic, and 124 in the analyses of the total OE ratio. For the total OE ratio, only validations of the EuroSCORE, Framingham, FRAX, PSI, RCRI and SAPS 3 prognostic models were included, due to the very low number of reported OE ratios in the validations studies for the other four prognostic models.

Flow chart of study selection. c, concordance; MA, meta-analysis; NR, not reported; OE, observed expected; SR, systematic review.
Description of included reviews and prediction models
Description of included validations
The number of external validations per systematic review ranged from 11 to 30 (table 1), and the median (IQR) sample size and number of events were 1069 (418–3043) and 92 (36–248), respectively. Most studies used an existing registry (n=104, 46%) or existing cohort (n=74, 33%) to validate the prognostic model. The median (IQR) c-statistic and total OE ratio were 0.73 (0.64–0.82) and 0.92 (0.64–1.26), respectively. Predictive performance of the models was highly heterogeneous, even for external validations of the same prognostic model, as indicated by the wide prediction intervals (table 1).
Not all information on the study characteristics was reported for all external validations (see online supplementary table 1). Information was often unclear (eg, for outcome definitions [n=83, 37%]) and handling of missing data [n=105, 47%]) or missing (eg, case-mix information such as mean age [n=28, 13%] and gender distribution [n=16, 7%]).
Discrimination
Pooled models
The pooled analyses across all systematic reviews (figure 2, see online supplementary figures 1 and 2) showed that validation in a continent different from the development study was associated with a higher c-statistic, compared with validation in the same continent, and multicentre versus single centre validation studies were associated with a lower c-statistic. Comparable eligibility criteria for participant inclusion were also associated with higher c-statistics compared with narrower criteria, whereas a broader setting was associated with a lower c-statistic compared with a setting comparable to the development study. Although not statistically significant, validations with changes made to the predictors (ie, substitution or deletion of a predictor), or in which it was unclear whether all predictors were correctly measured, tended to have lower c-statistics compared with validations where no changes were made. In various reviews, we found an association between the c-statistic and numerous other study characteristics, such as the study design, comparability of outcome definition, prediction horizon, sample size and number of events and mean age of study participants (figure 3, see online supplementary figures 2 and 3), only these were often not statistically significant when pooled together.
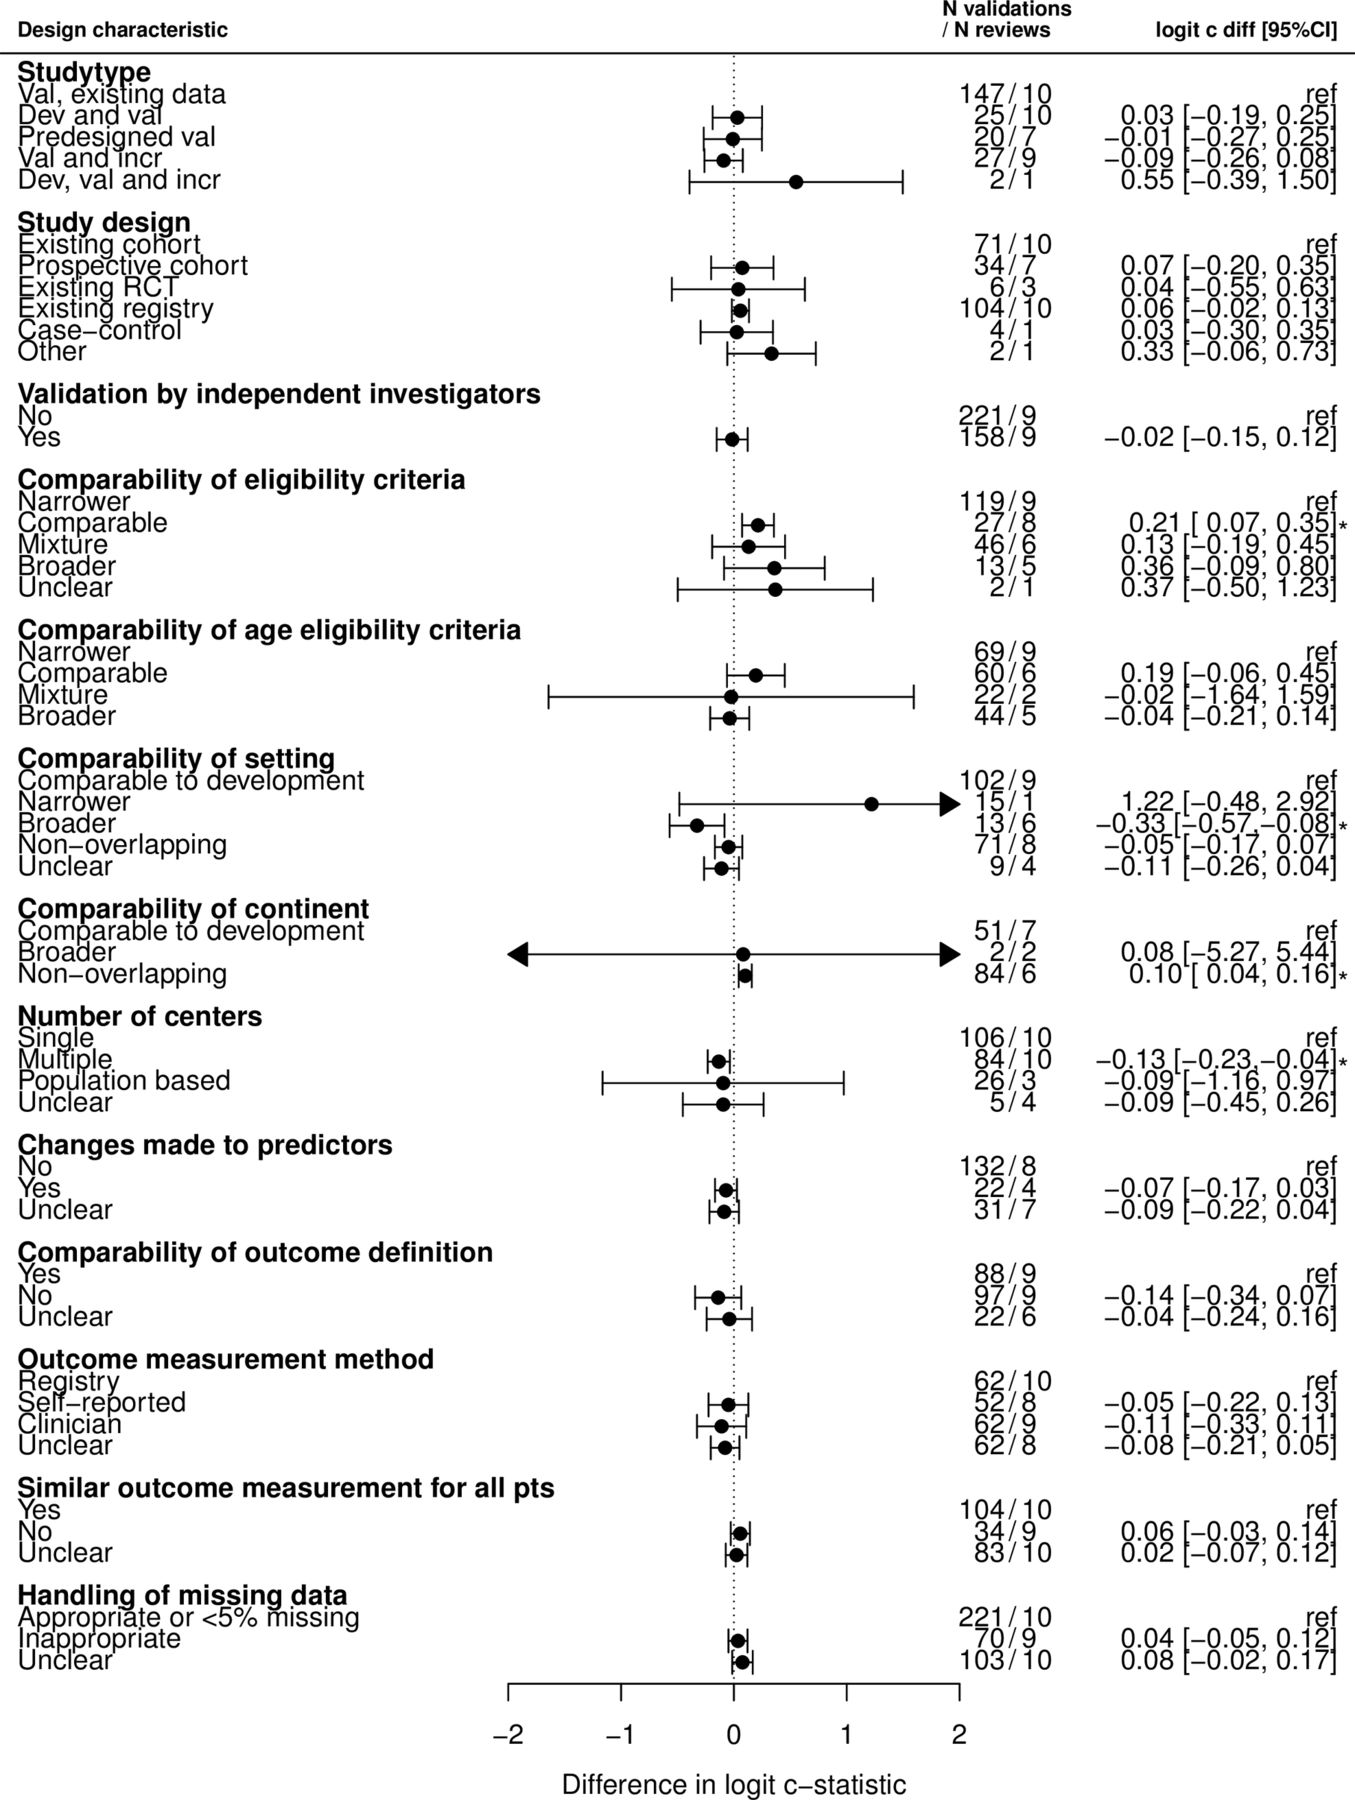
Associations between study characteristics and logit c-statistic with regard to a reference category across 221 external validation studies and 10 different prediction models. CIs not including 0 are marked with an *. Online supplementary figure 1 shows these differences on the original scale if we assume a c-statistic of 0.70 in the reference category. For example, for comparability of eligibility criteria, if we assume a c-statistic of 0.70 in the reference category (narrower), this would result in c-statistics of 0.74 (0.72 to 0.77), 0.73 (0.66 to 0.79), 0.77 (0.68 to 0.84) and 0.77 (0.59 to 0.89) in the categories comparable, mixture, broader and unclear, respectively. c, concordance; CI, confidence interval; dev, development; diff, difference; incr, incremental value; RCT, randomised controlled trial; ref, reference category; val, validation.

C-statistic for categories of study design, pooled using univariable meta-regression analyses within each systematic review. N represents the number of external validation studies in a specific category. C diff represents the difference in c-statistic with regard to a reference category (indicated with ‘ref’). ESRS, Essen Stroke Risk Score; ISS, Injury Severity Score; MELD, model for end-stage liver disease; PSI, Pneumonia Severity Index; RCRI, Revised Cardiac Risk Index; RCT, randomised controlled trial; SAPS, Simplified Acute Physiology Score 3.
Variation across reviews
Across reviews, we found associations of many study characteristics with the c-statistic although this was rather heterogeneous, and confidence intervals often overlapped (figure 3 and see online supplementary figure 3). For example, for study design, in six systematic reviews, a higher c-statistic was found for validations that used an existing registry compared with an existing cohort, while in three reviews, a lower c-statistic was found. In three systematic reviews. we found a higher c-statistic in validations by independent investigators, while in five, a lower c-statistic was found.
For other study characteristics, directions of associations were more consistent. For example, for most systematic reviews, validation studies with eligibility criteria narrower compared with the criteria used in the development study had a lower c-statistic while broader eligibility criteria were associated with higher c-statistics (see online supplementary figure 3). C-statistics were also (slightly) higher in external validations with a setting comparable to the development study. Validation in a continent other than the development study in general was associated with a higher c-statistic, and multicentre studies had lower c-statistics compared with single centre studies. External validations in which it was unclear if there were changes made to the predictors had lower c-statistics (see online supplementary figure 3).
Calibration
Pooled analyses
We found a significant association between study design and the total OE ratio (figure 4); using data from a case-control study (although known to be an inferior design for prognostic model research1 6) resulted in higher OE ratios, compared with using data from an existing cohort (though based on three external validations). Furthermore, higher OE ratios were found for studies in which the outcome was assessed by a panel of clinicians as compared with using a registry. In various reviews, we found an association between the total OE ratio and numerous other study characteristics, such as the duration of follow-up, year in which recruitment was started, sample size, SD of age and setting (figure 4, see online supplementary figures 5 and 6), only these were not statistically significant when pooled together.

Associations between study characteristics and ln OE ratio with regard to a reference category across 124 external validation studies and 6 different prediction models. CIs not including 0 are marked with an *. Online supplementary figure 4 shows these differences on the original scale if we assume an OE ratio of 1.00 in the reference category. For example, for comparability of eligibility criteria, if we assume an OE ratio of 1.00 in the reference category (narrower), this would result in OE ratios of 0.83 (0.66 to 1.05), 1.11 (0.72 to 1.70), and 0.92 (0.54 to 1.58) in the categories comparable, mixture, and broader, respectively. CI, confidence interval; dev, development; diff, difference; incr, incremental value; OE, observed expected; RCT, randomised controlled trial; ref, reference category; val, validation.
Variation across reviews
For other categories of study design (other than the use of a case-control design), heterogeneous associations were found across systematic reviews (figure 5). The associations of most other study characteristics with the OE ratio were also most often not consistent across systematic reviews (see online supplementary figures 5 and 6). For example, for two systematic reviews, external validations with appropriate handling of missing data had OE ratios closer to one compared with inappropriate handling of missing data, while in two reviews, OE ratios were further away from 1. Only for the continent in which the model was validated, directions were more consistent; OE ratios were closer to 1 if the continent was comparable to the development, compared with validations in different continents (see online supplementary figure 6).

Total OE ratio for categories of study design, pooled using univariable meta-regression analyses within each systematic review. N represents the number of external validation studies in a specific category. OE diff represents the difference in OE ratio with regard to a reference category (indicated with ‘ref’). OE, observed expected; PSI, Pneumonia Severity Index; RCRI, Revised Cardiac Risk Index; RCT, randomised controlled trial; SAPS, Simplified Acute Physiology Score.
Discussion
Principal findings
Using a comprehensive meta-analytical approach, we studied the association between study characteristics of prognostic model validation studies and the estimated model performance across 10 clinical domains. We focused on objective study characteristics that can be extracted from published reports. The reporting of the primary external validation studies was often incomplete and inadequate. Key study characteristics, such as outcome definitions, handling of missing data, and even model calibration estimates were infrequently reported. Still, we found associations between various study characteristics and a model’s predictive performance. Changes in a model’s predictive performance were notably found in relation to validation studies with a case-control (vs cohort) design, with differences in case-mix, in continent (in which the model is validated), in eligibility criteria, in clinical setting, in number of centres (included in the validation study), in differences in outcome definitions and assessments and in predictor substitutions.
Explanations, strengths and weaknesses
Based on findings in meta-epidemiological studies on the effect of study characteristics and the efficacy of interventions7–10 and diagnostic test accuracy,11 12 we anticipated to find more statistically significant associations between study characteristics and model performance across the included systematic reviews from different domains. Although we included every systematic review that described at least 10 external validation studies of the same prognostic model, resulting in more than 200 validations from 10 reviews, our analyses appeared to still be hampered by relatively low numbers of external validations per systematic review, combined with poor reporting and substantial heterogeneity within and across systematic reviews.
Conceptually, there are many potential sources of heterogeneity in model performance, such as differences in population characteristics, predictor and outcome definitions and measurements, and in many aspects of the statistical analyses (eg, dealing with missing data, sample size and selective loss to follow-up). All these characteristics may act in isolation but could also be related to each other. The individual strength of the association of one characteristic with model performance is ideally addressed by adopting multivariable (meta)-regression models with the observed model performance estimates of the validation studies as dependent variable and the characteristics of multiple design features as independent variables.10 12 Unfortunately, this approach was not feasible here due to the limited number of available, well-reported, validation studies within the individual reviews, rendering the effective sample size too small for multivariable meta-regression analyses.
A general limitation of all meta-epidemiological studies, is the possibility that the effect of a certain study characteristic differs across systematic reviews which may nullify the effect when pooled together.41 We also found numerous conflicting associations between a study characteristic and the reported predictive performance measures across reviews that were cancelled out in the pooled analyses.
Also, it is possible that the effect caused by individual study characteristics is small and therefore difficult to detect. Moreover, there might be some misclassification of study characteristics, caused either by our misinterpretation of what is reported, or by a lack of reporting, which could have diluted the effects of the study characteristics. Indeed, the c-statistic is often considered to be an insensitive measure to quantify changes in model performance.42–44 In previous simulation studies, the c-statistic and OE ratio appeared to be strongly influenced by case-mix differences,14 45 46 which may mask the possible (smaller) effects from design-related characteristics. Other measures that are less sensitive to case-mix differences, such as the calibration slope, could, however, not be studied here simply because they were (almost) never reported in our retrieved studies, as was also shown previously.3
We found greater variation in the methods used by external validation studies between models than within validations of the same model. For example, multiple imputation is the preferred method for handling missing data in prediction modelling.47 48 However, in the field of cardiovascular disease, it seems common to handle missing data by performing a complete case analysis, while in the field of mortality prediction in surgical patients, typically researchers fill in ‘normal’ values if a value is missing.
Finally, given the explorative nature of our analyses to identify potential areas of further research, we did not correct for multiple testing, though we tried to minimise the number of exploratory analyses.
Comparison to previous research
Despite above considerations, our findings, that is, the trends in the associations between study characteristics and model performance measures (though not always statistically significant), are in agreement with various previous simulation studies in this field.14 45 47–49 For example, we confirmed that studies with more variation in case-mix show higher c-statistics, and lower c-statistics when a predictor was omitted from the model. However, we found lower c-statistics in studies with a broader setting and when the number of centres in a study was higher. The lower c-statistic in multicentre studies might be caused by increased variation in predictor definitions and methods to measure predictors compared with single centre studies, where it is more likely that definitions and measurement methods have been standardised. This might result in increased measurement error in multicentre studies, which is known to lower discriminative ability of a model.50 51
We also found a higher total OE ratio in studies with a case-control design. Both simulation studies and meta-epidemiological studies in the fields of diagnostic tests and (mainly diagnostic) prediction models, have shown biased effect measures in studies using a case-control design.11–14 This confirms that case-control studies should not be used to study certain aspects of model calibration. Further, we found that the total OE ratio was influenced by the method of outcome assessment, in agreement with previous studies that showed that higher diagnostic odds ratios were found in studies with differential outcome verification.13 We also expected to find lower OE ratios when the validation population differed from the development population (eg, in terms of case-mix).14 We could not systematically confirm this across all reviews, likely caused by heterogeneity between systematic reviews as indicated by the wide confidence intervals. Finally, we could not fully confirm the association between sample size and model performance that was previously found,13 although we found similar trends in part of the reviews.
Implications for future research
In agreement with many previously conducted systematic reviews on prediction models,3 52–56 we still and again found poor reporting of prediction model studies. Meta-epidemiological studies of prediction model studies would highly benefit from complete reporting according to the TRIPOD statement.16 17 We recommend at least the following information, essential for comparing and interpreting the results of external validation studies, to be reported by every external validation study: eligibility criteria for participant inclusion, details of predictor and outcome definitions and measurements, a clear reference to the model that is being validated and any changes made to this validated model compared with the model as presented in the development study, estimates of model discrimination and calibration performance (including calibration slope and intercept) and corresponding standard errors for the original model and, if applicable, for any updated model.
We also believe that more research is urgently needed to evaluate under which circumstances certain design choices may lead to heterogeneity in prediction model performance and to incorporate these issues in the appraisal of prediction model studies. There is a need for more guidance on how to score items of critical appraisal checklists for prediction model studies, such as the CHARMS checklist.15
Several options exist to gain more empirical insight in design-related bias in prediction model studies. First, meta-epidemiological researchers can collect more external validation studies and try to correct for all issues that cause variation in performance of a model. We believe, however, that this is currently not feasible as we already included every systematic reviews describing at least 10 validations of the same prognostic model. A second and much more efficient option is to collect the individual participant data (IPD) for all studies included in this review to directly study the effect of study characteristics on model performance.57–61 Using IPD, it will also be possible to study different performance measures, like the case-mix adjusted c-statistic45 62 and calibration slope.14 Third, new simulation studies could be performed to get more insight in design-related bias in prediction model performance. Researchers could for example study the effect of using a different outcome definition or prediction horizon on the c-statistic of a model.
Conclusion
In this comprehensive meta-epidemiological study, we found empirical evidence for an association between study characteristics and predictive performance of prognostic models. We found that predictive performance of prognostic models on external validation is highly heterogeneous, but sensitive to various study characteristics, such as study design, case-mix, eligibility criteria, setting, methods of outcome definition and measurement and predictor substitution. It is important that these characteristics are thus emphasised in the reporting and appraisal of prediction model studies. However, for a large part the observed heterogeneity in model performance remained unexplained, which is likely caused by the high number of factors that cause heterogeneity in predictive performance and may act in opposite directions whereas a multivariable meta-regression analysis across reviews simply was not possible.
Acknowledgments
The authors would like to acknowledge Professor Gary S Collins (GSC) for building the database with systematic reviews of prediction models, which served as a basis for this paper.
References
Footnotes
Contributors KM, JBR, TD, LH: conceived the study. JAAGD, TD, RP, JBR, RJPMS, KM, LH: were involved in designing the study. JAAGD: selected the articles. JAAGD, RP: extracted the data. JAAGD: analysed the data in close consultation with TD. JAAGD, TD, RP, JBR, RJPMS, KM, LH: were involved in interpreting the data. JAAGD: wrote the first draft of the manuscript which was revised by TD, RP, JBR, RJPMS, KM and LH. The corresponding author attests that all listed authors meet authorship criteria and that no others meeting the criteria have been omitted. JAAGD is guarantor.
Funding TD gratefully acknowledges the Netherlands Organization for Health Research and Development (grant number 91617050). KM received a grant from The Netherlands Organization for Scientific Research (ZONMW 918.10.615 and 91208004).
Competing interests None declared.
Provenance and peer review Not commissioned; externally peer reviewed.
Data sharing statement No additional data are available.
Patient consent for publication Not required.