Article Text

Abstract
Objective To assess the effects of using health social media on different days of the working week on web activity.
Design Individually randomised controlled parallel group superiority trial.
Setting Twitter and Weibo.
Participants 194 Cochrane Schizophrenia Group full reviews with an abstract and plain language summary web page. There were no human participants.
Interventions Three randomly ordered slightly different messages (maximum of 140 characters), each containing a short URL to the freely accessible summary page, were sent on specific times on a single day. Each of these messages sent on Tuesday, Wednesday, Thursday and Friday was compared with the one sent on Monday.
Outcome The primary outcome was visits to the relevant Cochrane summary web page at 1 week. Secondary outcomes were other metrics of web activity at 1 week.
Results There was no evidence that disseminating microblogs on different days of the working week resulted in any differences in target website activity as measured by Google Analytics (n=194, all page views, adjusted ratios of geometric means 0.86 (95% CI 0.63 to 1.18), 0.88 (95% CI 0.64 to 1.21), 0.88 (95% CI 0.65 to 1.21), 0.91 (95% CI 0.66 to 1.24) for Tuesday–Friday, respectively, overall p=0.89). There were consistent findings for all outcomes. However, activity on the review site substantially increased compared with weeks preceding the intervention.
Conclusion There are no clear differences in the effect when 1 weekday is compared with another, but our study suggests that using microblogging social media such as Twitter and Weibo do increase information-seeking behaviour on health. Tweet any day but do Tweet.
- schizophrenia
- randomised controlled trials
- social media
This is an open access article distributed in accordance with the Creative Commons Attribution Non Commercial (CC BY-NC 4.0) license, which permits others to distribute, remix, adapt, build upon this work non-commercially, and license their derivative works on different terms, provided the original work is properly cited, appropriate credit is given, any changes made indicated, and the use is non-commercial. See: http://creativecommons.org/licenses/by-nc/4.0/.
Statistics from Altmetric.com
Strengths and limitations of this study
Sample size was small limiting the power to highlight real differences.
Free-to-use software limited functionality and sophisticated software may highlight more effects.
Tweeted links to large academic reviews on one area of healthcare to a relatively small ‘followings’ could limit impact.
Different techniques of microblogging, linking to less ‘weighty’ documents and a large, broad set of followers may result in more impact.
Introduction
The Cochrane Collaboration is a network of researchers, healthcare professionals, patients, carers and people interested in healthcare who largely work for free with altruistic motives to produce systematic reviews of care.1 Cochrane systematic reviews are available in the Cochrane Library (http://www.cochranelibrary.com/) and can be freely accessed in 101 countries, available to residents of a further 14 countries via subscription paid by respective governments or other organisations. It is also available for purchase at a cost or as open access if authors have paid the article processing charge.2 Each full review has a summary and abstract web page accessible to anyone with internet access3 (http://www.cochrane.org/). Cochrane Schizophrenia Group (CSzG) sits within this wider Collaboration.
Twitter is a popular4 free to use microblogging social media platform, which, at the time of the trial, allowed users to send a 140 character message called a tweet to lists of followers. A tweet may contain a hashtag (#), used as a means of searching by topic, and/or a handle (@), which denotes another Twitter user account. Although Twitter (blocked in China since 2009), and some other platforms are not available in China, the usage of social media is exceptionally high with 91% of Chinese residents using some form of social media compared with about 67% of those in the USA.5 The Twitter-like systems of Weibo and Wechat are popular in China.6 7
In 2011, CSzG began to use Twitter. @CochraneSzGroup following remains small but at the time of the study was over 1300. Our randomised trial (tweeting links vs not tweeting links of similar paired reviews8 showed that social media dissemination of reviews nearly tripled the unique page visits to each review and nearly increased threefold the time people spent visiting the Cochrane summaries page when they followed the link via a tweet.9 We subsequently identified a variety of case reports, surveys and case series’ conclusions on when to microblog (table 1). Each study stresses the importance of appreciating weekly behaviour patterns when tweeting and how to increase traffic as more tweets mean more visibility. In contrast to other social media such as Facebook, Twitter activity dies down a bit during weekends.10 For studies that compare 1 day of the week against another, conclusions are conflicting as are comparisons between weekday and weekend tweeting. Four support microblogging (tweeting) at the weekend11–14 and three during the ‘working’ week.15–17 One large survey of 4.8 million tweets reported that early morning tweets received most clicks while late evening tweets had more retweets.18 There is peak tweeting activity between the hours of 11:00 and 13:00. The best days and times to microblog in terms of site traffic are likely to differ according to the target audience. For example, tweets for shoppers may be best at the end of the week when most are shopping, and tweets of work-related information may be better during the working week.
Past analyses of differences in activity across weekdays
Given the above findings, we considered examined our own @CochraneSZGroup account by analysing data from Twitter Analytics19 for the period 1 June 2015 to 25 October 2015 (figure 1). We found the @CochraneSZGroup engagement rate to be higher during the working week than at the weekend, with the greatest activity on Thursday and Friday.
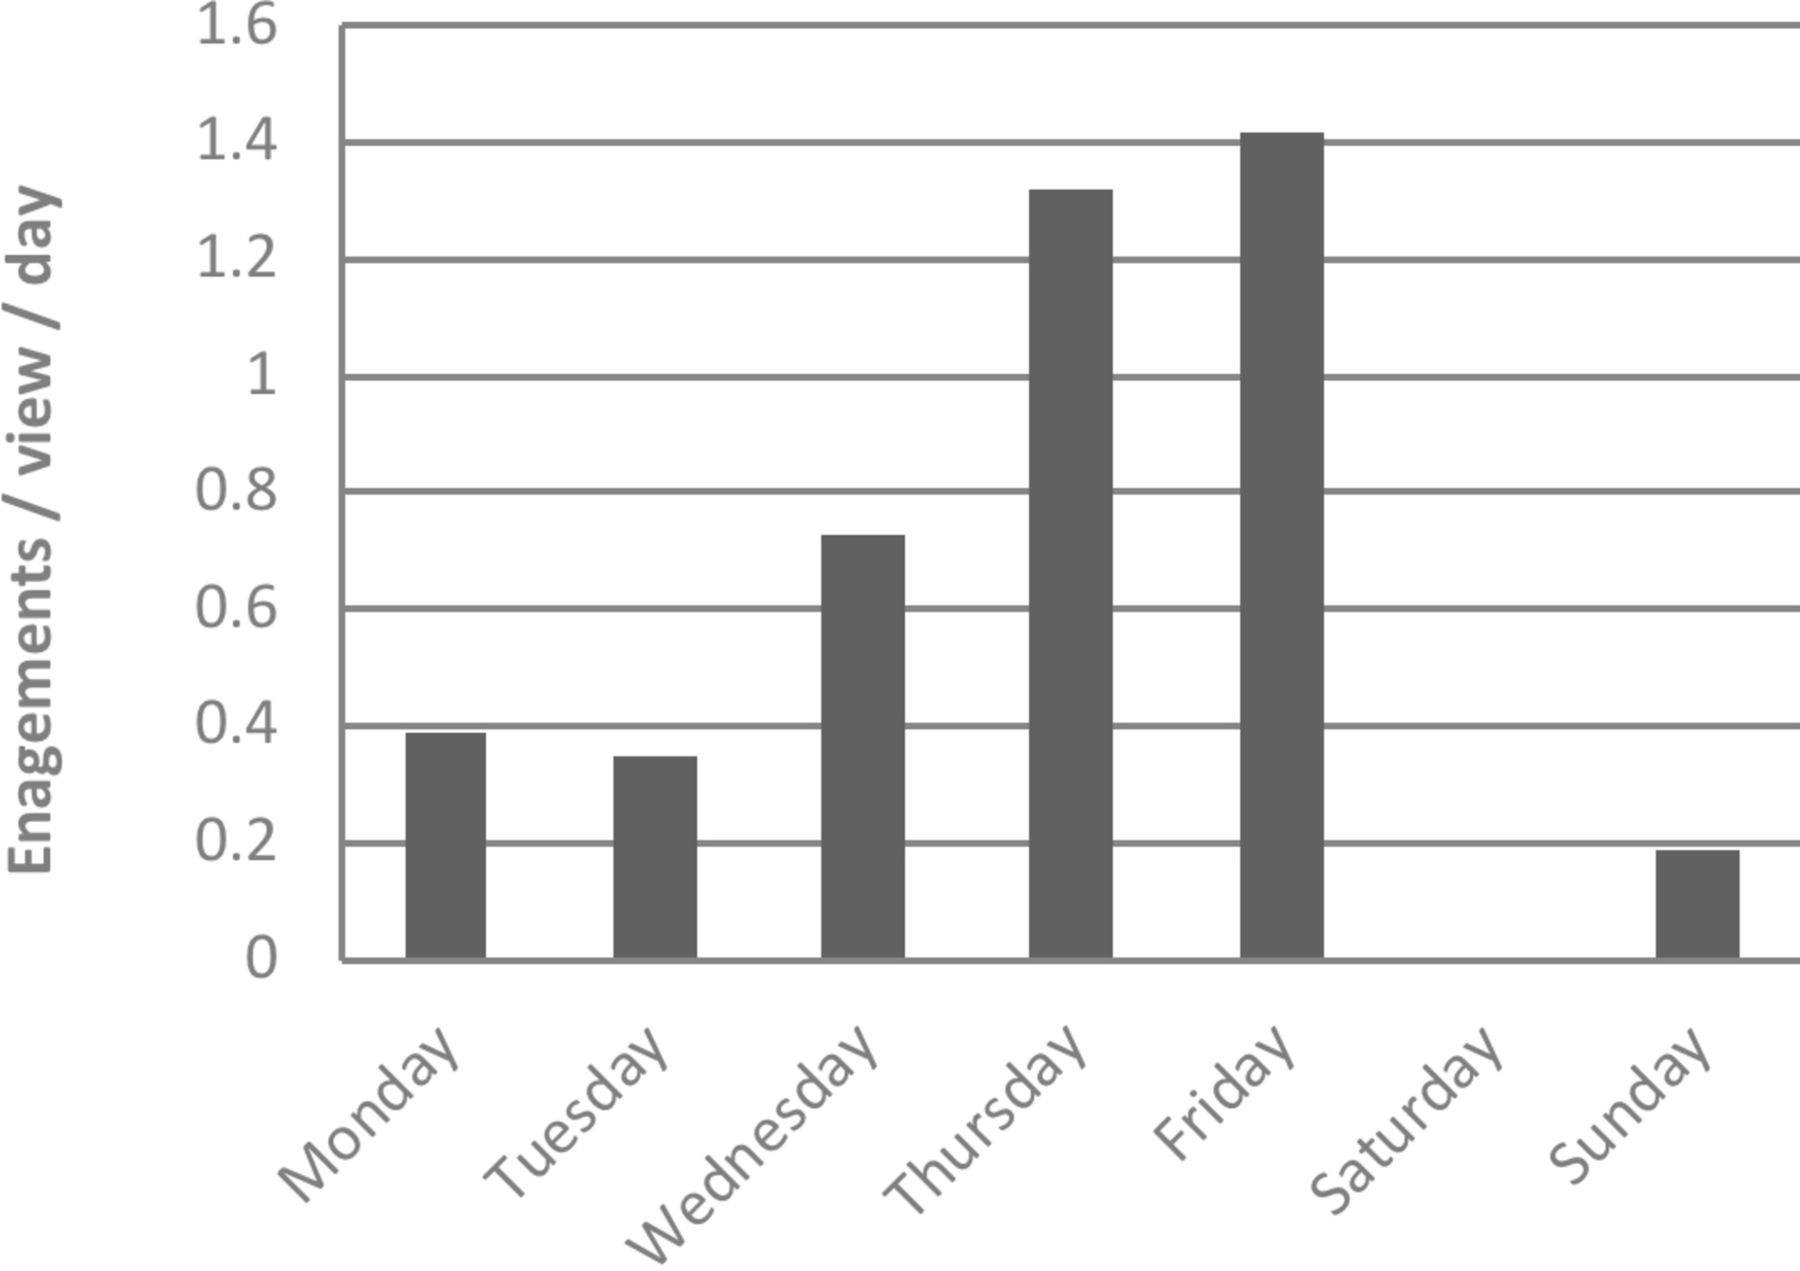
Average engagement* rate (1 June 2015 to 25 October 2015). *Engagement rate is a broad measure of Twitter activity encompassing CTR and Twitter interactions.
Objective
To evaluate whether structured microblogging of treatment evidence on any particular day of the working week (Monday–Friday) increases the ‘all page views’ metric recorded by Google Analytics. ‘All page views’ is the total number of visits to the target page. This generic outcome is routinely collected by the Google Analytics package and has been used in past work.
Methods and analysis
Study design
Prospective two-arm, parallel, open randomised controlled trial with an equal allocation. Protocol with full details of the study design has been published elsewhere.20
Patient and public involvement
Cochrane library and the Cochrane summaries pages are widely accessed by the general population, patients and carers as well as those within the healthcare industry. The research question arose from an interest in ensuring that the information within these webpages is disseminated as widely as possible and that this is done in a manner that is innovative using social media. This process of course has to have an evidence base and hence the idea of conducting a trial to evaluate whether disseminating evidence in this manner works or not. The participants in this trial were not patients, but rather systematic reviews themselves. Hence, patients were not involved in the study. There was no recruitment as such as all the systematic reviews were already published in the Cochrane library and hence the dissemination of results to patients also does not apply. Again for the above reason, the burden of intervention assessment by patients also does not apply. Patients and public were not involved in this trial.
Participants
Participants in this study were published full-text CSzG systematic reviews (date reviews published were between 2000 and 2015) in The Cochrane Library with Plain Language Summary (PLS) which is freely available at www.summaries.cochrane.org. We excluded published protocols for CSzG reviews, any CSzG review not relevant to schizophrenia, unpublished and withdrawn CSzG reviews.
This study was conducted entirely online. The participant PLSs were all available on the Cochrane Library website, the intervention was delivered via two social media platforms (Twitter and Weibo) and outcome data were collected using Google Analytics.
This study did not involve any living participants and used information that is available in the public domain. Participants are systematic reviews rather than people and routine web activity data were extracted and recorded through Google Analytics. No ethical approval was required.21 22
Randomisation
All participating CSzG systematic reviews were identified prior to randomisation. We defined reviews by tertiles of baseline access activity during the 52-week period, 1 January 2015 to 31 December 2015: high (527 to 4023 hits, n=64), medium (232 to 523 hits, n=65) or low (45 to 230 hits, n=65). Reviews were then assigned a unique code, which, along with baseline access activity stratum was supplied to one of the authors (AAM) who generated the random number sequence using a computer and performed randomisation. Stratifying by baseline activity, and using a computer-generated random number sequence, reviews were first allocated to day of the week Monday through Friday then into week number (1–39), and finally, the order in which the three microblogs (title, extract and question) would be released. Tweets had been prepared for all reviews. Allocations were then supplied by AAM to EM and SZ who, independent of other investigators, scheduled tweets for Twitter and Weibo/WeChat. We created two new usernames @CochraneSzFIN (78 followers) and @CochraneSzAuz (74 followers) to disseminate the same tweets in the Finnish language and to Australia in English.
Procedures
For the 10 weeks preceding randomisation, 20 microblogs about research relevant to schizophrenia from Mental23 were Tweeted in three tweet bundles. Tweets were split evenly to each day of the week. This ensured @CochraneSZGroup was active before the start of the trial as our activity had declined across 2015.
Between 26 January 2016 and 20 October 2016, one review in a day was tweeted in English, Finnish and Mandarin, by the CSzG, three times on the allocated day at 10:30, 13:00 and 15:00 hours local time. These timings are suggested by the SocialBro web tool as when people are likely to be most receptive.24 There is some evidence that multiple postings, 3–4 times a day, of the same or similar tweet can be useful for an international following.25 Each of the three tweets had different text:
The review title as it appears in www.summaries.cochrane.org, and a shortened URL to the summaries web page.
A pertinent extract from the results or discussion sections of the abstract, and a shortened URL to the summaries web page.
An intriguing question or pithy statement directly related to the evidence presented in the abstract and a shortened URL to the summaries web page (see box 1).
Example of the three tweets relating to same review
Tweet 1: #Clozapine combined with different #antipsychotic #drugs for #treatment resistant #schizophrenia http://ow.ly/yaKAU
Tweet 2: How effective is #clozapine in addition to another #antipsychotics at treating ’hard to treat' #schizophrenia? http://ow.ly/yaKAU
Tweet 3: Not clear if combining #clozapine with other #antipsychotics is effective for #treatment resistant #schizophrenia http://ow.ly/yaKAU
The study was designed to compare the effects of sending this package of tweets on different days of the week, rather than the specific content of the different types of accompanying text, which were formulated in order to appeal to the wide range of followers of the CSzG Twitter page and searchers. To assist the logistics of sending out tweets, we used Hootsuite, a social media management system.26 This free package allows formulation and scheduling of Tweets and is now available in China and integrates with Weibo.27
Outcomes
The primary outcome was the total number of visits to the relevant Cochrane summary page in the 7 days following the intervention (including the day of tweeting) as reported on Google Analytics. For the primary outcome, repeated views of the same page during a single user session are counted in the total (unique page views are a secondary outcome). The standard free account in Google Analytics produces various reports in real time and data about whom, when and where someone has visited a site as well as how they ‘arrived’ there.9 In this way, we monitored all traffic to the Cochrane summary page and traffic directly from Twitter. The average half-life of a tweet (with a web link), defined as ‘the amount of time at which this link will receive half of the clicks it will ever receive after it’s reached its peak’, has been estimated as 2.8 hours.28 However, to capture any possible cascade effect of tweeting, we extended the monitoring period to 7 days.29 The secondary outcomes are listed in figure 2 and provide other measures of incoming activity and exiting behaviour. For a glossary of Google Analytics terms, please see ref 20. After the final follow-up period, JSF downloaded data from Google Analytics using Supermetrics (business analytics software)30 to produce a spreadsheet for analysis.

Flow diagram.
Statistical power
The sample size for this study is fixed by the number of published Cochrane reviews within the jurisdiction of the CSzG (n=194). As a multiarm trial (five arms) with no natural control arm for comparison and a log-normal continuous primary outcome, analysis of the primary outcome is by analysis of covariance where the effect size is the ratio of between-arm and residual variances. The detectable (standardised) effect size is calculated using standard sample size software after specifying power, alpha, number of arms and number of observations per arm. This represents the ratio of between-arm and residual variances. In a one-way analysis of variance study, sample sizes of 39, 39, 39, 39 and 39 are obtained from the 5 groups whose means are to be compared. The total sample of 194 achieves 90% power to detect differences among the means versus the alternative of equal means using an F test with a 0.05 significance level. The detectable standardised effect size assumes a common SD within a group of 1.00. Therefore, the size of the variation in the means is represented by their SD which is 0.28. After taking logs of baseline number of visits for each review, the actual common SD within a group is 0.93. With a standardised detectable effect size of 0.28% and 90% power, this equates to a between-group SD of approximately 0.26 or variance (=SD2) of approximately 0.07.
Data analysis
We compared baseline access activity of the reviews in each of the five trial arms using descriptive statistics. We analysed all outcomes as continuous, with log transformation for outcomes that were positively skewed. We present descriptive statistics, and measures of effect from linear regression models using Monday as a nominal reference group. For the primary outcome and most secondary outcomes, this estimate of effect is the ratio of geometric means and 95% CIs, adjusted for baseline activity. However, as a multiarm study with no pairwise comparisons of particular interest, we derived a single p value for each outcome based on a Wald test that the model coefficients for treatment arm are jointly equal to zero. All data were analysed using Stata V.15 statistical software.
As the allocated interventions were implemented fully as planned, and there were no missing primary outcome data, we did not conduct any sensitivity analyses.
Results
Following randomisation, 194 reviews were tweeted. Table 2 outlines the baseline review activity for the year before the start of the trial. The minimum and maximum correspond to the least and most viewed reviews by allocated day of the week, respectively. There were no differences between the groups.
Baseline activity (or views) for 12 month period preceding randomisation (January–December 2015)
For this randomised trial, primary and secondary findings were consistent. Tweeting on any day between Monday and Friday was just as good as any other weekday and no clear advantage over another in terms of ratings of activity as recorded in Google Analytics (table 3). Randomised evidence from our previous trial31 suggested an approximately threefold increase in activity in the week after disseminating microblogs with hyperlinks. This study provides before-and-after evidence that this level of increase in activity continues to be realistic.
Results
Discussion
Results from this study demonstrate that there was no statistically significant difference between tweeting on Monday or any day of the week for our primary outcome of ‘all page views’. Equally, there were no clear differences found for any of the secondary outcomes. There are many possibilities why this was so. It is possible that a real effect has failed to be detected in this necessary small trial or the form of the microblogs may not have encouraged differential responses. Perhaps, however, for this type of tweet and Twitter following there is no substantial advantage to microblogging on one working day compared with another.
There was, however, an increase in viewing activity compared with the months prior to the study. This fits with the finding of our previous randomised trial.31 In that 2013–2014 study, the control group had an arithmetic mean of 5.28 ‘all page views’ and this increased in the tweet arm to 13.67. After that trial ended, there was a general increase in baseline activity as evidenced by the data we collected for the year prior to this trial (table 2). Despite this increased baseline activity, tweeting in this study seemed to increase activity by a further threefold. There is a suggestion that interest is increasing and that this has not plateaued. The other comparable variable between the two trials is ‘time spent on page’. In this study, time on page was considerably greater than in our first trial (geometric mean 123 vs 76 s).
Much investment is made to disseminate evidence of the effects of healthcare but the strategies by which this is done are rarely investigated. Increasingly, more funding bodies are prioritising dissemination strategies as part of evaluating successful grant applications and decision-making tools are available to support this.32 33 Medical evidence of enormous impact will disseminate swiftly by every means possible with very little effort beyond the point of disclosure of findings. Maximising impact of most other health evidence does take more effort beyond the publication of the final report. Many choices are available to individuals, institutions and industry and resources limit what can be done but social media is ubiquitous, inexpensive and—as this study continues to suggest—powerful. The first randomised trial in our series illustrated that using a microblog causes nearly a tripling of traffic to a health evidence web page.31 This study supports that finding with the non-randomised before and after hit rates but adds randomised evidence that which day of the week dissemination takes place on does not matter that much. This higher quality evidence does not support the impression we gained form initial routine data analysis (table 1, figure 1) and, again, highlights the value of gaining evidence from randomised trials if possible before embarking on policy based solely on routine data. Perhaps with greater numbers and more power, we would have shown a real difference favouring Monday over the other days as this seemed the only day to have a little more activity than any of the others. This, however, is conjecture and any difference, for this set of evidence, for this following, would be subtle. Our trial tweeted between the hours of 10: 30 and 15: 00 hours local time and this could be a limitation in the local context where it is possible that more professional social media users have sight of it. However, given the global reach of tweets and access across time zones, we believe the impact of this would be minimal. Perhaps further studies could explore this aspect.
There remain many more questions on which type of social media delivers best impact on health behaviour, and on what content, timing and targeting maximally encourages best evidence to be considered and then implemented. Few techniques or tools have been demonstrated to swiftly influence behaviour of those seeking information on health. Social media are accessible tools and it is possible to evaluate how we use them and then use them in a way that does not waste effort or interest.
Conclusions
Use of social media in an area of healthcare that is not particularly high profile, for dissemination of evidence that is highly specialised to a small following continues to have a genuine effect on increasing indicators of interest—but we have no evidence that use of social media on any particular working day of the week matters. This study continues to support the initial finding from the first randomised trial where the use of social media (Twitter/Weibo) almost immediately nearly tripled activity on the reviews’ summary page. For those interested in wider dissemination of evidence, tweet any working day, but do tweet.
Ethics and dissemination
This study does not involve any living participants and uses information that is available in the public domain. Participants in this study are systematic reviews rather than people. The http://www.cochrane.org/ and the Cochrane Library websites will be the target outcomes and the routine data will be extracted and recorded through Google Analytics. As a result, no ethical approval is required.21 22 Results will be disseminated via Twitter, Weibo and other traditional academic means.
Trial organisation
This study did not have a data monitoring committee or a steering committee.
Acknowledgments
We are really grateful to Julie Wood, Head of External Affairs and Communications, Cochrane Central Executive and Paolo Rosati Web Operations Manager, Informatics and Knowledge Management Department, Cochrane Central Executive who were supportive of the idea and practical in helping it move forward. Farhad Shokraneh, Information Specialist of the Cochrane Schizophrenia Group is, as always, a rock of support and help in times of need.
Footnotes
Contributors MJ, CEA, AAM, MV and EM designed the protocol and helped draft the manuscript. CEA and EM wrote the tweets and coordinated the UK, Finland and Australia arm of the trial. JSF and LS wrote the computer program to retrieve data from Google Analytics. AAM analysed the data. SZ translated tweets into Chinese and JX coordinated the China/Weibo/Wechat arm of the trial. MV translated tweets into Finnish. MJ and CEA finalised the manuscript, double checked the data and hold all data. MJ has coordinated all revisions and re submissions. MJ will make data available through the University of Melbourne server. All authors provided critical feedback and helped shape the research, analysis and manuscript. All authors are accountable for accuracy and integrity of the work. All authors read and approved the final manuscript.
Funding Intramural funding from the University of Nottingham, University of Melbourne and the University of Aberdeen. Economic and Social Research Council Impact Acceleration Account (IAA) funding to support conduct and dissemination of this work (ESRC IAA University of Nottingham).
Competing interests None declared.
Provenance and peer review Not commissioned; externally peer reviewed.
Data sharing statement The data will be made available via the University of Melbourne repository.
Patient consent for publication Not required.